


Abstract
Chronic inflammation in treated HIV infection is associated with mortality and atherosclerotic cardiovascular disease (ASCVD). We evaluated the safety and potential efficacy of low-dose methotrexate (LDMTX) in treated HIV.
This was a phase 2 randomized, double-blind, multicenter trial in adults ≥40 years old with treated HIV, with CD4+ T-cell count ≥400 cells/μL and with/at increased risk for ASCVD. Participants received LDMTX (5–15 mg/week) or placebo (plus folic acid) for 24 weeks and were followed for an additional 12 weeks. Primary endpoints were safety and brachial artery flow-mediated dilation (FMD).
The 176 participants (90% male) had a median (Q1, Q3) age of 54 (49, 59) years. LDMTX was associated with decreases in CD4+ T cells at week 24 and CD8+ T cells at weeks 8, 12, and 24. Eleven participants (12.8%) experienced safety events in the LDMTX group vs 5 (5.6%) in placebo (Δ = 7.2%, upper 1-sided 90% CI, 13.4%; Pnoninferiority = .037). Week 24 change in FMD was 0.47% with LDMTX and 0.09% with placebo (P = .55). No inflammatory markers changed differentially with LDMTX compared to placebo.
Adults with HIV and increased ASCVD risk treated with LDMTX had more safety events than with placebo, but the prespecified noninferiority margin of 15% was not exceeded. LDMTX had no significant effect on endothelial function or inflammatory biomarkers but was associated with a significant decrease in CD8+ T cells. The balance of risks and potential benefits of LDMTX in this population will require additional investigation.
NCT01949116.
People with human immunodeficiency virus (HIV) on antiretroviral therapy (ART) are at increased risk for atherosclerotic cardiovascular disease (ASCVD), possibly due to inflammation that persists despite virologic suppression [1–3]. Patients with rheumatoid arthritis (RA) and psoriatic arthritis also have high levels of inflammation and an increased risk for developing ASCVD [4, 5]. Low-dose methotrexate (LDMTX) is commonly used to treat RA and other inflammatory diseases. In several large cohort studies, LDMTX therapy was associated with a consistently lower risk of ASCVD [6–10]. Based on these observations, a large randomized clinical trial evaluating the effects of LDMTX for secondary prevention of ASCVD events and mortality in individuals with or at high risk for ASCVD (the Cardiovascular Inflammation Reduction Trial [CIRT], NCT01594333) recently ended, but it excludes persons with HIV infection, and its results have not been reported [11].
Although CD4 depletion is a hallmark of HIV disease progression, T-cell activation and inflammation play key roles in HIV disease pathogenesis [12]. In the RA population, methotrexate (MTX) has reduced T-helper populations along with inflammatory cytokines [13]. Among individuals with HIV, inflammatory and coagulation biomarkers predict serious non-AIDS events including ASCVD and mortality in treated HIV [3]. Identifying strategies to reduce inflammatory T-cell populations as well as inflammatory cytokines may be helpful in reducing clinical events in this population. To determine if LDMTX was safe, tolerable, and had the potential to reduce ASCVD risk in individuals with treated HIV, we performed a randomized, double-blind, placebo-controlled clinical trial. The main objectives of our study were to evaluate the safety of LDMTX in and its effects on endothelial function in individuals with HIV infection. Secondary outcomes evaluated the impact of LDMTX on inflammatory and coagulation markers.
METHODS
See the Supplementary Methods for additional details.
Study Participants and Design
AIDS Clinical Trials Group Study A5314 (NCT01949116) was a phase 2 randomized, double-blind, placebo-controlled multicenter trial of 36 weeks’ duration for adults with treated and suppressed HIV, either with or at risk for ASCVD. Eligibility criteria included HIV type 1 (HIV-1) infection, age ≥40 years, and receiving continuous ART with CD4+ T-cell count ≥400 cells/μL and an HIV-1 RNA level <40 copies/mL for at least 24 weeks prior to study entry and confirmed within 60 days prior to study entry. Participants were required to be at moderate risk for ASCVD as defined in the Supplementary Methods.
Eligible participants were randomized 1:1 to LDMTX therapy or placebo (Division of AIDS Pharmaceutical and Chemical Resource for AIDS Drug Development, Metrics Contract Services, Greenville, North Carolina). Individuals were started on 5 mg weekly of study drug or placebo at study entry and, if tolerated after week 1, the dose was increased to 10 mg weekly through week 12. If well-tolerated, the dose was increased to the maximum dose of 15 mg weekly until week 24, at which time the study medication or placebo was discontinued. In both the active study drug and placebo arm, 1 mg folic acid was given daily at study entry and continued for an additional 4 weeks after week 24. Participants who did not meet the criteria for dose escalation at the week 1 or 12 study visit remained on the same dose until the next study visit, when the participant was reevaluated for dose escalation. All participants continued taking folic acid for an additional 4 weeks after completion of study treatment.
Study Endpoints
The primary safety endpoint was the occurrence of any of the following safety milestones in Table 1 from entry to week 36. The primary efficacy endpoint was the change from baseline to week 24 in brachial artery flow-mediated dilation (FMD), calculated as the ratio between the largest post-cuff release and the resting diameter. Change in posthyperemic maximum flow velocity also was evaluated. Secondary endpoints included inflammatory and coagulation biomarkers.
Safety Endpoints
| • Confirmed CD4+ T-cell decline (>33% of baseline and to <350 cells/μL for participants with entry CD4+ T-cell count <700 cells/μL; >50% of baseline for participants with entry CD4+ T-cell count ≥700 cells/μL) |
| • Virologic failure (confirmed HIV-1 RNA level >200 copies/mL in the absence of ART interruption) |
| • New or recurrent CDC category C AIDS-indicator condition |
| • HIV-associated infection including: |
| ◦ Cytomegalovirus end-organ disease |
| ◦ Varicella zoster |
| ◦ Epstein-Barr virus–related clinical disease |
| • Confirmed grade 3 or higher treatment-limiting toxicity |
| • Lymphoproliferative malignancy |
| • Pulmonary toxicity (grade 3 or 4 dyspnea, cough, shortness of breath related to the study drug without other clinical causes) |
All potential safety events were reviewed by an independent endpoint review committee, which included a rheumatologist and HIV physician.
Abbreviations: ART, antiretroviral therapy; CDC, Centers for Disease Control and Prevention; HIV, human immunodeficiency virus; HIV-1, human immunodeficiency virus type 1.
Brachial Artery Reactivity and Laboratory Testing
As previously described, participants were required to fast, not smoke, and not drink caffeinated products for at least 8 hours prior to ultrasound and laboratory testing [14–16].
Laboratory Testing
Standard hematology and chemistry laboratory testing was performed at the individual sites and HIV RNA levels were sent directly to Quest Diagnostics (Baltimore, Maryland). Plasma and serum samples were sent to the Biomedical Research Institute (Rockville, Maryland) for storage at –70°C, then sent to Case Western Reserve University for measurement of the following inflammatory biomarkers by Quantikine enzyme-linked immunosorbent assay (ELISA; R&D Systems, Minneapolis, Minnesota): high-sensitivity C-reactive protein (hsCRP), interleukin 6 (IL-6), CD163, CD14, vascular cell adhesion module, and interferon-γ–inducible protein 10. The same lab also measured D-dimer using an immunoassay (Diagnostic Stago, Mount Olive, New Jersey) and fibrinogen using a human ELISA kit (AbCam, Cambridge, Massachusetts).
Statistical Analysis
The primary safety analysis evaluated whether LDMTX provided no greater than a 15-percentage-point higher occurrence of safety events than the placebo group by week 36 (ie, a noninferiority hypothesis using a noninferiority bound of 15%). This was evaluated using the exact upper 1-sided 90% confidence limit on the difference using a Farrington-Manning exact score interval with a 1-sided type 1 error rate of 10%. The primary efficacy analysis examined the change from baseline in brachial artery FMD (%) between the 2 study groups after 24 weeks using a stratified (by current statin use at study entry) Wilcoxon rank-sum test. The study was powered (90%) to detect an absolute 1.5% difference in FMD between the study groups using a 2-sided type 1 error rate of 5%.
The sample size was determined based on the primary efficacy endpoint while ensuring that the study will be well powered to demonstrate the primary safety endpoint. The study was powered (90%) to detect a clinically relevant, 1.5% absolute difference in FMD between the study groups using a 2-sided type 1 error rate of 5% [15, 17–19]. It was estimated that this sample size would provide 87% power to demonstrate that the absolute difference in the probability of a safety endpoint between the 2 treatment strategies was <15%. This assumed an underlying true probability of safety endpoints of 8% with placebo compared to 10% with LDMTX. The underlying rate of safety events in the placebo group used in this calculation was based on an evaluation of the ACTG A5001 study database (NCT00001137).
Planned enrollment was 200 participants, but enrollment closed after 176 participants enrolled because an interim evaluation revealed better retention than expected and a lower standard deviation (SD) of the change in FMD from baseline to week 24 than had been anticipated, indicating adequate power with this number of participants.
All 2-sample contrasts used the Wilcoxon rank-sum test. Within-group changes in continuous outcomes were assessed using the Wilcoxon signed-rank test. Supportive adjusted analyses and evaluation of effect modification by statin use and by qualifying ASCVD risk factor used normal errors linear regression. All P values are presented at their nominal level with no formal adjustment for multiple comparisons.
RESULTS
Enrollment and Protocol Conduct
A total of 176 participants from 22 clinical sites were enrolled out of a total of 362 screening attempts; the last participant visit occurred on 8 December 2016 (Figure 1; Supplementary Table 1). There were 86 participants randomly assigned to receive LDMTX and 90 to receive placebo; 59% (n = 103) reported statin use at randomization. One hundred sixty-one (91%) participants completed the study and their assigned treatment per protocol (91% LDMTX, 92% placebo). Eight participants (5%) completed the study per protocol but discontinued treatment: 5 in the LDMTX group (6%) and 3 (3%) in the placebo group. Reasons for treatment discontinuation were protocol-defined toxicity (2 participants in the placebo group), protocol-defined clinical events (2 LDMTX, 1 placebo), and non-protocol-defined clinical events (3 participants in the LDTMX group). More than 90% of participants reported 100% adherence to LDMTX/placebo across all study weeks.
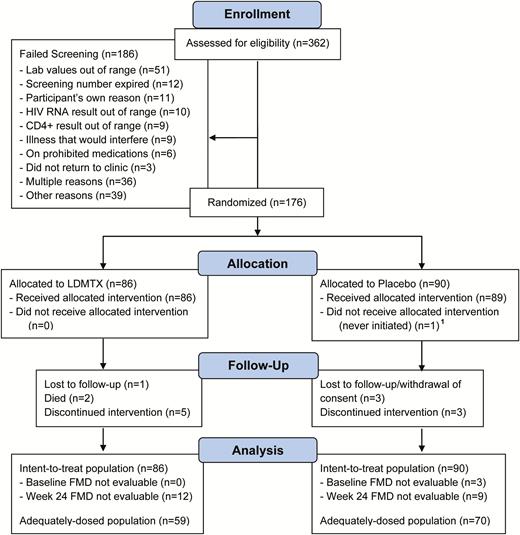
A5314 Consolidated Standards of Reporting Trials (CONSORT) diagram. AIDS Clinical Trials Group Study A5314 was a phase 2 randomized, double-blind, placebo-controlled multicenter trial of 36 weeks’ duration for treated and suppressed human immunodeficiency virus–infected individuals either with or at risk for atherosclerotic cardiovascular disease. Participants were randomized 1:1 to low-dose methotrexate therapy or placebo. Individuals were started on 5 mg weekly of study drug or placebo at study entry and, if tolerated after week 1, the dose was increased to 10 mg weekly through week 12. The dose was further increased to the maximum dose of 15 mg weekly until week 24, at which time study medication or placebo was discontinued. In both the arms, 1 mg folic acid was taken daily and continued for an additional 4 weeks after week 24. Monitoring for safety outcomes and other side effects continued through week 36. Abbreviations: ASCVD, atherosclerotic cardiovascular disease; FMD, flow- mediated dilation; HIV, human immunodeficiency virus; LDMTX, low-dose methotrexate.
Participant Characteristics
Participant characteristics at study entry are shown in Table 2. The median (Q1, Q3) age was 54 (49, 59) years and 90% were male (n = 159); 42% self-reported as non-Hispanic white, 42% as non-Hispanic black, 15% as Hispanic. Median (Q1, Q3) CD4+ T-cell count was 726 (552, 940) cells/μL. Six participants had HIV-1 RNA levels below the limit of detection during screening but greater than the assay limit of quantification at study entry (range, 40–5222 copies/mL): 2 assigned to LDMTX and 4 to placebo. Only 32 participants (18%) had established ASCVD, 39 (22%) had controlled type 2 diabetes mellitus, and 105 (60%) had other ASCVD risk factors. The median (Q1, Q3) calculated 10-year ASCVD risk [20] was 8.7% (5.1%, 13.0%). There was a chance imbalance between the groups with respect to ASCVD risk factors that appeared to have been driven by an imbalance in smoking history.
Participant Characteristics at Entry
| Characteristic | Treatment Assignment | ||
|---|---|---|---|
| All | LDMTX | Placebo | |
| No. | 176 | 86 | 90 |
| Age, y | 54 (49, 59) | 55 (51, 60) | 53 (49, 56) |
| Male sex, No. (%) | 159 (90) | 78 (91) | 81 (90) |
| CD4+ count, T cells/μL | 726 (552, 940) | 689 (551, 910) | 729 (569, 947) |
| CD8+ count, T cells/μL | 813 (571, 1075) | 813 (546, 1023) | 817 (596, 1136) |
| Prior ASCVD, No. (%) | 32 (18) | 20 (23) | 12 (13%) |
| 10-year ASCVD risk, No. (%) | 8.7 (5.1, 13.0) | 10.1 (5.4, 14.3) | 7.9 (5.0, 12.4) |
| Never smoker, No. (%) | 65 (37) | 38 (45) | 27 (30) |
| Current nonsmoker, No. (%) | 108 (61) | 58 (67) | 50 (56) |
| Weight, kg | 86 (75, 97) | 88 (76, 99) | 84 (74, 96) |
| Total cholesterol, mg/dL | 174 (156, 208) | 178 (155, 216) | 170 (156, 190) |
| Triglycerides, mg/dL | 135 (95, 198) | 128 (91, 204) | 143 (99, 194) |
| HDL cholesterol, mg/dL | 44 (36, 56) | 45 (37, 58) | 43 (35, 54) |
| LDL cholesterol, mg/dL | 95 (76, 125) | 101 (72, 132) | 92 (79, 119) |
| Glucose, mg/dL | 93 (86, 102) | 94 (87, 109) | 92 (84, 101) |
| On aspirin, No. (%) | 71 (40) | 39 (45) | 32 (36) |
| On lipid-lowering medication, No. (%) | 112 (64) | 55 (64) | 57 (63) |
| Statin use, No. (%) | 103 (59) | 51 (59) | 52 (58) |
| On antihypertensive medication, No. (%) | 124 (70) | 61 (71) | 63 (70) |
| On antiglycemic medication, No. (%) | 38 (22) | 17 (20) | 21 (23) |
Data are presented as median (Q1, Q3) unless noted otherwise.
Abbreviations: ASCVD, atherosclerotic cardiovascular disease risk; HDL, high-density lipoprotein; LDL, low-density lipoprotein; LDMTX, low-dose methotrexate.
Safety and Safety Endpoints
Hematologic, hepatic, and renal laboratory test results were similar between groups across the entirety of the study. There was no significant difference in change in CD4+ T cells in the LDMTX group vs placebo at weeks 4, 8, or 12 but there was a significant difference at week 24 (median change, –58 CD4+ T cells/μL for LDMTX vs +2 for placebo; P = .016).After 12 weeks of treatment discontinuation, differences no longer were present (Figure 2). The LDMTX group had a greater decrease in CD8+ T cells at weeks 8, 12, and 24 (median change, –103 CD8+ T cells/μL for LDMTX vs –2 for placebo, P = .001; Figure 2). The CD4/CD8 ratio was not different between the study groups at any time point (all P > .27). Across all study weeks, 16 participants (evenly distributed by group) had at least 1 HIV-1 RNA level above the assay quantification limit (40 copies/mL). Cytomegalovirus (CMV) was detected in postentry testing at weeks 4, 12, 24, and 36) in 1 participant in each group (1 of 27 participants treated with LDMTX and 1 of 21 treated with placebo); both were transient and only detected at 1 visit (the week 12 and 24 visits, respectively). Given this finding, future CMV testing of the remaining study participant samples was not performed.
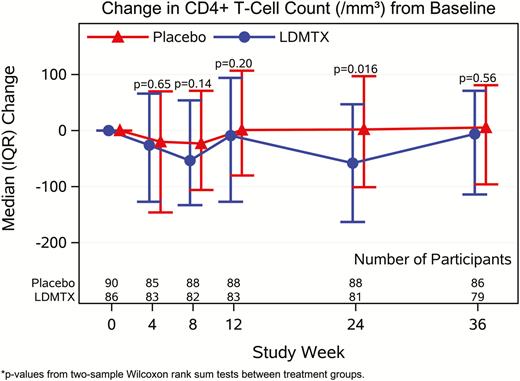
Effects of low-dose methotrexate (LDMTX) on CD4+ (A) and CD8+ (B) T cells from baseline through 36 weeks. LDMTX was associated with a modest decrease in CD4+ T-cell count that was significant at week 24 only (median change of –58 CD4+ T cells/μL for LDMTX vs + 2 for placebo, P = .016) but this difference did not persist at 12 weeks after treatment ended. The LDMTX arm had a significantly greater decrease in CD8+ T cells at weeks 8, 12, and 24 (median decrease of –103 CD8+ T cells/μL for LDMTX vs –2 for placebo, P = .001). Abbreviations: IQR, interquartile range; LDMTX, low-dose methotrexate.
There were 11 (12.8%) safety events in the LDMTX group vs 5 (5.6%) in the placebo group (∆ = 7.2%, upper 1-sided 90% confidence limit = 13.4%; Pnoninferiority = .037) (Figure 3). The most frequently reported events were infections, including 7 cases of pneumonia (4 in the LDMTX and 3 in the placebo groups), 3 confirmed CD4+ T-cell declines of ≥50% (all in the LDMTX group), 2 Centers for Disease Control and Prevention category C events (both recurrent pneumonia, 1 in each group), 2 treatment-limiting toxicities (1 in each group), and 2 pulmonary toxicities (severe cough, both in the LDMTX group). No lymphoproliferative malignancies or confirmed virologic failure events were observed. There were 2 deaths, both in the LDTMX group. The primary causes of death were a subdural hemorrhage from a fall (not considered to be related to study treatment) and pneumococcal pneumonia. The latter event occurred 23 days into study treatment in a participant who had received 3 doses of LDMTX (one 5-mg dose and two 10-mg doses) and who was vaccinated 10 years earlier. It was considered possibly related to study treatment by the site investigator. CD4+ T-cell count congruent to the pneumonia diagnosis was 36 cells/μL compared with 700 cells/μL at study entry; no CD4+ T-cell measures were available at intermediate time-points. The most recent HIV-1 RNA evaluation prior to death was <40 copies/mL.
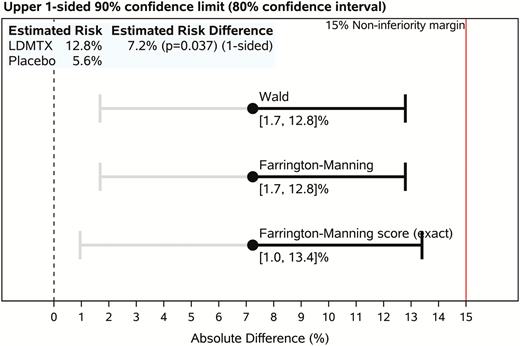
A5314 primary safety event endpoint analysis. Upper 1-sided confidence limit for between-group risk differences. Per the study design, inference regarding the safety of low-dose methotrexate (LDMTX) is based on whether the exact (Farrington-Manning score) upper 1-sided 90% confidence limit (ie, accepting a 1-sided 10% type 1 error rate) on the difference in the proportions of participants reaching a primary safety milestone event in the 2 study groups (ie, the absolute risk difference, LDMTX – placebo) is <15 percentage points. Although all inference is based on the upper 1-sided confidence limit, a 2-sided (80%) confidence interval is shown for reference. Intervals estimated using asymptotic methods (Wald and Farrington-Manning) also are shown. The P value for the risk difference is from an asymptotic noninferiority analysis for the proportion (risk) difference with a 15% noninferiority margin. Abbreviation: LDMTX, low-dose methotrexate.
Study Monitoring
A5314 underwent annual safety reviews by the Study Monitoring Committee of the End-Organ Disease and Inflammation Transformative Science Group of the ACTG with membership augmented to include the independent endpoint review committee.
Primary Efficacy Endpoint: Brachial Artery FMD
A total of 154 participants had paired baseline and week 24 scans available and were evaluable for the primary endpoint. For 3 participants, FMD scans could not be evaluated at baseline (1 participant was not afebrile, 2 scans were unsatisfactory). Twenty-one participants were not evaluable for FMD at week 24. Missing FMD scans at week 24 were due to the following reasons: 8 scans were not performed (5 participants were off-study, 1 missed the visit, and there were 2 site errors) and 13 scans were excluded (7 due to unsatisfactory image quality, 2 participants were not afebrile, and 4 were out of the examination window).
There was no change in brachial artery FMD after 24 weeks in the LDMTX (P = .24) or placebo group (P = .65) (Figure 4) and no treatment group difference (stratified mean difference, 0.09% [95% confidence interval, –.67% to .85%]; P = .55) (Table 3). These findings were unchanged in sensitivity analyses that adjusted for baseline brachial artery diameter, type of qualifying ASCVD risk factor, and smoking history (data not shown). There was no differential treatment effect of LDMTX on FMD by statin use (Pinteraction = .54). There were no changes through week 24 or differences between LDMTX and placebo groups in reactive hyperemic flow rates or velocities (all P > .5; Table 3).
Primary Efficacy Analyses: Brachial Artery Ultrasound Measures by Treatment Group at Baseline and Changes After 24 Weeks in the Intention-to-Treat Population
| Ultrasound Measure | Overall | LDMTX | Placebo | P Value Treatment Group Difference | |
|---|---|---|---|---|---|
| Brachial artery FMD, % | |||||
| Week 0 | No. | 173 | 86 | 87 | |
| Median (Q1, Q3) | 3.45 (2.10, 4.91) | 3.54 (2.19, 4.91) | 3.41 (1.98, 5.03) | ||
| Δ to week 24 | No. | 154 | 74 | 80 | |
| Median (Q1, Q3) | 0.15 (–1.15, 1.51) | 0.47 (–1.14, 1.64) | 0.09 (–1.27, 1.46) | ||
| P value | .27 | .24 | .65 | .55 | |
| Resting average diameter, mm | |||||
| Week 0 | No. | 173 | 86 | 87 | |
| Median (Q1, Q3) | 4.62 (4.20, 5.08) | 4.66 (4.23, 5.16) | 4.61 (4.12, 4.96) | ||
| Δ to week 24 | No. | 154 | 74 | 80 | |
| Median (Q1, Q3) | 0.00 (–0.10, 0.13) | –0.00 (–0.11, 0.13) | 0.01 (–0.10, 0.12) | ||
| P value | .86 | .87 | .91 | .99 | |
| Peak RH flow velocity, cm/sec | |||||
| Week 0 | No. | 171 | 86 | 85 | |
| Median (Q1, Q3) | 131.8 (108.7, 155.3) | 132.0 (108.6, 156.9) | 131.6 (110.0, 149.1) | ||
| Δ to week 24 | No. | 150 | 74 | 76 | |
| Median (Q1, Q3) | –0.35 (–13.3, 15.3) | –0.20 (–11.3, 14.4) | –0.83 (–16.8, 16.9) | ||
| P value | .97 | .79 | .83 | .73 | |
| RH flow rate, cc/min | |||||
| Week 0 | No. | 171 | 86 | 85 | |
| Median (Q1, Q3) | 840 (614, 1052) | 859 (649, 1080) | 813 (603, 1046) | ||
| Δ to week 24 | No. | 150 | 74 | 76 | |
| Median (Q1, Q3) | –6.25 (–98.9, 121.3) | –11.4 (–97.5, 161.6) | 13.8 (–135, 107.7) | ||
| P value | .83 | .61 | .78 | .64 | |
P values are from Wilcoxon signed-rank tests within groups and overall and 2-sample Wilcoxon rank-sum tests between treatment groups, stratified by statin use at study entry.
Week 0 results were unavailable for 3 participants (unsatisfactory scan, n = 2; not afebrile, n = 1). Change to week 24 results were unavailable for 22 participants (out of window, n = 4; site error, n = 2; unsatisfactory scan, n = 7; not afebrile, n = 2; no matching baseline, n = 1; off-study or missed visit, n = 6).
Abbreviations: FMD, flow-mediated dilation; LDMTX, low-dose methotrexate; RH, reactive hyperthermia.
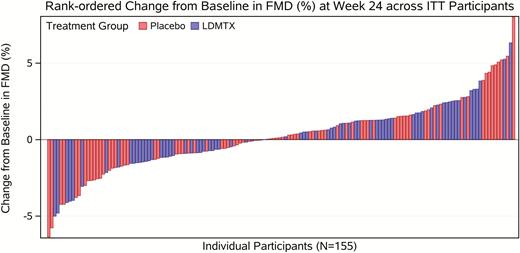
Rank-ordered change in brachial artery flow-mediated dilation from baseline to 24 weeks (intention-to-treat analysis, n = 154). Change in endothelial function as assessed by flow-mediated vasodilation of the brachial artery is shown above with each bar representing an individual participant. A total of 154 participants had paired baseline and week 24 scans available. The red color indicates placebo group and the blue is the low-dose methotrexate arm. Overall, there was no significant change in brachial artery diameter after 24 weeks in the low-dose methotrexate or placebo group, even after adjustment for resting brachial artery diameter. Abbreviations: FMD, flow-mediated dilation; ITT, intention-to-treat; LDMTX, low-dose methotrexate.
Secondary Efficacy Endpoints: Inflammatory Biomarkers
In the adequately dosed population of 126 participants, there were no significant between-group differences in biomarkers at baseline or across all study weeks (Table 4). Values for all biomarkers were highly variable between and within participants at all visits, with the exception of IL-6. IL-6 levels increased over time in both groups, but no differences between treatment groups were apparent at week 24 (P = .60). Similarly, no treatment group differences were observed in soluble levels of the inflammatory biomarkers of monocyte/macrophage activation (CD163 and CD14).
Secondary Efficacy Analyses: Inflammatory Biomarkers at Baseline and Changes After 24 Weeks in Adequately Dosed Population
| Biomarker | Overall | LDMTX | Placebo | P Value Treatment Group Difference | ||
|---|---|---|---|---|---|---|
| hsCRP, μg/mL | ||||||
| Week 0 | No. | 126 | 57 | 69 | ||
| Median (Q1, Q3) | 2.26 (1.12, 4.31) | 2.47 (1.35, 5.49) | 2.05 (1.02, 4.08) | |||
| Δ to week 24 | No. | 124 | 55 | 69 | ||
| Median (Q1, Q3) | +8.3% (–40.4, +70.0) | +9.5% (–45.7, +82.8) | +6.9% (–40.0, +63.0) | |||
| P value | .73 | .97 | .70 | .85 | ||
| IL-6, pg/mL | ||||||
| Week 0 | No. | 126 | 57 | 69 | ||
| Median (Q1, Q3) | 1.48 (1.06, 2.01) | 1.54 (1.10, 1.91) | 1.43 (1.01, 2.04) | |||
| Δ to week 24 | No. | 125 | 56 | 69 | ||
| Median (Q1, Q3) | +7.2% (–20.6, +65.8) | +5.2% (–15.9, +47.0) | +13.8% (–24.1, +85.8) | |||
| P value | .009 | .15 | .037 | .60 | ||
| IP-10, pg/mL | ||||||
| Week 0 | No. | 126 | 57 | 69 | ||
| Median (Q1, Q3) | 141.4 (97.1, 192.0) | 138.6 (94.6, 177.0) | 141.4 (101.8, 201) | |||
| Δ to week 24 | No. | 125 | 56 | 69 | ||
| Median (Q1, Q3) | –2.1% (–18.7, +25.0) | –4.0% (–21.2, +25.7) | –1.0% (–18.6, +21.1) | |||
| P value | .87 | .53 | .81 | .55 | ||
| sCD163, ng/mL | ||||||
| Week 0 | No. | 126 | 57 | 69 | ||
| Median (Q1, Q3) | 402 (274, 541) | 371 (280, 509) | 435 (273, 592) | |||
| Δ to week 24 | No. | 125 | 56 | 69 | ||
| Median (Q1, Q3) | +2.7% (–11.7, +21.3) | –1.4% (–12.3, +12.9) | +8.1% (–10.8, +33.3) | |||
| P value | .14 | .81 | .05 | .15 | ||
| sCD14, μg/mL | ||||||
| Week 0 | No. | 126 | 57 | 69 | ||
| Median (Q1, Q3) | 1.86 (1.53, 2.23) | 1.86 (1.51, 2.21) | 1.86 (1.60, 2.24) | |||
| Δ to week 24 | No. | 125 | 56 | 69 | ||
| Median (Q1, Q3) | +1.3% (–10.4, +14.0) | –1.7% (–11.7, +15.7) | +3.7% (–9.0, +12.9) | |||
| P value | .44 | .90 | .22 | .33 | ||
| D-dimer, ng/mL | ||||||
| Week 0 | No. | 126 | 57 | 69 | ||
| Median (Q1, Q3) | 144.2 (99.2, 205) | 152.8 (111.2, 222) | 141.0 (90.4, 173.2) | |||
| Δ to week 24 | No. | 125 | 56 | 69 | ||
| Median (Q1, Q3) | +1.6% (–15.3, +29.2) | –0.4% (–15.3, +18.8) | +4.1% (–13.8, +38.0) | |||
| P value | .22 | .99 | .11 | .21 | ||
| Fibrinogen, mg/mL | ||||||
| Week 0 | No. | 126 | 57 | 69 | ||
| Median (Q1, Q3) | 3.04 (2.28, 4.17) | 3.28 (2.52, 4.27) | 2.87 (2.17, 3.82) | |||
| Δ to week 24 | No. | 125 | 56 | 69 | ||
| Median (Q1, Q3) | +4.5% (–13.9, +27.8) | +3.7% (–13.9, +15.9) | +5.6% (–12.4, +30.3) | |||
| P value | .12 | .34 | .28 | .73 | ||
| VCAM, ng/mL | ||||||
| Week 0 | No. | 126 | 57 | 69 | ||
| Median (Q1, Q3) | 893 (677, 1146) | 835 (601, 1146) | 911 (705, 1125) | |||
| Δ to week 24 | No. | 125 | 56 | 69 | ||
| Median (Q1, Q3) | –0.8% (–9.0, +18.3) | +0.0% (–7.2, +14.7) | –2.0% (–11.1, +21.7) | |||
| P value | .23 | .53 | .27 | .81 | ||
P values are from signed-rank test for within-group changes and Wilcoxon rank-sum test for between-group differences.
Abbreviations: hsCRP, high-sensitivity C-reactive protein; IL-6, interleukin 6; IP-10, interferon-γ–inducible protein 10; LDMTX, low-dose methotrexate; sCD14, soluble CD14; sCD163, soluble CD163; VCAM, vascular cell adhesion module.
DISCUSSION
In a randomized study of treated adults with HIV, with established ASCVD or at increased risk for ASCVD, we administered LDMTX or placebo (with folic acid) for 24 weeks and found that LDMTX was reasonably well tolerated but had no effects on our primary or secondary efficacy measurements. The most common serious adverse event was pneumonia, but it occurred in a similar number in each group. There were more than twice as many prespecified safety events in the LDMTX group, but the difference in serious event rates between the LDMTX and placebo groups was within the prespecified 15% margin of noninferiority.
This is an important negative study in HIV and one of the largest clinical trials performed in older HIV-infected adults with or at risk for ASCVD. Previous reports of MTX in HIV are limited to case reports of individuals with psoriasis in the pre-ART era [21, 22] or higher chemotherapeutic doses in the setting of malignancy [23]. LDMTX was used to safely treat an individual with HIV-related CD8+ cutaneous pseudolymphoma [24]. In our study, infectious complications were common even in the placebo group (22 infection-related adverse events/100 years [95% confidence interval, 12–43/100 years]), suggesting that effective ART does not fully restore immunologic and clinical health in this population. The occurrence of infectious complications in the placebo group emphasizes the persistent impairment of host defenses in the aging HIV-infected population despite virologic control, suggesting that strategies other than ART are needed to restore health in older individuals living with HIV.
LDMTX did not improve brachial artery FMD (the primary efficacy endpoint) or peak hyperemic flow velocity, 2 measures of arterial function that predict future ASCVD events in the general population [19, 25–28]. In our study, baseline FMD was lower than in the general population, the interquartile range of baseline FMD was narrower, and reproducibility of FMD measurements was lower than in previous multicenter ACTG studies [14, 29]. LDTMX had no effect on 8 inflammatory biomarkers that are associated with a variety of adverse clinical outcomes [30–37]. Plasma levels of inflammatory biomarkers were highly variable within individuals between visits; IL-6 increased in both study groups.
LDMTX appeared to mediate small declines in CD4+ T cells and more significant and sustained declines in CD8+ T cells that were independent of changes in white blood cell count; these findings suggest that the immunomodulatory effects of LDMTX may be mediated through CD8+ T cells. HIV infection results in abnormal T-cell homeostasis, which is characterized by CD4+ T-cell depletion and persistently elevated CD8+ T cells [38]. Antiretroviral therapy results in CD4+ T-cell recovery; however, CD8 T cells remain persistently elevated [39, 40] and independently predict ASCVD as well as other non-AIDS events [39, 41].
Previous studies of anti-inflammatory interventions in HIV have had similar results. In the general population, statins reduce inflammatory markers but the effects of statins on hsCRP and other markers have been mixed in the setting of HIV [42–45]. Neither pentoxyfylline [46] nor low- or high-dose aspirin treatment consistently reduced inflammatory cytokines or improved endothelial function in people with HIV infection [47]. Hydroxychloroquine did not reduce CD8+ T-cell activation, but led to greater declines in CD4+ T cells and increased viral replication [48]. Although differences in LDMTX dosing and patient characteristics may underlie our null results compared to those observed with LDMTX in non-HIV-infected populations, it is plausible that the pathways of chronic inflammation in HIV infection are distinct from those seen in other inflammatory conditions such as RA and psoriasis. Preexisting T-cell abnormalities in the setting of HIV infection may overpower immunomodulatory effects of MTX. Also, ART, low-level HIV replication, microbial translocation across damaged mucosal surfaces, excess burdens of chronic coinfections such as CMV, and loss of immunoregulatory pathways may contribute to persistent inflammation during otherwise effective ART [12]. These pathways may be distinct from the immune perturbations that occur in autoimmune disease such as RA and, accordingly, different interventions will be needed to modify them.
Our study had limitations. The LDMTX dose we targeted was on the low end of what has been observed to be effective in larger cohort studies. The 24-week treatment duration may have been too short to detect an effect on vascular indices and inflammatory markers; however, the safety of a longer study drug exposure also is not known. The bioavailability of oral methotrexate ranges from 20% to 100% [49, 50] and may be modulated by the gut microbiome [51] which could have impacted our findings. Lower scan–rescan reproducibility for FMD and higher temporal variability in inflammatory markers may have limited our ability to detect differences between arms; however, the observed between-subjects FMD variability was lower than assumed in our sample size determination (observed SD, 2.56% vs 3% assumed). Furthermore, lack of statistical power is a relevant consideration only if clinically relevant treatment group differences are observed that fail to achieve statistically significance. Without exception, the estimated effects sizes for our null primary and secondary efficacy outcome results were small and unlikely to be of clinical relevance. Our substudy of the effects of LDMTX on aortic inflammation and an exploratory analysis of brachial artery echogenicity, as well as the findings from the CIRT [11], may provide more information about LDMTX effects on ASCVD risk and may help to determine if there is a role for further study of LDMTX in persons with HIV infection.
In this study of older adults with or at increased ASCVD risk, more participants treated with LDMTX had safety events than with placebo, but the prespecified noninferiority margin of 15% was not exceeded. LDMTX had no significant effect on endothelial function or soluble inflammatory biomarkers but was associated with significant decreases in CD8+ T cells. The balance of risks and potential benefits of LDMTX on ASCVD risk in the setting of treated and suppressed HIV infection remains unclear and will require additional investigation.
Supplementary Data
Supplementary materials are available at Clinical Infectious Diseases online. Consisting of data provided by the authors to benefit the reader, the posted materials are not copyedited and are the sole responsibility of the authors, so questions or comments should be addressed to the corresponding author.
Notes
Presented in part: Conference on Retroviruses and Opportunistic Infections, Boston, Massachusetts, 4–7 March 2018.
Acknowledgments. The authors greatly appreciate the assistance of the ACTG Statistical and Data Analysis Center and the ACTG Optimization of Antiretroviral Therapy Committee; the clinical trials support from Social and Scientific Systems, Inc; and the efforts of the research participants. Participating AIDS Clinical Trials Group units are listed in the Appendix.
Author contributions. J. H. S.: conception, design, obtained funding, conduct of study, data analysis, draft of manuscript, critical revision of the manuscript. H. J. R. and S. G. D.: design, conduct of study, data analysis, critical revision of the manuscript. T. B., E. D., and D. H.: conduct of study, critical revision of the manuscript. E. Y.: conduct of study, data analysis, critical revision of the manuscript. M. M. L.: design, supervision of immunologic monitoring, critical revision of the manuscript. P. M. R. and A. T.: critical review of the manuscript. C. J. F.: conduct of the study, critical review of the manuscript. J. S. C.: conception, design, conduct of study, data analysis, draft of the manuscript. P. Y. H.: conception, design, obtained funding, conduct of study, data analysis, and critical revision of the manuscript.
Disclaimer. The content is solely the responsibility of the authors and does not necessarily represent the official views of the National Institute of Allergy and Infectious Diseases (NIAID), the National Heart, Lung, and Blood Institute (NHLBI), or the National Institutes of Health (NIH).
Financial support. The project described was supported by the NIAID (award numbers U01AI068636, UM1AI068636, UM1AI0686334) and the NHLBI (award number HL1177131).
Potential conflicts of interest. P. Y. H. has received honoraria from Gilead and Merck. J. S. C. has received grants from Theratechnologies. J. H. S. has received personal fees from Lilly for being on a data and safety monitoring board, a core laboratory grant from Novartis, and royalties from the Wisconsin Alumni Research Foundation. C. F. has received grants from Gilead Sciences, Merck, Janssen, Pfizer, Cytodyn, and ViiV Healthcare, and personal fees from Clinical Care Options. A. T. has received grant support from Actelion and Genentech, and minor consulting fees from Actelion. E. S. D. has received grants from NIH, Gilead, Bristol-Myers Squibb, Janssen, Merck, and ViiV; and advisory and/or consulting fees to Harbor-UCLA Medical Center from Gilead, Bristol-Myers Squibb, Janssen, Merck, Teva, ViiV, and Theratechnologies. D. H. has received grants from NIH and nonfinancial support from Gilead Sciences. All other authors report no potential conflicts. All authors have submitted the ICMJE Form for Disclosure of Potential Conflicts of Interest. Conflicts that the editors consider relevant to the content of the manuscript have been disclosed.
References
APPENDIX
Participating AIDS Clinical Trials Group Units. 101 - Massachusetts General Hospital Clinical Research Site (CRS); 107 - Brigham and Women’s Hospital Therapeutics CRS; 201 - Johns Hopkins University CRS; 601 - University of California, Los Angeles CARE Center CRS; 603 - Harbor University of California Los Angeles Center CRS; 701 - University of California, San Diego AntiViral Research Center CRS; 801 - University of California, San Francisco HIV/AIDS CRS; 1001 - University of Pittsburgh CRS; 1201 - University of Southern California CRS; 2101 - Washington University Therapeutics CRS; 2301 - Ohio State University CRS; 2401 - Cincinnati CRS; 2501 - Case Western Reserve University CRS; 2701 - Northwestern University CRS; 2951 - The Miriam Hospital CRS; 3201 - Chapel Hill CRS; 3203 - Greensboro CRS; 3652 - Vanderbilt Therapeutics CRS; 6101 - University of Colorado Hospital CRS; 6201 - Penn Therapeutics CRS; 31473 - Houston AIDS Research Team CRS; 31786 - New Jersey Medical School Clinical Research Center CRS; 31788 - Alabama CRS.
A5314 Acknowledgments. Eva Whitehead, RN, and Elaine M. Urbina, MD, MS - Cincinnati CRS (Site 2401) Grant UM1-AI069501. Eric Daar and Sadia Shaik - Harbor-UCLA (Site 603) Grant AI 069424, UCLA CTSI Grant UL1 TR000124. Annie Luetkemeyer, MD, and Jay Dwyer, RN - UCSF AIDS CRS (Site 801) CTU Grant UM1AI069502. Kristen Allen, RN, and Jane Baum, RN - Case CRS (Site 2501) Grant AI069501. Nina Lambert and Babafemi Taiwo - Northwestern University CRS (Site 2701) Grant 2UM1 AI069471, UL1TR001422. Michael Messer and Dana Green - Alabama CRS (Site 31788) Grant UM1 AI069452. Joan Gottesman, BSN, RN, and JoAnn A. Gottlieb - Vanderbilt Therapeutics CRS (Site 3652) Grant UM1AI 069439, NIH TR000445. Paul Sax, MD, and Cheryl Keenan, RN, BC - Brigham and Women’s Hospital (Site 107) Grant R01HL117713. Shobha Swaminathan and Baljinder Singh - New Jersey Medical School Clinical Research Center (Site 31786) Grant 5R01 HL117713. Dr Pablo Tebas and Ro Kappes, MPH - Philadelphia HIV Therapeutics and Prevention CTU (Site 6201) Grant UM1AI068636, UM1AI069534. Lisa Kessels and Teresa Spitz - Washington University Therapeutics CRS (Site 2101) Grant UM1AI068619. Sana Majid and Arezou Sadighi Akha - UCLA Care Center (Site 601) Grant AI069424, UCLA CTSI UL-1TR000124, CFAR P30-AI028697. Renee Weinman, MPPM, and Lisa Klevens, RN, BSN - University of Pittsburgh (Site 1001) Grant UM1 AI069494. Cornelius Van Dam, MD, and Timothy Lane, MD - Greensboro CRS (Site 3203) Grant 5UM1AI068636. Cathi Basler and Christine Griesmer - UCH CRS (Site 6101) Grant 2UM1AI069432, UL1 TR001082. Andrea Weiss and Ilene Wiggins - Johns Hopkins University CRS (Site 201) Grant TBD. Dr Susan Koletar and Kathy Watson, RN - Ohio State University (Site 2301) Grant UM1AI069494. Christopher Evans, MSN, and David Currin, AAS - Chapel Hill CRS (Site 3201) Grant UM1 AI069423, CTSA: 1UL1TR001111, CFAR: P30 AI50410. Michael Phillip Dube, MD, and Frances Canchola, RN - University of Southern California CRS (Site 1201) Grant 2UM1AI069432. Dee Dee Pacheco and Michael Connor - UCSD CRS (Site 701) Grant AI069432. Karen Tashima, MD, and Pamela Poethke, RN - The Miriam Hospital (Site 2951) Grant 2UM1A1069412-08. Dr Roberto C. Arduino and Dr Aristoteles E. Villamil - HART (Site 31473) Grant 5 UM1 AI069503, 5 UM1 AI068636.

