


Abstract
Demographic data show an increasingly aging human immunodeficiency virus (HIV) population worldwide. Recent concerns over dolutegravir-related neuropsychiatric toxicity have emerged, particularly amongst older people living with HIV (PLWH). We describe the pharmacokinetics (PK) of dolutegravir (DTG) 50 mg once daily in PLWH aged 60 and older. Additionally, to address calls for prospective neuropsychiatric toxicodynamic data, we evaluated changes in sleep quality and cognitive functioning in this population after switching to abacavir (ABC)/lamivudine (3TC)/DTG over 6 months.
PLWH ≥60 years with HIV–viral load <50 copies/mL on any non–DTG-based antiretroviral combination were switched to ABC/3TC/DTG. On day 28, 24-hour PK sampling was undertaken. Steady-state PK parameters were compared to a published historical control population aged ≤50 years. We administered 6 validated sleep questionnaires and neurocognitive (Cogstate) testing pre-switch and over 180 days.
In total, 43 participants enrolled, and 40 completed the PK phase. Overall, 5 discontinued (2 due to sleep-related adverse events, 4.6%). DTG maximum concentration (Cmax) was significantly higher in patients ≥60 years old versus controls (geometric mean 4246 ng/mL versus 3402 ng/mL, P = .005). In those who completed day 180 (n = 38), sleep impairment (Pittsburgh Sleep Quality Index) was marginally higher at day 28 (P = .02), but not at days 90 or 180. Insomnia, daytime functioning, and fatigue test scores did not change statistically over time.
DTG Cmax was significantly higher in older PLWH. Our data provides clinicians with key information on the safety of prescribing DTG in older PLWH.
By 2015, 1 in 3 people accessing human immunodeficiency virus (HIV) care in the United Kingdom [1] and almost half in the United States were aged 50 and over [2]. With advancing age, several physiological changes affect drug pharmacokinetics (PK) and pharmacodynamics (PD) [3].
The integrase inhibitor dolutegravir (DTG) is now the drug of choice for many HIV providers, thanks to high efficacy, as firmly demonstrated in trials, and retained activity against some integrase inhibitor–resistant HIV-1 phenotypes [4]. Its low potential for drug interactions is also an advantage in managing older people living with HIV (PLWH) [5]. DTG is a recommended key drug in major HIV guidelines and is a strong candidate to become first option in the World Health Organization antiretroviral guidelines [6, 7].
In pre-marketing trials, DTG demonstrated favorable safety and tolerability profiles, with a <2% discontinuation rate secondary to any adverse events (AEs); this rate is comparable to raltegravir and superior to efavirenz [8, 9]. However, contrasting real-life data reveal unexpectedly higher discontinuation rates (7–15%, median time 72 days) [10–14], most commonly due to insomnia/sleep disturbances and other neuropsychiatric (NP) AEs (up to 8%), regardless of prior neuropsychiatric history, thereby implicating a potentially neurotoxic effect of DTG [14–18]. Comparison studies suggest that NP-AEs are commoner with DTG than other integrase inhibitors [11, 12, 16]. Interestingly, in several reports, DTG discontinuation was significantly higher in PLWH >60 years old [13, 16, 19], a group under-represented in licensing trials. This prompted a call in the literature for prospective studies evaluating DTG-associated AEs, including PK, sleep architecture analysis, and neuropsychological testing, particularly in special populations [20].
A high prevalence of sleep disturbances is already described in the HIV population, even in the antiretroviral therapy (ARV) era (30–73% versus 10–20% in the general population [21, 22]), and it is strongly associated with poorer disease outcomes, cognitive impairment, and HIV-associated dementia [21, 23].
It is, therefore, important to characterize the role of aging on DTG PK/PD, especially with regards to central nervous system toxicity and sleep disturbances. The primary objectives of this study were to describe the steady-state PK of DTG 50 mg once daily in PLWH ≥60 years old and compare them to a published, younger population (from the SINGLE trial [9]). The secondary objectives were to evaluate, in detail, changes in sleep and cognition over 6 months following a switch from non–DTG-based combination antiretroviral therapy to abacavir (ABC), lamivudine (3TC), and DTG, as a fixed-dose combination tablet.
We hypothesized that age-related changes in drug PK might impact DTG aside from its metabolism, since it is mainly by UDP-glucuronosyltransferase-1A1 (UGT1A1) and no evidence supports age-related glucuronidation changes [24]. We also expected a reverse association between sleep/cognition changes and PK parameters, particularly at the high end of the therapeutic range (or higher).
METHODS
Participants
Written informed consent was obtained from male and female PLWH, stable on combination antiretroviral therapy, aged ≥60 years old with a body mass index of 18–35 kg/m2. The protocol required that approximately 70% of subjects be ≥65 years old (to ensure a variable age range). Eligibility criteria included plasma HIV–viral load <50 copies/mL at screening and no history of treatment failure or documented significant drug resistance on viral genotyping. With ABC use, a negative HLA-B*5701 allele result was required, and participants were screened for cardiovascular risk using the QRISK2 calculator [6, 25] (eligible if 10-year risk of cardiovascular event was <20% or if risk factors were well controlled with medication/lifestyle measures). Participants were excluded if they had: significant acute/chronic illnesses; abnormal physical examination, electrocardiogram, or laboratory determinations; or use of known interacting drugs/remedies. No patients had preceding primary sleep disorder diagnoses. The study was approved by the London Central Research Ethics Committee and the Medicines and Healthcare Products Regulatory Agency, and ran in accordance with Good Clinical Practice and the Declaration of Helsinki (NCT02509195).
Study Design
This was a 4-center, 180-day (excluding screening and follow-up), open-label, prospective PK/PD study. After screening, eligible subjects were switched to ABC/3TC/DTG 600/300/50 mg fixed-dose combination (Triumeq) on day 1, receiving 1 pill once daily, orally, in the morning with or without breakfast for the study period, except on day 28. On day 28, subjects underwent intensive DTG PK determinations, having fasted for 6 hours pre-dose and 4 hours post-dose to match the SINGLE PK sub-study circumstances [9]. Blood samples were collected pre-dose and 1, 2, 3, 4, 8, 12, and 24 hours post-dose. Study medication safety was evaluated using the Division of AIDS table for grading the severity of adult and pediatric AEs. Medication compliance was assessed through direct questioning and pill count.
Collection and Quantification of Plasma Dolutegravir
Whole blood samples were collected at each time-point on day 28 from an indwelling venous catheter into 6 mL spray-coated ethylenediaminetetraacetic acid tubes. Following centrifugation, plasma was aliquoted into 3 equal 2.0 mL tubes (Sarstedt, Germany) and stored at -80oC. Samples were then shipped on dry ice to the Jefferiss Trust Laboratory (Imperial College London). DTG plasma concentrations were determined using ultra-performance liquid chromatography coupled with ultraviolet detection [26].
The assay calibration range was 0.25–10 mcg/ml, intra-assay variability was 3.3–6.1%, and inter-assay variability was 4.5–5.7%. Overall accuracy was between 90.7% and 97.7% for 3 different quality-control sample concentrations. The laboratory adheres to the ARV International Inter-laboratory Quality Control Program [27].
Pharmacokinetic and Statistical Analysis
A sample size of 40 subjects was calculated to provide at least 80% power to detect DTG PK parameter changes in older people against 16 controls. The calculated parameters were plasma concentration 24 hours after the observed dose (C24), maximum observed plasma concentration (Cmax), area under the plasma concentration curve from 0 to 24 hours (AUC0–24), and half-life (t1/2). All PK parameters were calculated using actual blood sampling time and non-compartmental modeling techniques (WinNonlin-Phoenix, version 7.0). Descriptive statistics, including geometric mean, 95% confidence interval, and percentage coefficient of variation (cardiovascular % = 100*standard deviation/mean) were calculated for DTG PK parameters at all time-points on day 28, and compared to those obtained from the SINGLE PK sub-study control HIV population (≤50 years old, n = 16 [9]) using non-parametric Mann-Whitney U tests.
Sleep and Cognitive Data Collection
We administered 6 published and validated self-reported paper questionnaires (Table 1) [28–33], recording different aspects of sleep, to participants at baseline and on days 28, 90, and 180, in order to provide a comprehensive description of sleep quantity; quality and impact on daytime function; wakefulness; mental status; and general wellbeing before and after medication switch. Answers to each question were coded as per questionnaire protocols (see Supplementary Data) and entered into Excel for scoring.
Summary of Content, Process, and Scoring of Sleep Questionnaires and Cognitive Testing
| Questionnaire | Process | Main Domains | Recall Period | Number of Questions | Time to Complete (min) | Scores |
|---|---|---|---|---|---|---|
| PSQI | Self-reported 0–3 Likert scale | Sleep quality, sleep disturbance, and sleep habits | 1 month | 19 | 5–10 | Score of 5 or more indicates poor sleep quality. Global score calculated by summing subscale scores (not calculated for individuals with missing results). |
| ESS | Self-reported 0–3 Likert scale | Level of sleepiness/ propensity of falling asleep | N/A | 8 | < 5 | ≥11 indicates excessive daytime sleepiness |
| FOSQ | Self-reported 0–4 Likert scale | Functional impairment in activities of daily living resulting from sleepiness | N/A | 30 | 15 | 5 domains: for each domain, lower scores indicate more acute issues. Each domain score calculated by averaging answered domain questions. Global score calculated by averaging the subscale scores & multiplying by 5 (allows for missing subscale scores). |
| ISI | Self-reported 0–4 Likert scale | Nature, severity, and impact of insomnia | 2 weeks | 7 | <5 | 0–7 no insomnia; 8- 14 subthreshold insomnia; 15–21 moderate insomnia; 22–28 severe insomnia |
| FSS | Self-reported 1–7 Likert scale | Effect of fatigue on motivation, exercise, physical, social, and family functioning | 1 week | 9 | <5 | >5 indicates abnormal fatigue |
| SDQ | Self-reported 1–5 Likert scale | Sleep quality; sleep disturbance; daytime function; medication; medical family history | 6 months | 175 | 30 | 4 sleep disorders categories: sleep apnoea syndrome, narcolepsy, periodic limb movements disorders, and psychiatric sleep disorders. |
| Cogstate neurocognitive test | Computerized battery | Detection; identification; set shifting; Groton Maze learning; Groton Maze secall; 1 card learning; 1 back memory; 2 back memory | N/A | 8 tasks | Score provided for each of 8 domains using optimal outcome measure (as defined by Cogstate guidelines). Composite score for change from baseline calculated by averaging standardized change scores. |
Abbreviations: ESS, Epworth Sleepiness Scale; FOSQ, Functional Outcomes of Sleep Questionnaire; FSS, Fatigue Severity Scale; ISI, Insomnia Severity Index; PSQI, Pittsburgh Sleep Quality Index; SDQ, Sleep Disorder Questionnaire.
Neurocognitive testing was carried out on days 1 and 180 using the validated, widely-used Cogstate computerized assessment software [34], which evaluates a range of cognitive functions through 8 domains: detection and identification (speed of performance); card learning, 1 back memory, and 2 back memory (accuracy of performance); and Groton Maze learning, Groton Maze recall, and set-shifting (number of errors made on testing). Participants completed a mock practice at screening to minimize the learning effect.
Sleep and Cognitive Data Analysis
Sleep baseline characteristics and outcome measures at each time-point were descriptively summarized using medians, interquartile ranges (IQR), and proportions. Composite scores for sleep questionnaires were calculated and interpreted as per questionnaire protocols and cut-offs (Table 1). Neurocognitive scores were analyzed using Cogstate recommendations [35]. Changes in cognitive scores were calculated for each subject for each domain (baseline on day 180), and were standardized according to the within-subject standard deviation. The score sign was reversed, where appropriate, so that positive values represent improvement for all domains. A composite score for the change from baseline was calculated by averaging the standardized change scores across all Cogstate tasks for each individual.
As data was not normally distributed, non-parametric tests were used for analysis. Changes in sleep and cognitive scores from baseline to each time-point were tested for significance using the Wilcoxon sign-rank test. Spearman’s correlation examined correlations between outcomes and DTG PK parameters.
As efavirenz use is associated with NP-AEs, especially sleep disturbances [6], a sub-analysis was conducted using the Mann-Whitney test to compare individuals who switched from an efavirenz-based regimen to those who didn’t, thereby preventing efavirenz removal from potentially masking DTG effects.
Internal consistency was evaluated for outcomes with multiple domains, using Cronbach’s α and corrected component-total Spearman’s rho (rs) correlations (α ≥ 0.70 and rs ≥ 0.30 indicated adequate internal consistency). Correlation between different sleep questionnaires was evaluated at baseline to determine the level of agreement.
Statistical analyses were performed using Stata (version 14.1) and GraphPad Prism (version 7.03). In the analyses, P values, uncorrected and corrected for multiple comparisons, were calculated; P < .05 was deemed significant.
RESULTS
Study Population
In total, 53 subjects were screened; 43 enrolled and received at least 1 study drug dose. Of those enrolled, 3 participants withdrew before day 28 and could not be included in the PK analysis (2 moved abroad and 1 experienced fatigue and photosensitivity attributed to the study drugs). This resulted in 40 participants completing the PK phase, all of whom were included in day 28 PK and PD analyses. Thirty eight subjects attended the final study visit (day 180); 1 participant withdrew secondary to insomnia/vivid dreams (resolved by switching to tenofovir/emtricitabine/raltegravir) and 1 withdrew for job relocation. Subject and control characteristics are summarized in Table 2.
Demographic and Clinical Characteristics of Study Participants and Controls
| Variable | Study Subject in PK Analysis (n = 40) | Controls (n = 16) | |
|---|---|---|---|
| Age | Median (range) in years | 66 (60–79) | 36 (22–50) |
| Ethnicity (n) | White British/Irish/Other | 33 | 11 |
| African Heritage | 3 | 3 | |
| Hispanic | 2 | 0 | |
| Asiatic | 2 | 0 | |
| American Indian/Alaskan Native | 0 | 1 | |
| Gender (n) | Male | 39 | 15 |
| Female | 1 | 1 | |
| Pre-switch regimen: | |||
| Backbone (n) | Abacavir/Lamivudine | 16 | N/A |
| Tenofovir disoproxil fumarate/ Emtricitabine | 20 | N/A | |
| 3rd Agent (n) | Boosted PI (as monotherapy/as dual therapy with raltegravir) | 9 (2/1) | N/A |
| NNRTI (of which Efavirenz) | 24 (17) | N/A | |
| Raltegravir (of which dual therapy with PI) | 6 | N/A | |
| Zidovudine | 1 | N/A | |
| Salvage Therapy (n) | Emtricitabine, Maraviroc, Darunavir, Ritonavir | 1 | N/A |
Abbreviations: N/A, not applicable; NNRTI, non-nucleotide reverse transcriptase inhibitor; PI, protease inhibitor; PK, pharmacokinetics.
Dolutegravir Plasma Pharmacokinetics
Steady-state PK parameters are summarized in Table 3. Figure 1 demonstrates geometric mean DTG concentration-time curves for the observed and control populations.
Dolutegravir Steady-state Pharmacokinetics Parameters for the Observed and Control Groups, Measured Over 24 Hours
| Observed Group (n = 40) | Control Group (n = 16) | P Value (Mann-Whitney U) | ||||||||||
|---|---|---|---|---|---|---|---|---|---|---|---|---|
| Cmax (ng/ml) | Cmin (ng/ml) | AUC0-24 (ng.h/ml) | t1/2 (hrs) | Cmax (ng/ml) | Cmin (ng/ml) | AUC0-24 (ng.h/ml) | t1/2 (hrs) | Cmax (ng/ml) | Cmin (ng/ml) | AUC0-24 (ng.h/ml) | t1/2 (hrs) | |
| Geomean | 4246 | 1052 | 51799 | 12.84 | 3402 | 942 | 48068 | 14.35 | 0.00496 | 0.7718 | 0.5619 | .7065 |
| Low 95% | 4018 | 999 | 49405 | 12.05 | 3008 | 799 | 42350 | 11.16 | - | - | - | - |
| Up 95% | 4767 | 1351 | 59020 | 14.93 | 4030 | 1461 | 59898 | 21.44 | - | - | - | - |
| Cardiovascular % | 27 | 48 | 29 | 34 | 29 | 58 | 34 | 62 | - | - | - | - |
Significant results are in bold. The pharmacokinetics parameters for the participant who withdrew secondary to NP-AEs after day 28 were: Cmax, 5300 ng/mL; C24, 2013 ng/mL; AUC, 77942 hr*ng/mL; t1/2, 19.8 hrs. All were >95th percentile for the study group.
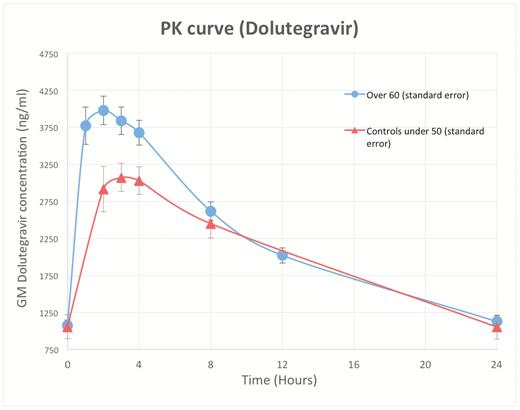
Dolutegravir geometric mean concentration-time curve in study population and controls over 24 hours. Abbreviation: PK, pharmacokinetics.
There were no differences in DTG AUC0-24, C24, or t1/2 between the 2 populations. However, Cmax (approximately 2 hours post-dose in both groups) was significantly higher in subjects ≥60 years old (geometric mean 4246 versus 3402 ng/mL, P = .005).
Sleep Questionnaire Results at Baseline and Follow Up
Detailed response rates and median (IQR) scores per questionnaire, domain, and time-point are in Supplementary Table A and Supplementary Figure B.
Overall Sleep Impairment: Pittsburgh Sleep Quality Index
The median global Pittsburgh Sleep Quality Index (PSQI [28]) score was higher at day 28 versus baseline (5.0 versus 6.0, P = .02, adjusted for multiple testing), but at no other time-point. No domain achieved statistical significance individually.
Internal consistency was acceptable for the global score (α = .72). Corrected component-total correlations ranged from 0.19 (daytime dysfunction) to 0.66 (quality).
Insomnia: Insomnia Severity Index
Median (IQR) global Insomnia Severity Index (ISI [29]) scores remained stable (range 5–6.5), although 4 individuals developed moderate insomnia over time (ISI 14–21; not significant) and 1 subject’s severe insomnia (ISI > 21) improved whilst 1 subject developed insomnia by day 28, leading to discontinuation (described above).
Daytime Sleepiness: Epworth Sleepiness Scale
At baseline, 29% individuals were considered “sleepy” (Epworth Sleepiness Scale > 10). compared with 24% at day 180 (not significant) [30].
Daytime Function: Functional Outcomes of Sleep Questionnaire
Median (IQR) global Functional Outcomes of Sleep Questionnaire scores remained stable from baseline to day 180 (range 18.01–18.81/20), with a generally good level of daytime function across the cohort [31].
Fatigue Severity: Fatigue Severity Scale
At baseline, 4/39 (10%) individuals reported having fatigue; this was 20% on day 180 (not significant) [32].
Risks for Possessing a Sleep Disorder: Sleep Disorder Questionnaire
No participants met the diagnostic criteria at baseline for any of the 4 sleep disorders tested, and no significant change in scores was observed over time [33].
Correlation Between Sleep Measures
There was a significant correlation between all sleep measures evaluated by more than 1 questionnaire across all scores at baseline (0.37 < r < 0.83; P < .05).
Sleep Scores by Efavirenz Status
There were 17 (43%) participants who switched from an efavirenz-based combination. At baseline, some measurements appeared worse in individuals who did not switch from efavirenz. No significant difference was observed between groups in overall score changes at each time-point compared to baseline for all questionnaires except the ISI, which improved over 180 days in participants without efavirenz in their previous regimen and worsened in those with (P = .02); however, this did not remain after adjustment for multiple comparisons (P > .05; Supplementary Table C).
Relationship Between Sleep Scores and PK Parameters
There was no correlation between DTG PK parameters and day 180 sleep scores or intra-subject changes in global scores over the 180 days (delta test scores; Figure 2; Supplementary Tables D and E). To rule out an effect dependent on a drug level threshold, the Mann-Whitney test was used to compare delta test scores in subjects with Cmax above the upper quartile (Q4) to those below (Q1-3), with no differences seen (.62 < P-value <1.0); there were also no differences with 95th percentile Cmax used as the threshold (.13 < P-value < .73). Similarly, there was no difference in Cmax between the day 180 test score or delta test score low and high quartile groups, for all sleep questionnaires (.31 ≤ P-value ≤ .66 and .63 < P-value < 1.0).
Changes in Cognitive Scores (Table 4)
Between baseline and day 180, no change in global cognitive composite scores or individual domain scores was observed over time, except in Groton Maze learning (executive function), where a significant improvement from baseline to day 180 was seen (median change [IQR] 0.32 [0–0.74], unadjusted P = .002).
Change in Neurocognitive Scores (Effect Size)
| Cogstate Domain | Cognitive Function | Standardized Change Score (Day 180-Baseline) | ||
|---|---|---|---|---|
| n | Median (IQR) | P Value | ||
| Detection task | Psychomotor function | 37 | 0.02 (-0.16,0.13) | .743 |
| Identification task | Attention | 37 | -0.04 (-0.47,0.58) | .602 |
| Set shifting | Executive function | 37 | 0.05 (-0.32,0.75) | .471 |
| Groton Maze learning | Executive function | 34 | 0.32 (0.00,0.74) | .002** |
| Groton Maze recall | Delayed recall | 35 | 0.27 (-0.82,1.37) | .176 |
| 1 card learning | Learning | 36 | 0.06 (-0.69,1.00) | .592 |
| 1 back memory | Working memory, simple | 37 | 0.24 (-0.90,0.77) | .908 |
| 2 back memory | Working memory, complex | 37 | 0.00 (-0.97,0.84) | .982 |
| Composite score | 37 | 0.16 (-0.23,0.37) | .187 | |
| Cmax<95thpercentile (n = 25) | Cmax>95thpercentile (n = 12) | P value | ||
| Median Cogstate Delta score (IQR) | 0.08 (0.30–0.20) | 0.41 (0.12–0.64) | .0195* | |
For difference scores, score sign reversed for all outcome measures where increasing values indicate performance decline. Thus, for all measures, negative values indicate performance decline and positive values indicate performance improvement. Difference scores standardized according to within-subject standard deviation. Composite score for each subject calculated by averaging standardized change scores across all domains. P-values are exact, derived from Wilcoxon matched-pairs sign-rank test (not adjusted for multiple comparisons).
Bold = composite score values.
Abbreviation: IQR, interquartile ranges.
*P < 0.05; **P < 0.01.
There was no correlation between C24 and AUC0-24 and day 180 cognitive function or delta cognitive scores (individual domains and global composite scores; P = .07). Unexpectedly, higher Cmax was associated with improvements in global cognitive function (r = 0.39, P = .02; Figure 2). The improvement in median (IQR) delta scores was higher in those with a Cmax greater than the upper 95% confidence interval than in those below (P = .0195).
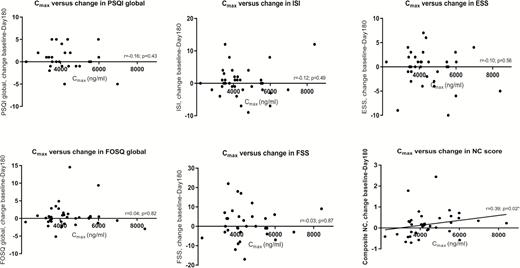
Scatter plots showing changes in sleep and neurocognitive scores over 180 days against Cmax. Abbreviations: ESS, Epworth Sleepiness Scale; FOSQ, Functional Outcomes of Sleep Questionnaire; FSS, Fatigue Severity Scale; ISI, Insomnia Severity Index; NC, neurocognitive; PSQI, Pittsburgh Sleep Quality Index.
Clinical Safety and Efficacy
Secondary to AEs, 2 of the 43 (4.6%) participants discontinued the study (described above). In the remaining subjects, there were no virological failures or grade 3 or 4 toxicity following treatment initiation. The studied fixed-dose combination was well tolerated.
DISCUSSION
We characterized the steady-state PK of DTG 50 mg administered once daily in an aging HIV population, mostly over 65 years old, the age associated with potential changes in drug PK [24]. Compared to the younger control group, Cmax was significantly higher (25%) in those ≥60 years old, indicating increased DTG absorption. Whilst the net effect of age-related physiological intestinal changes (eg, reduction in pH, gastrointestinal motility, etc.) on the absorption of most drugs is thought to be minimal [3], our findings could be explained by age-related alterations in expression of active DTG efflux transporters, such as P-glycoprotein and breast cancer resistance protein, across epithelial cells in the gastrointestinal tract [3, 24, 36]; however, further research is required. There were no differences in DTG C24, AUC0-24, or t1/2 between the 2 groups, supporting a lack of age-associated effect on the main DTG metabolic pathway (UGT1A1).
To address the call for prospective PD data [20, 37], we also described the first post-marketing analysis of sleep and cognition-related PD changes over 180 days following a switch to ABC/3TC/DTG. DTG-related NP-AEs (including insomnia) are an emerging concern [14–18], and older age has been described as an independent risk factor [13, 16, 19]. In our study, 2 participants discontinued DTG because of NP-AEs (4.6%), which is consistent with published cohorts (1.7–8%). However, when investigating sleep quality and Cogstate status in those who continued the drug, we only observed a small increase in PSQI scores (at day 28, which resolved by day 90) and a non-significant trend towards an increase in Fatigue Severity Scale scores. Other scores remained stable or improved following the introduction of DTG. Whilst the 1 subject who withdrew secondary to NP-AEs had elevated levels of DTG, we did not find any association between DTG PK parameters and changes in sleep scores in the remaining subjects over time, which is in keeping with observations from Riva [38] and Hoffman [39]. There were also no changes in sleep scores in subjects with very high drug concentrations, in whom, surprisingly, cognition improved significantly. These interesting findings suggest that the mechanisms of DTG-related neurotoxicity are likely to be more complex than a simple linear or threshold-defined PK relationship and may relate to a combination of factors, including pharmacogenetic, immune, and/or functional predispositions.
Of interest, Yagura et al found that DTG C24h (≥1.06 μg/mL) correlated with central nervous system side effects in younger Japanese PLWH [40]. No significant difference in DTG concentration was, however, observed with individual symptoms or insomnia. The researchers subsequently reported a weak association with UGT1A1*6 and UGT1A1*28 alleles [40].
Capetti et al found DTG-related sleep disorders resolved in some patients switching to morning dosing (0.9% versus 3.5%) [19]. In our study, subjects were dosed in the morning to allow for steady-state PK measurements; this could partially explain the absence of new sleep disturbances, although others researchers report unchanged rates with morning dosing [20, 40]. Our subject population was a group of only mildly sleep-disturbed individuals from baseline, which may also partially explain the lack of positive findings in those who completed the study. Overall, whilst sleep impairment rates (PSQI >5) at baseline matched those historically reported in the HIV literature (44–51%), scores were only just in the lower range of abnormal (≤7). Additionally, the prevalence of subjects with moderate insomnia (as measured by ISI) in our cohort (7–21%) is below that previously reported in PLWH [21].
Controlling for a switch from efavirenz did not change the lack of positive results, likely due to the fact that efavirenz subjects in our study were those who did not experience sleep disturbances on it.
There are limitations to our study. Our subjects were predominantly male, thereby not fully representative of real-life cohorts. DTG NP-AEs are thought to be higher in women, but this is an independent risk factor. Importantly, our study was not powered to detect changes in sleep quality, but for the ability to detect PK differences between younger and older PLWH; PD results should therefore be interpreted with caution (although our numbers mirrored previous HIV sleep studies [21] and showed consistency across multiple validated sleep tools measuring the same effects, suggesting that results are accurate). Furthermore, the use of self-reported questionnaires may compromise intra- and inter-subject consistency and lead to recall bias. The effect of suggestion may also introduce bias, as was proposed by the authors of the SINGLE trial (efavirenz versus DTG [9]) to explain higher rates of DTG-related sleep disturbances. Although validated in the general population, our sleep questionnaires are not validated in aging PLWH. However, a good correlation between direction changes reflects good inter-questionnaire reliability. Finally, the use of historical controls is a limitation that should be addressed in future studies via a larger and active control arm.
The strengths of our study lie in its prospective and controlled design, investigating a special population that is growing in size and is in need of data to tailor HIV treatment appropriately. Additionally, we are the first group to characterize detailed sleep and cognitive data in PLWH following Triumeq introduction and to explore the DTG PK/PD relationship in aging PLWH. The use of multiple questionnaires allowed a more comprehensive evaluation of sleep and its effects than previously reported.
In conclusion, we showed a significantly higher DTG Cmax in PLWH ≥60 years old versus younger control subjects. The discontinuation rate was similar to previous real-life reports, but the Cmax increase was not associated with sleep or cognitive decline over 6 months. This data informs physicians and patients on the safety and tolerability of DTG in older patients, particularly following the early period, where careful monitoring remains recommended [11].
Supplementary Data
Supplementary materials are available at Clinical Infectious Diseases online. Consisting of data provided by the authors to benefit the reader, the posted materials are not copyedited and are the sole responsibility of the authors, so questions or comments should be addressed to the corresponding author.
Notes
Author contributions. E. R. E. and B. S. wrote the manuscript; M. B. and S. S. designed the research; E. R. E., M. B., X. W., J. H. V., C. F. and R. B. performed the research; B. S., X. W., and E. R. E. analyzed the data; X. W. and M. M. provided analytical tools; and all authors reviewed and contributed to the final manuscript.
Acknowledgments. We acknowledge LB Krupp, State University of New York, NY; MW Johns, Epworth Hospital, Melbourne, Australia; DJ Buysse, University of Pittsburgh School of Medicine, PA; CH Bastien, Université Laval, Ste-Foy, Quebec, Canada; and TE Weaver, School of Nursing, Philadelphia, PA, for permission to use the sleep questionnaires. The authors acknowledge the contribution of and thank Mrs Ana de Castro-Brito, who helped compile and distribute the multiple sleep questionnaires. We acknowledge Dr Nicole Pagani and Susanna Wong for their substantial contributions. The authors would like to thank the research team at St Stephen’s Clinical Research and the volunteers who took part in the study for their hard work. The study also acknowledges the contribution of the National Institute for Health Research Biomedical Research Centre at Imperial College London.
Disclaimer. This data was presented in part at the annual Conference on Retroviruses and Opportunistic Infections, 3–6 February 2017, Seattle, WA, and at the 18th International Workshop on Clinical Pharmacology of Antiviral Therapy, 14–16 June 2017, Chicago, IL.
Financial support. This work was supported by funding from ViiV Healthcare (grant number SSAT064). Support was also provided by the St. Stephen’s AIDS Trust.
Potential conflicts of interest. E. R. E. received a travel grant from Gilead Sciences Ltd. outside of the submitted work from Gilead Sciences Ltd. outside the submitted work. S. S. reports personal fees from Ambu, outside the submitted work. B. S. reports personal fees from St. Stephen’s AIDS Trust, both during the conduct of the study and outside the submitted work. J. H. V. has received honoraria and research grants and been a consultant or investigator in trials sponsored by Merck, Janssen Cilag, Piramal, and Gilead sciences; has received sponsorship to attend scientific conferences from Janssen Cilag, Gilead Sciences, and AbbVie; and is a trustee for the Martin Fisher Foundation. R. M. has received lecture fees from Gilead, Merck, and Janssen for giving non-promotional talks on clinical aspects of HIV infection, and a grant from Gilead for attending a conference. G. M. reports grants from ViiV Healthcare Ltd, during the conduct of the study, and personal fees from Gilead Sciences Ltd, Merck, Thera Technologies, and Trio Health, outside the submitted work. M. B. has received travel and research grants from and has been advisor/speaker for Janssen, Roche, ViiV, Bristol-Myers Squibb, Merck Sharp & Dohme, Gilead, Mylan, Cipla, and Teva. All other authors report no potential conflicts. All authors have submitted the ICMJE Form for Disclosure of Potential Conflicts of Interest. Conflicts that the editors consider relevant to the content of the manuscript have been disclosed.

