


Abstract
Children are often neglected during early development of antituberculosis agents, and most receive treatment after it is first tested in adults. However, very young children have tuberculosis that differs in many respects from adult cavitary pneumonia and could have different toxicity profiles to drugs. Linezolid is effective against intracellular tuberculosis, a common manifestation in young children. However, linezolid has considerable toxicity due to inhibition of mitochondrial enzymes. Tedizolid could be a replacement if it shows equal efficacy and reduced toxicity.
We performed tedizolid dose-effect studies in the hollow fiber system model of intracellular tuberculosis. We measured linezolid concentrations, colony-forming units (CFU), time-to-positivity, and monocyte viability and performed RNA sequencing on infected cells collected from repetitive sampling of each system. We also compared efficacy of tedizolid vs linezolid and vs tedizolid-moxifloxacin combination.
There was no downregulation of mitochondrial enzyme genes, with a tedizolid 0–24 hour area under the concentration-time curve (AUC0-24) of up to 90 mg*h/L. Instead, high exposures led to increased mitochondrial gene expression and monocyte survival. The AUC0-24 to minimum inhibitory concentration ratio associated with 80% of maximal bacterial kill (EC80) was 184 by CFU/mL (r2 = 0.96) and 189 by time-to-positivity (r2 = 0.99). Tedizolid EC80 killed 4.0 log10 CFU/mL higher than linezolid EC80. The tedizolid-moxifloxacin combination had a bacterial burden elimination rate constant of 0.27 ± 0.05 per day.
Tedizolid demonstrated better efficacy than linezolid, without the mitochondrial toxicity gene or cytotoxicity signatures encountered with linezolid. Tedizolid-moxifloxacin combination had a high bacterial elimination rate.
Tuberculosis in children is complex and is associated with multiple clinical presentations. In infants, toddlers, and preschoolers, disseminated disease is common, with frequent involvement of the meninges, peritoneum, and bone [1, 2]. In older children with intrathoracic disease, Mycobacterium tuberculosis (Mtb) is also predominantly intracellular, as opposed to extracellular in adult-type pulmonary cavity disease. We have found that therapy should be improved in children, even in drug-susceptible disease, especially those aged ≤3 years [3, 4]. Moreover, multidrug-resistant (MDR) tuberculosis regimens for children were copied wholesale from those in adults. They include injectable aminoglycosides, which unfortunately are associated with devastating side effects such as hearing loss during the very early childhood developmental stages of language and social skill acquisition [5, 6]. In addition, the regimens include drugs, such as cycloserine, that cause neuropsychiatric adverse events and do not kill intracellular Mtb [7]. Thus, new treatment regimens for children that improve outcomes in both MDR tuberculosis and drug-susceptible disease are urgently needed. Indeed, this is an important goal set by the international community [8, 9].
We have instituted a program in which we deliberately design regimens for children without first testing in adults; these are yet to be tested in the clinic [10–12]. We used this approach to design a regimen with a backbone of linezolid and moxifloxacin [13–15]. Linezolid has several favorable properties for use in children with tuberculosis, including good intracellular penetration and high penetration into meninges, bone, and peritoneum [16–18]. However, linezolid use has a high rate of adverse events due to inhibition of electron transport chain (ETC) enzymes [19–22]. RNA sequencing (RNA-seq) in the hollow fiber system model of intracellular tuberculosis (HFS-TB) has demonstrated linezolid 0–24 hour area under the concentration-time curve (AUC0-24)–dependent inhibition of ETC complex I, III, IV, and V enzyme genes, with the concentration mediating 50% of maximal inhibition (IC50) of 94 mg × h/L [13]. In addition, there was a surprising and dramatic upregulation of genes encoding ribosomal proteins and rRNAs at high AUCs, which we could not explain. Tedizolid is a newer oxazolidinone that kills Staphylococcus aureus at a rate twice as fast as linezolid and has half as many adverse events as linezolid [23]. In the hollow fiber system model of intracellular Mycobacterium avium-intracellulare complex, we found that tedizolid maximal microbial kill (Emax) was much higher than that of linezolid [24]. Therefore, we investigated if tedizolid was active against intracellular Mtb in the HFS-TB for disseminated pediatric tuberculosis [4, 13]. If tedizolid could achieve the same Emax or efficacy as linezolid, but at exposures lower than those associated with mitochondrial inhibition, then it could be an effective replacement for linezolid [15].
METHODS
Bacterial Strain, Cell Lines, and Growth Conditions
Mtb strain H37Ra (American Type Culture Collection [ATCC] 25177) was used in the hollow fiber experiments. However, we also examined the MICs of the following more virulent strains: H37Rv (ATCC 27294), CDC 1551, HN878, and auxotroph 18b (donated by Professor Stewart Cole). Prior to each experiment, stock cultures were thawed and grown in Middlebrook 7H9 broth supplemented with 10% oleic acid-dextrose-catalase (OADC) at 37°C under 5% CO2 and shaking conditions for 4 days. Human-derived THP-1 cells (ATCC TIB-202) were cultured in 1640 Roswell Park Memorial Institute 1640 medium supplemented with 10% fetal bovine serum (RPMI/FBS) at 37°C under 5% CO2.
Chemicals and Supplies
Hollow fiber cartridges were purchased from FiberCell (Frederick, MD). Tedizolid (active moiety) powder was synthesized by BOC Sciences (New York, NY). The BACTEC Mycobacterial Growth Indicator Tube (MGIT) 960 system and supplies were purchased from Becton Dickinson (Franklin Lakes, NJ). Tedizolid for drug concentration assays was purchased from Toronto Research Chemicals (Toronto, Canada) and its internal standard, linezolid-d3, from CDN Isotopes (Quebec, Canada).
Determination of Minimum Inhibitory Concentrations
Tedizolid MICs against Mtb H37Ra were identified using both broth macrodilution technique and the MGIT assay, while those for the Mtb strains H37Rv, CDC1551, HN878, and auxotroph 18b were identified using the MGIT assay. The broth macrodilution method has been described elsewhere [13–15]. Tedizolid concentrations of 0, 0.25, 0.5, 1, 2, 4, and 8 mg/L were examined in triplicate in both assays. In the MGIT assay, 500 µL of Mtb in logarithmic phase growth at 105 colony-forming units (CFU) per milliliter was inoculated into MGIT tubes, then 0.8 mL of OADC supplement was added. MICs were called as defined by others in the past [25].
Tedizolid Exposure-Response in the Hollow Fiber System
The construction details of the HFS-TB for intracellular disease have been described elsewhere [4, 13–15, 26–28]. Human-derived THP-1 cells were infected with Mtb H37Ra as described previously [13–15]. Twenty milliliters of infected monocytes were inoculated into each of 8 HFS-TB units that had circulating RPMI/FBS. Tedizolid was administered to 7 HFS-TB on a once-daily dosing schedule via computerized syringe pumps to achieve AUC0-24 of 0, 1.02, 1.37, 4.62, 9.49, 50.8, 91.6, and 139.41 mg*h/L, at a half-life of 12 hours. The treatment duration was 28 days. Concentration-time profiles achieved in each HFS-TB were validated by sampling the peripheral compartment of each system at 1-, 6-, 10-, 18-, 21-, 23.5-, 25-, 30-, 34-, 42-, 45-, and 47.5-hour time points after the first tedizolid dose, and tedizolid concentrations were measured using assays described elsewhere [24]. The peripheral compartments were sampled on days 0, 3, 7, 10, 14, 21, and 28 for estimation of bacterial burden using both CFU counts and time-to-positivity (TTP; days) in the MGIT assay.
Next, we compared the tedizolid AUC0-24/MIC identified as mediating 80% of Emax in inhibitory sigmoid Emax models (EC80) of the study above to the linezolid EC80 identified in prior studies of HFS-TB for disseminated disease in duplicate HFS-TB units treated with daily therapy [13, 28]. In another set of duplicate HFS-TB units, we administered the tedizolid EC80 combined with the moxifloxacin exposure that we had combined with linezolid in the past [14]. We had 2 HFS-TB not treated with any antibiotics. The sampling schedules of the central and peripheral compartments for concentration-time profiles and for estimation of bacterial burden using CFU/mL and TTP were as described for the tedizolid exposure-effect study above. Tedizolid, moxifloxacin, and linezolid concentrations were measured using assays described previously [13, 14, 24].
RNA Sequencing and Bioinformatic Analysis
We have developed an RNA-seq approach for our HFS-TB samples, detailed in prior publications [4, 13]. Steps in extraction, sequencing, quality control, normalization, and calculation of reads per kilobase per million mapped (RPKM) have been described elsewhere [4, 13, 29]. For bioinformatic analyses, first, we looked for differentially expressed genes (DEGs), defined as any level of change in tedizolid-treated systems vs non-drug–treated systems (controls) for that day, using a Bonferroni corrected P < .05. Second, the pathways to which these DEGs mapped were identified using ingenuity pathway analysis (IPA). Third, in order to identify the toxicodynamic relationships, we utilized the inhibitory sigmoid Emax model of AUC0-24 vs THP-1 monocyte count as well vs RPKM values of all genes encoding ETC complex I, III, IV, and V enzymes.
Pharmacokinetic and Pharmacodynamic Modeling
Tedizolid, moxifloxacin, and linezolid concentrations were modeled using ADAPT 5 software [30]. Pharmacokinetic (PK) modeling followed steps described in the past, with examination for either a 1- or 2-compartment model, with the best model chosen using Akaike information criteria [4, 31]. Model-derived AUC0-24, peak concentration (Cmax), and concentration-time profiles were identified. These were used to calculate PK/PD (pharmacodynamic) exposure values of AUC0-24/MIC, Cmax/MIC, and the percentage of time that concentration persists above the MIC (%TMIC) for each HFS-TB. For microbial effect, we performed inhibitory sigmoid Emax modeling for bacterial burden (log10 CFU/mL or TTP) vs the PK/PD exposure value for each of the sampling days, as described in the accompanying paper [28]. In the combination therapy study, microbial kill rates were calculated using the exponential decline model described previously [15].
RESULTS
The tedizolid MIC for Mtb H37Ra was 0.5 mg/L by broth macrodilution assay on 2 separate occasions. The MGIT-based MICs for Mtb H37Ra and the 4 other Mtb strains are shown in Table 1. The table shows that tedizolid susceptibility was similar between Mtb H37Ra and the more virulent strains.
Minimum Inhibitory Concentrations of Tedizolid Against Different Strains of Mycobacterium tuberculosis
| Mycobacterium tuberculosis Strain | Minimum Inhibitory Concentration (mg/L) |
|---|---|
| H37Ra | 0.25 |
| H37Rv | 0.25 |
| CDC 1551 | 0.25 |
| HN 878 | 0.25 |
| SS 18b | 0.125 |
| Mycobacterium tuberculosis Strain | Minimum Inhibitory Concentration (mg/L) |
|---|---|
| H37Ra | 0.25 |
| H37Rv | 0.25 |
| CDC 1551 | 0.25 |
| HN 878 | 0.25 |
| SS 18b | 0.125 |
Abbreviation: MGIT, Mycobacterial Growth Indicator Tube 960 system.
Tedizolid pharmacokinetics in the HFS-TB were best described by a 1-compartment model based on Akaike information criteria and were characterized by a clearance of 0.018 ± 0.010 L/h and a volume of 0.439 ± 0.211 L. The observed vs model-predicted concentrations had an r2 = 0.98, with a slope of 1.058 ± 0.017, indicating no bias (Figure 1A). We performed both manual and automated counts for infected monocyte viability, which were examined in a regression vs the tedizolid AUC0-24 to determine if there was the same concentration-dependent monocyte kill that we encountered with linezolid in the past [13–15]. Figure 1B shows that there was no exposure-dependent monocyte kill by tedizolid. Indeed, there was mostly poor convergence of the model on each sampling day; the highest r2 of 0.72 was encountered on day 14. However, the negative Hill slope and an Emax higher than that nontreated controls on day 14 mean that there were higher monocyte counts as the tedizolid AUC0-24 increased.

Tedizolid pharmacokinetics and effect on THP-1 monocytes. (A) One compartment-predicted vs observed tedizolid concentrations in the hollow fiber system. This indicates that the model describes the data well. (B) The number of THP-1 cells did not decline with increasing tedizolid area under the concentration-time curves during the course of the study, indicating minimal to no exposure-dependent kill. Abbreviation: AUC0-24, 0–24 hour area under the concentration-time curve.
RNA-seq of infected monocytes on each sampling day revealed good Phred quality score, which demonstrates that the sequences were of good quality. We realigned all the sequences to the human genome. The numbers of DEGs vs AUC0-24 in the tedizolid-treated relative to nontreated hollow fiber systems were inverted U-shaped curves (see Supplementary Figure 1A). The complete list of DEGs and their relative expression for each tedizolid concentration are given in Supplementary Table 1. IPA revealed that these DEGs mapped to the pathways shown in Supplementary Figure 1B. IPA of the 4 largest sets of DEGs mapped to upregulated eukaryotic initiation factor (eIF) 2 signaling, eIF4 and p70S6K signaling, unfolded protein response, and protein ubiquitination pathways, but no mitochondrial inhibition signature. Given the surprising result of no ETC inhibition signature, we examined mitochondrial gene RPKMs vs tedizolid AUC0-24 in an inhibitory sigmoid Emax model, with results shown in Supplementary Figure 2. The regression for most genes did not reach convergence due to poor fit. However, in those that did, there was a concentration-dependent increase in RPKM values. Thus, based on the RNA-seq (DEGs and RPKM), there was no evidence of concentration-dependent mitochondrial inhibition with tedizolid at doses tested.
Mtb time-kill curves for the different sampling days are shown in Figure 2A for each AUC0-24/MIC using log10 CFU/mL. Results are shown as AUC0-24/MIC ratio because the AUC0-24/MIC had better Akaike information scores than %TMIC. However, our study design was not meant to break AUC0-24 and peak concentration colinearity (r2 = 0.99), thus the peak-to-MIC ratio could also equally apply. Figure 2A shows that AUC0-24/MIC <38 failed to kill Mtb below the day 0 burden (stasis line), but all AUC0-24/MIC >38 did. The highest tedizolid AUC0-24/MIC exposure of 558 even showed total sterilization of the HFS-TB units on day 21, but with rebound on day 28. Figure 2B shows the same responses based on TTP readout. There were 2 response groups, those for tedizolid AUC0-24/ MIC ≤38, which paralleled the nontreated after day 10, and those with higher exposures, which show higher TTPs than at the start of therapy. Consistent with the higher sensitivity of the TTP assay compared to log CFU/mL, the highest tedizolid AUC0-24/MIC exposure of 558 did not totally sterilize any system by TTP even on day 21.
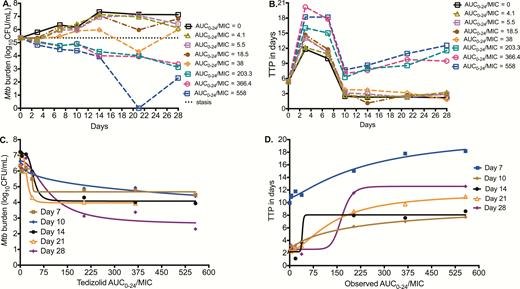
Effect of tedizolid against intracellular Mycobacterium tuberculosis (Mtb). (A) Microbial kill based on colony-forming units per milliliter (CFU/mL) is shown. At the highest tedizolid 0–24 hour area under the concentration-time curve/minimum inhibitory concentration (AUC0-24/MIC) tested, sterilization was achieved on day 21 followed by rebound on day 28. (B) Effect against intracellular Mtb using time-to-positivity (TTP; in days) shows an increase in TTP (ie, decrease in bacterial burden) with tedizolid therapy. On day 21, the highest tedizolid exposure had a relatively high TTP but nevertheless still demonstrated positivity, indicating bacterial growth and that the bacterial burden continued to decrease on day 28. (C) Tedizolid exposure vs log10 CFU/mL inhibitory sigmoid maximal microbial kill (Emax) model for each sampling day. The second inflection point (at Emax) is shown to be close to an AUC0-24/MIC of 200 by inspection of the day 28 curve. (D) Tedizolid AUC0-24/MIC ratio vs TTP shows the same result, including the finding that the inflection point at which the curve bends onto the asymptote at Emax is an AUC0-24/MIC ratio just below 200. Abbreviation: AUC0-24/MIC, 0–24 hour area under the concentration-time curve/minimum inhibitory concentration; MIC, minimum inhibitory concentration; Mtb, Mycobacterium tuberculosis.
Based on this relationship, the EC80 was calculated as an AUC0-24/MIC ratio of 183.55. Figure 2D shows the relationship between TTP and the AUC0-24/MIC ratio. The EC50 was an AUC0-24/MIC ratio of 164.8 at the end of the study (r2 = 0.99), which calculated to an EC80 AUC0-24/MIC ratio of 188.72. Thus, the optimal microbial kill exposure was similar by both response parameters. As regards to tedizolid resistance, we failed to isolate any resistant isolates during the 28-day study, likely because bacterial burden was below the inverse of the mutation frequency.
Next, we performed another HFS-TB experiment in which we compared the effect of a tedizolid EC80 exposure vs the linezolid EC80 exposure in duplicate HFS-TB units vs a tedizolid-moxifloxacin dual-therapy regimen. The concentration-time profiles of tedizolid, linezolid, and moxifloxacin achieved in the systems are shown in Figure 3A. The tedizolid AUC0-24/MIC ratio was 238.4, linezolid AUC0-24/MIC was 24.05, and moxifloxacin AUC0-24/MIC was 795. Figure 3B shows that linezolid EC80 killed Mtb compared to nontreated controls, but not below the stasis line. The tedizolid EC80 killed 4.05 log10 CFU/mL compared to nontreated control, which is consistent with the Emax value in the dose response (equation 1). Thus, tedizolid was more efficacious than linezolid in this intracellular HFS-TB model, with a day 28 difference of 4.17 log10 CFU/mL between the 2 optimal exposures. Figure 3C shows the results based on TTP. The same pattern is apparent, including the 2-phase response for tedizolid whose curve continues to diverge from controls, even on day 28 at the end of the experiment. Finally, the combination of tedizolid with moxifloxacin illustrates the rapid microbial kill, which was an elimination rate constant of 0.27 (95% confidence interval [CI], 0.19–0.39) per day, translating to a bacterial burden half-life decline of 2.55 (95% CI, 1.77–3.62) days (r2 = 0.95). While the MGIT tubes showed no growth up to day 56 on day 21 samples, this was followed by a rebound growth on day 28 samples, illustrating the need for a third drug.
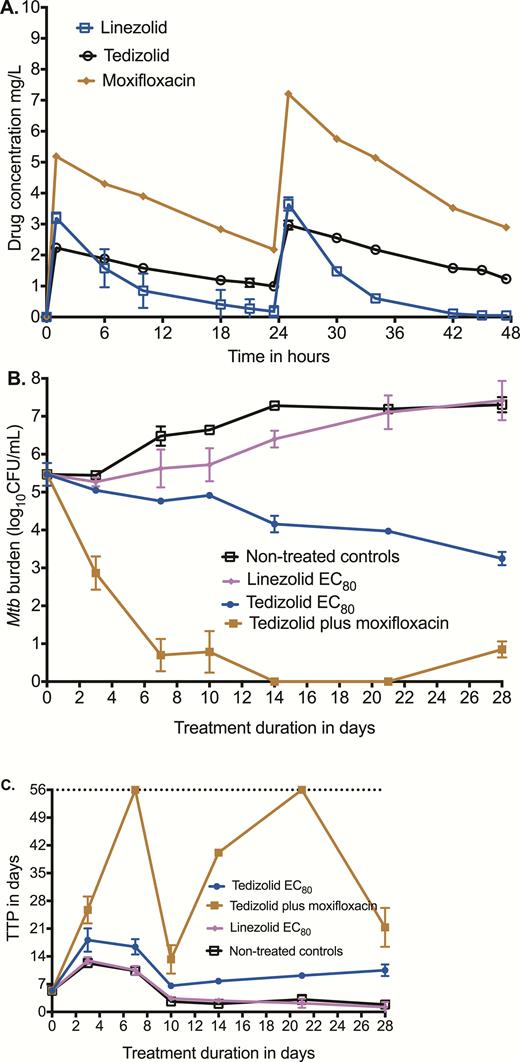
Comparison of tedizolid and linezolid in the hollow fiber system. (A) Concentration-time profiles of tedizolid, linezolid, and moxifloxacin achieved in replicate hollow fiber systems were as intended for children. (B) Microbial kill as revealed by colony-forming units per milliliter on each sampling day shows that tedizolid 80% of maximal bacterial kill (EC80) outperformed linezolid EC80. The microbial kill rate for the moxifloxacin-tedizolid combination was found to be high, and the slope was calculated using an exponential decline model. (C) Microbial kill described using the more sensitive time-to-positivity (TTP) parameter reveals a similar picture. Tedizolid TTPs were higher than for linezolid-treated systems and the tedizolid-moxifloxacin regimen had TTPs that went to negative rapidly but with rebound, supporting that this is an effective backbone regimen. Abbreviation: EC80, 80% of maximal bacterial kill; Mtb, Mycobacterium tuberculosis; TTP, time to positivity.
DISCUSSION
In the past, we found that linezolid was effective against intracellular tuberculosis in the HFS-TB and demonstrated synergy with moxifloxacin [13, 14]. Here, we identified the optimal exposure for the sister drug, tedizolid, and performed a head-to-head comparison of the efficacy to optimal linezolid exposure in the HFS-TB. The optimal tedizolid exposure (ie, EC80) killed intracellular Mtb more than linezolid, by a factor >10000-fold after accounting for the log10 CFU/mL scale. This is consistent with another comparison of the 2 drugs in the hollow fiber model of intracellular Mycobacterium avium-intracellulare complex, whereby tedizolid maximal kill was >10000-fold that of linezolid [24]. Our current findings suggest that, at a minimum, tedizolid substitution of linezolid would not compromise efficacy of linezolid-based regimens in children with disseminated tuberculosis. In combination with moxifloxacin, tedizolid demonstrated a bacterial burden elimination rate constant of 0.27 ± 0.05 per day (half-life, 2.55 days), which compares favorably to the linezolid-moxifloxacin elimination rate constant of 0.06 ± 0.01 per day (half-life, 11.52 days) we have demonstrated in the past [12]. This suggests that even in combination therapy, tedizolid could preserve the microbial kill of intracellular Mtb demonstrated by linezolid. We found tedizolid MICs in our isolates to be about 1–2 tubes dilution lower than linezolid. Other researchers report that the tedizolid MIC at which 90% of Mtb isolates are inhibited (MIC90) is 16 times lower in tedizolid (MIC90 = 0.125 mg/L) compared to linezolid [33]. In addition, in terms of entry into macrophages, the alveolar macrophage-to-serum AUC0-24 ratios in patients are 0.15–0.71 for linezolid vs a ratio of 20 for tedizolid [34–36]. Our PK/PD (pharmacodynamic) findings, the MIC distributions, and drug entry into macrophages suggest that tedizolid could be a reasonable alternative to linezolid-based regimens in children with tuberculosis.
A second important finding involves mitochondrial inhibition and cell kill of monocytes by tedizolid. High linezolid concentrations such as those between EC80 and EC90 killed THP-1 monocytes in the HFS-TB in the past, starting around day 21, which was associated with ETC enzyme inhibition on the RNA-seq, with an AUC0-24 IC50 of 94 mg*h/L [13, 14]. With a once-daily dosing schedule, tedizolid AUC0-24 of up to 90 mg*h/L did not kill monocytes at least up to 28 days. In addition, there was no inhibition of ETC enzyme genes. Thus, tedizolid could have less potential to inhibit the ETC. Our current studies also helped to begin to explain the dramatic upregulation of genes encoding ribosomal proteins and rRNAs we noted on RNA-Seq of linezolid-treated HFS-TB units in the past. We also identified the same gene upregulation with tedizolid, but this time these were accompanied by upregulated eIF2 signaling, eIF4 and p70S6K signaling, unfolded protein response, and protein ubiquitination pathways. There are 2 possible explanations. The first is that oxazolidinones increase mammalian protein synthesis. This is unlikely given their mechanism of effect. The second explanation is that this is likely a reflection of ribosomal and endoplasmic reticulum–related cell stress response. However, it is unclear why there would be an inverted U-shaped relationship with tedizolid concentrations so that this transcript signature is no longer available at high AUCs.
There are some limitations to our study. First, we failed to identify the tedizolid-resistant subpopulation. This is likely because the starting bacterial burden of 5.36 log10 CFU/mL was below the inverse of the tedizolid mutation frequency. On the other hand, starting with a higher bacterial burden leads to rapid monocyte death, which would limit duration of our HFS-TB studies. A second limitation is that we did not find any published tedizolid pharmacokinetic analysis in very young children. This precluded Monte Carlo simulations for estimation of target attainment probability rates. Similarly, data on cerebrospinal fluid (CSF) penetration is lacking given that tedizolid is a relatively new drug. As these data become available for the drug, proper simulations will be performed, accounting for the CSF penetration. A third limitation is that we did not examine the sterilizing effect of tedizolid, likely important in teenagers whose disease looks more like that of adults. Such sterilizing effect is explored in more detail in the accompanying article [37]. In spite of these limitations, we managed to demonstrate that tedizolid is highly efficacious against intracellular Mtb without the same mitochondrial inhibition-related transcript we identified for high concentrations of linezolid.
Supplementary Data
Supplementary materials are available at Clinical Infectious Diseases online. Consisting of data provided by the authors to benefit the reader, the posted materials are not copyedited and are the sole responsibility of the authors, so questions or comments should be addressed to the corresponding author.
Notes
Financial support. Funding for this study was provided by the National Institute of Allergy and Infectious Diseases of the National Institutes for Health (grant R56 AI111985). This supplement is sponsored by Baylor Research Institute, Dallas, TX.
Supplement sponsorship. This supplement is sponsored by the Baylor Institute of Immunology Research of the Baylor Research Institute.
Potential conflicts of interest. All authors: No reported conflicts of interest. All authors have submitted the ICMJE Form for Disclosure of Potential Conflicts of Interest. Conflicts that the editors consider relevant to the content of the manuscript have been disclosed.

