


Abstract
Linezolid has been successfully used for treatment of multidrug-resistant tuberculosis (MDR-TB). However, dose- and duration-related toxicity limit its use. Here, our aim was to search relevant pharmacokinetics (PK)/pharmacodynamics (PD) literature to identify the effective PK/PD index and to define the optimal daily dose and dosing frequency of linezolid in MDR-TB regimens. The systematic search resulted in 8 studies that met inclusion criteria. A significant PK variability was observed. Efficacy of linezolid seems to be driven by area under the concentration–time curve (AUC)/minimum inhibitory concentration (MIC). Literature is inconclusive about the preferred administration of a daily dose of 600 mg. To prevent development of drug resistance, an AUC/MIC ratio of 100 in the presence of a companion drug at relevant exposure is required. A daily dose of 600 mg seems appropriate to balance between efficacy and toxicity. Being a drug with a very narrow therapeutic window, linezolid treatment may benefit from a more personalized approach, that is, measuring actual MIC values and therapeutic drug monitoring.
Although multidrug-resistant tuberculosis (MDR-TB) is treatable and curable, worldwide only 54% of MDR-TB patients are successfully treated and 17% of patients died in 2016 [1]. MDR-TB is defined as simultaneous resistance to rifampicin and isoniazid, the cornerstones of the treatment of drug-susceptible tuberculosis (TB), which necessitates the use of expensive and toxic second-line treatment regimens. The World Health Organization has recategorized the second-line drugs with evidence for efficacy into 4 groups: 8-methoxy fluoroquinolones (group A); injectable agents (group B); linezolid, cycloserine preparations, ethionamide-based regimens, or clofazimine (group C); and add-on agents (group D) [2]. Linezolid is a group C antibiotic that has been shown to be effective in vitro, in animal models, in the hollow fiber system model of tuberculosis (HFS-TB), and in patients. Dosages of linezolid that have originally been based on the registered indication, for example, staphylococcal and streptococcal skin and soft tissue infections, resulted in toxicity such as optical and peripheral neuropathy and anemia, when applied to the longer duration of the MDR-TB treatment [3–9]. Lower dosages result in lower toxicity; however, linezolid has a narrow therapeutic range [10], so dosages should not be too low, which would result in resistance of the mycobacteria, failure of therapy, or even death [11].
Information on the most appropriate dose should be based on the pharmacokinetics (PK), that is, the behavior of linezolid in the patient’s body, and pharmacodynamics (PD), that is, the biochemical or pharmacological effect of linezolid on Mycobacterium tuberculosis (efficacy) and on the patient (toxicity). For most antituberculosis drugs, preclinical model-derived PK/PD indices and exposures, identified in properly designed studies, have been shown to be virtually identical to those in TB prospective clinical studies [12–21]. This suggests that this is a scientifically rational approach to deriving optimal doses and dosing schedules for the clinic [12–21]. However, the optimal dose and dosing schedule for linezolid in the treatment of MDR-TB have not been determined in a similar fashion. Therefore, in this systematic review we aimed to investigate the current evidence for the recommended dosages for the treatment of MDR-TB with regimens containing linezolid. Here, our aim was to search relevant PK/PD literature for the optimal daily dose and dosing frequency of linezolid in MDR-TB regimens. Furthermore, we wanted to identify the differences in dosing strategy between shorter-course and standard treatment for MDR-TB as well as differences in dosing strategy between MDR-TB and extensively drug-resistant tuberculosis (XDR-TB). Finally, we aimed to investigate whether there is a difference in dosing strategy between adults and children. Finally, we aimed to identify the effective PK/PD index and exposure target for linezolid in MDR-TB patients.
METHODS
Details and steps on our systematic review were as given in the introduction to this supplement [22]. The search terms were used to query PubMed and Web of Science. In the search terms detailed in the introduction, “drug name” was “linezolid” and “alternative drug name” was “PNU-100766”. The last search was performed 12 September 2017. Moreover, we searched selected articles for original data in references. In case the reviewers noticed data appearing in different publications, these data were included only once.
RESULTS
The Preferred Reporting Items for Systematic Reviews and Meta-Analyses (PRISMA) diagram (Figure 1) illustrates the study selection and exclusion process utilized for this review. The figure shows that we identified 8 PK, PD, and PK/PD clinical studies that met study criteria. The details of these studies are shown in the Supplementary Data 1. We also found 1 clinical early bactericidal activity (EBA) study and 7 preclinical PK/PD studies (6 HFS-TB studies and 1 animal study). The articles that were included in the formal linezolid dose finding using Monte Carlo simulations (MCSs) are shown in Table 1.
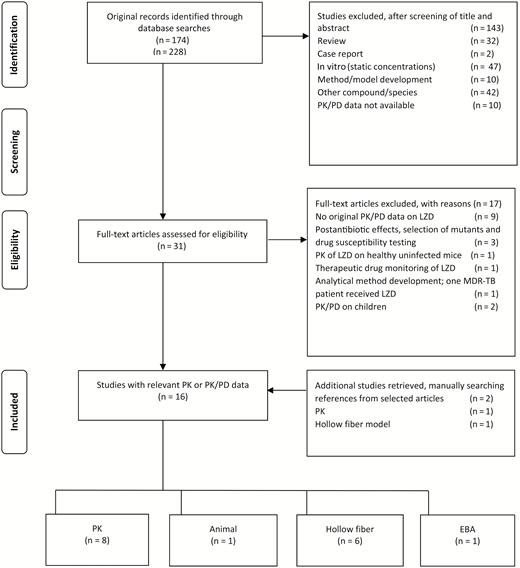
Preferred Reporting Items for Systematic Reviews and Meta-Analyses (PRISMA) diagram. Abbreviations: EBA, early bactericidal activity; LZD, linezolid; MDR-TB, multidrug-resistant tuberculosis; PD, pharmacodynamics; PK, pharmacokinetics.
Pharmacokinetic/Pharmacodynamic Hollow Fiber Studies of Linezolid Alone or in Combination Regimens
| Study | Deshpande [31] | Deshpande [32] | Deshpande [31] | Drusano [36] | Brown [34] | Srivastava [6] | Williams [9] |
|---|---|---|---|---|---|---|---|
| Age groupa | Children | Children | Children | Adults | Adults | Adults | Adults |
| Type of disease modeled | Disseminated | Disseminated | Disseminated | Pulmonary | Pulmonary | Pulmonary | Pulmonary |
| Bacterial metabolic status | Intracellular | Intracellular | Intracellular | Log-phase | Not stated | Semidormant | Log-phase |
| No. of drugs | 1 | 2 | 3 | 2 | 1 | 1 | 1 |
| Combination regimen | No | Moxifloxacin | Moxifloxacin Faropenem | Rifampin | No | No | No |
| Half-life, h, mean ± SD | 2.6 ± 0.4 (intracellular 8.9 ± 1.3) | 4.1 ± 0.7 | 2.2 ± 2.3 | 9.3 | 3.7 | 4.1 ± 0.3 | 2.7 ± 1.8 |
| PK/PD index | AUC0–24/MIC | AUC0–24/MIC | AUC0–24/MIC | … | Trough/MIC | AUC0–24/MIC | AUC0–24/MIC |
| Target PK/PD exposure, mean ± SD | 23.4 ± 1.2b | 206.5 ± 30.5c | 61.93d | 98.9e | … | 119 ± 17.7b | |
| Maximal kill below day 0, log10 CFU/mL or CFU/g | 0.2 | 4.5 | 6.0 | 6.0 | 3.3 | 5.4 | 1.5 |
| PK/PD index resistance suppression | NA | NA | NA | NA | … | AUC0–24/MIC and %TMIC | NA |
Abbreviations: AUC0–24, 0- to 24-hour area under the concentration–time curve; CFU, colony-forming units; MIC, minimum inhibitory concentration; NA, not available; PK/PD, pharmacokinetics/pharmacodynamics; %TMIC, percentage of time that concentration persists above the minimum inhibitory concentration.
aAge group describes the age group for which the hollow fiber study was designed.
bAUC0–24/MIC associated with optimal kill (EC80).
cAUC0–24/MIC in combination with moxifloxacin AUC/MIC ratio of 232.
dAUC0–24/MIC in combination with moxifloxacin AUC0–24/MIC and faropenem %TMIC>62.5%.
eAUC/MIC associated with maximal kill and resistance suppression when in combination with rifampin AUC/MIC of 123.3.
Pharmacokinetics
Eight articles investigated the PK of linezolid in adults with TB [5, 11, 23–28]. One study looked at linezolid in patients with drug-susceptible TB and the other 7 studies were in patients with drug-resistant TB (MDR-TB or XDR-TB). Two studies were of retrospective design [25, 28], 1 study recorded PK data but as a comparator for PK sampling strategies [24], 1 study was with clinical endpoints but did not assess the 0- to 24-hour area under the concentration–time curve (AUC0–24) [5], and 3 studies were observational studies on patients already receiving linezolid as part of their treatment [25, 27, 28]. Two other studies were designed to collect PK data [11, 23] and another one as well, though this study looked at the combination of clarithromycin and linezolid [26, 29]. Six studies used full AUCs to measure PK data [11, 23–27], 1 study used only peak and trough levels [5], and 1 study only looked at the concentration 2 hours after intake of the drugs [28]. The dosages used ranged from 300 mg once daily to 600 mg twice daily. Details of PK data are shown in the Excel file in the Supplementary Data. The drug exposure (median and interquartile range [IQR] of AUC0–24) are shown in forest plots per dose (Figure 2A–D. Overall weighted medians and IQRs are calculated and shown per dose.
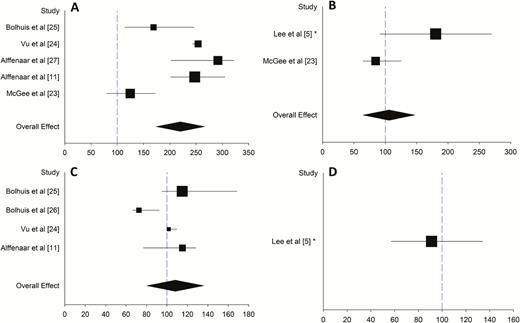
Forest plots showing linezolid area under the concentration–time curve (AUC) at different dosages. A, 600 mg twice daily. B, 600 mg once daily. C, 300 mg twice daily. D, 300 mg once daily. Median and interquartile range (IQR) are shown by the square and line. *Data are presented as mean and standard deviation. Symbol size represents the sample size of the study. Black diamond represents weighted median and IQR. Blue dashed line represents AUC value needed for treatment of Mycobacterium tuberculosis with minimum inhibitory concentration (MIC) of 1 mg/L (AUC/MIC ratio 100).
Pharmacokinetics/Pharmacodynamics
Animal Studies
Only 1 animal study fulfilled the aforementioned criteria. The study by Tasneen et al was excluded, as no data were given on minimum inhibitory concentration (MIC) and PK analysis was performed in uninfected mice [30]. Williams et al investigated linezolid PK/PD in TB-infected mice [9]. The study is presented in Table 1 side-by-side with HFS-TB studies. The multidose PK study of linezolid at 130 mg/kg daily demonstrated an AUC0–24 of 379 mg × hour/L, which is approximately 150% of the average steady-state AUC0–24 in humans receiving 600–625 mg twice daily (ie, 215–294 mg × hour/L). The linear kinetics of linezolid over this dose range permitted the authors to estimate that the 100 mg/kg dose in the mouse produced an AUC0–24 of approximately 292 mg × hour/L, an exposure that lies at the high end of the range for humans. Linezolid at 100 mg/kg showed a 0.74 log10 unit reduction in lung colony-forming unit (CFU) counts over 4 weeks, suggesting that it is not likely to have a great bactericidal effect in humans. The PK/PD parameter associated with microbial kill was AUC/MIC ratio. Based on the raw results shared with us by the authors, we performed inhibitory sigmoid Emax (maximal microbial kill) modeling. Model choices are made using Akaike information criteria and the r2 for models of fit. We identified a maximal kill of 1.88 ± 0.28 log10 CFU/g over 28 days of treatment. The exposure mediating 50% of maximal kill was an AUC0–24/MIC of 799 ± 93. Optimal exposure, defined as exposure associated with 80% of maximal kill (EC80), was an AUC0–24/MIC of 1400 ± 163 (r2 = 0.88). The authors concluded that linezolid showed limited bactericidal activity at clinically relevant concentrations in the murine model.
HFS-TB Studies
Six HFS-TB studies were identified by the literature search [6, 31–36], along with a seventh standalone study that performed MCSs for linezolid dose finding in children [37]. Four of the studies by the same group were specifically designed to evaluate PK/PD in children [31–33, 37]. These studies identified the PK/PD index associated with outcome in children and adults, and the PK/PD optimal exposure targets, and are summarized in Table 1. The authors stated that TB in young children with disseminated intracellular disease differs from cavitary pulmonary TB in adults and that pediatric patient show different linezolid PK and exposure than adults. Therefore PK/PD targets are different; for first-line anti-TB drugs, such targets are indeed different [19, 38]. In the HFS-TB for disseminated TB in toddlers and infants, the PK/PD parameter associated with optimal efficacy was the AUC/MIC ratio [31]. The EC80 for the monotherapy was an AUC0–24/MIC ratio of 23 [31]; these exposures are based on extracellular PK, and linezolid was 3.2-fold more concentrated inside cells, making the EC80 inside the infected macrophages an AUC0–24/MIC of 75. Linezolid AUC0–24 also best explained the mitochondrial electron transport chain gene inhibition, with 50% inhibition at 94 mg × hour/L. Based on a inhibitory model for mitochondrial dysfunction, they determined that the AUC0–24 of 94 mg × hour/L was the upper target level AUC0–24 above which there is an increase in mitochondrial toxicity [31].
In combination with moxifloxacin, linezolid could be antagonistic or additive, depending on the concentrations of the drugs [32]. In general, a combination of low linezolid and low moxifloxacin AUC/MIC was antagonistic. A low AUC was defined as 8.16 ± 0.53 mg × hour/L for linezolid and 14.88 ± 1.52 mg × hour/L for moxifloxacin. Moreover, a low moxifloxacin concentration with any linezolid AUC/MIC was found to be antagonistic. A linezolid 90% of maximal kill (EC90) (AUC0-24 of 206 mg × hour/L) was used as a control, which exceeded the earlier observed threshold for toxicity of AUC0–24 of 94 mg × hour/L, resulting in a less favorable result [32]. In a third study by Deshpande et al, faropenem was added to the linezolid moxifloxacin combination in an attempt to improve microbial kill. Although they did not present results on linezolid monotherapy in their study, the AUC/MIC ratio they used was 62 at a dosage of 20 mg/kg/day and an MIC of 1 mg/L [33]. This exposure is above the threshold for efficacy but below threshold for toxicity. Determination of the MIC was done by broth macrodilution (7H10) and Etest methods on 2 separate occasions; each was 1.0 mg/L [33].
With regard to adult-type disease, Brown et al performed a combined linezolid dose-effect and dose-fractionation monotherapy study that lasted 3 weeks, and identified trough/MIC as the PK/PD-linked index for microbial kill (Table 1) [34]. Based on their model output, we calculated an EC80 that was a concentration of 4.2 mg/L. Although there was a dose-effect relationship for size of linezolid-resistant subpopulation, the authors did not say which PK/PD index was linked to resistance emergence. However, it was not stated if these were log-phase growth bacteria or not. In a second study, the same group evaluated the combination of linezolid and rifampicin against log-phase growth M. tuberculosis in the HFS-TB [34, 36]. They examined 3 doses of linezolid: 150, 300, and 600 mg once daily. All monotherapy selected for a linezolid-resistant subpopulation. Based on the combination studies with different linezolid and rifampicin dosages, a linezolid AUC/MIC ratio of 99 was necessary to prevent emergence of linezolid- or rifampicin-resistant subpopulations [34]. Srivastava et al performed a combined exposure-effect and dose-fractionation study for sterilizing effect in a 42-day HFS-TB study; the MIC was 1 mg/L [6]. Microbial kill was best linked to AUC/MIC, whereas acquired resistance was linked to AUC/MIC at the beginning of the study but percentage of time that concentration persists above MIC (%TMIC) in the latter half of the study. Such a “wobble” in PK/PD parameters has been identified for other drugs in longer HFS-TB studies and in TB patients [19, 36, 39]. All AUC0–24/MIC >44 completely sterilized the HFS-TB at some point during the 6 weeks of therapy. As shown in Table 1, the EC80 was an AUC0–24/MIC of 120.
In summary, the preponderance of hollow fiber experiments and mouse studies revealed that linezolid efficacy was linked to AUC/MIC for bactericidal effect and for sterilizing effect. Second, resistance emergence is common and might be both AUC/MIC and %TMIC driven, due to a change in PK/PD parameter associated with resistance emergence when therapy-duration experiments are performed. Addition of a second agent, either rifampicin or moxifloxacin in the studies, led to better suppression of resistance; however some of the higher monotherapy doses alone achieved complete eradication of all bacteria in sterilizing effect experiments. Finally, the PK/PD targets derived using the disseminated intracellular models of TB commonly encountered in toddlers and infants differed from that in adult-type disease that was characterized by cavitary disease in which >80% of bacilli are extracellular.
Monte Carlo Simulations for Dose Selection
Three MCSs for dose selection were performed, 1 based on target exposures for monotherapy during sterilizing effect [6], and 2 based on combination therapy [36, 37]. In the sterilizing effect study, 3 MIC distributions from around the world were utilized, and the target AUC0–24/MIC of 119 was employed, leading to results shown in Figure 3A [36]. At a dose of 300 mg/day, the MIC below which a large portion of patients would fail therapy was 1.0 mg/L, at 600 mg/day the MIC was 2 mg/L, while at 1200 mg/day the MIC was >2.0 mg/L. A sensitivity analysis was performed, first by extending the EC80 to its upper 95% confidence bounds, and second, by assuming a lower linezolid penetration into lung, with results shown in Figure 3B. Figure 3B also shows the fraction of 10000 TB patients in which each dose would achieve the AUC0–24/MIC of 119. The dose of 150 mg was inferior. A daily dose of 300 mg (or 600 mg every other day) achieved the target in >90% of patients, and only fell just shy of 90% of patients in sensitivity analysis. The dose of 600 mg/day (or 1200 mg every other day) achieved the targets in sensitivity analysis, whereas 1200 mg/day did not improve at all on 600 mg/day. Thus, based on this exercise, doses of 300 mg/day, 600 mg/day, or 1200 mg/every other day would be optimal. Brown et al performed an MCS of 1000 patients to identify the proportion of patients who would achieve the linezolid AUC/MIC ratio of 99 in combination with rifampin that prevents resistance; the linezolid dose of 600 mg/day achieved the target in 96% of patients [34].
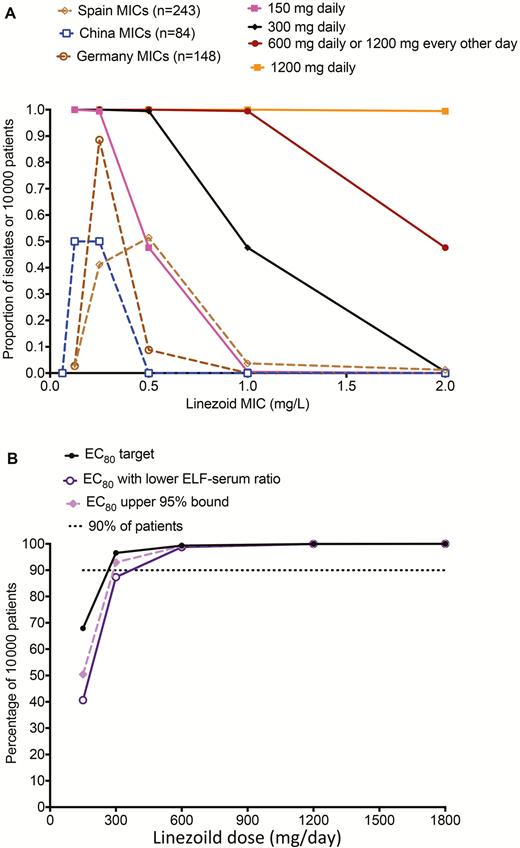
Target attainment of different doses in 10000 adult patients with tuberculosis. A, Target attainment of different doses in 10,000 adult patients with tuberculosis based on three MIC distributions. B, shows the fraction of 10,000 tuberculosis patients in which each dose would achieve the AUC0–24/MIC of 119. Abbreviations: EC80, exposure associated with 80% of maximal kill; ELF, epithelial lining fluid; MIC, minimum inhibitory concentration.
In children with disseminated TB, the target attainment for the exposure target AUC0–24/MIC of 62, which was additive with moxifloxacin and faropenem, was used in a 10000-child MCS dose-finding study. Because newborns have different population PK parameters from other infants, who in turn have different PK parameters from toddlers, each group was examined differently. Figure 4A–C shows the performance of different doses as MIC increased. At the highest dose tested of 20 mg/kg, the target attainment was <90% for MICs of 1 mg/L or higher. Figure 4D shows that the optimal dose for children, regardless of age group, was 15 mg/kg/day.
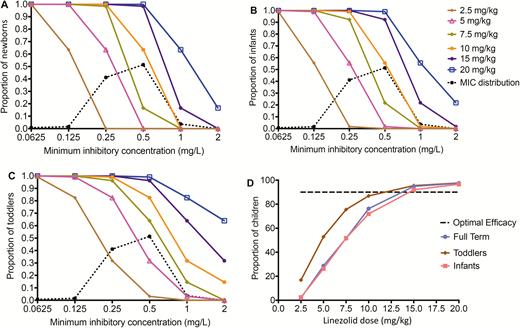
Target attainment of different doses in children. A, 600 mg twice daily. B, 600 mg once daily. C, 300 mg twice daily. D, 300 mg once daily. Median and interquartile range are shown by the square and line. *Data are presented as mean and standard deviation. Symbol size represents the sample size of the study. Blue diamond represents weighted median and interquartile range. Blue dashed line represents area under the concentration–time curve (AUC) value needed for treatment of Mycobacterium tuberculosis with minimum inhibitory concentration (MIC) of 1 mg/L (AUC/MIC ratio 100). Abbreviation: MIC, minimum inhibitory concentration.
Taken together, MCS data revealed that in adults, 600 mg/day would be optimal for both optimal microbial kill and, in combination with rifampin, would suppress resistance emergence. The dose of 300 mg/day also performs well for optimal kill, and in MDR-TB patients who are not on rifampin, can be combined with other drugs such as moxifloxacin. In children, the dose of 15 mg/kg/day was optimal, consistent with the up to 3-fold faster elimination of the drug in these age groups. Finally, the MIC above which patients fail linezolid is 1.0 mg/L in both adults and children, and should be considered the breakpoint for clinical decision making.
Early Bactericidal Activity Studies
The literature search resulted in 1 study on EBA [40]. Dietze et al investigated the early and extended bactericidal activity of 2 different doses of linezolid: 600 mg once and twice daily [40]. Thirty adult patients with newly diagnosed smear-positive isoniazid-susceptible pulmonary TB (10 per arm) were assigned to receive isoniazid (300 mg daily) and linezolid (600 mg twice daily or 600 mg once daily) for 7 days. Isoniazid was chosen as comparator as it is known to have the highest early EBA (0–2 days) of all known TB drugs [40, 41]. The mean EBA (0–2 days) of linezolid once and twice daily was 0.18 (standard deviation [SD], 0.27) and 0.26 (SD, 0.42) log10 CFU/mL/day, respectively. The mean extended EBA for 2–7 days of linezolid was minimal: 0.09 (SD, 0.17) and 0.04 (SD, 0.11) log10 CFU/mL/day for 600 mg and 1200 mg per day. These doses correlated with median AUC0–24 of 97 (IQR, 48–144) and 233 (IQR, 101–394) mg × hour/L. No correlation was found between EBA (0–2 days) or EBA(2–7 days) and AUC, Cmax (maximum concentration), or unbound free AUC/MIC for either linezolid dose. Linezolid is 31% protein bound (SmPC, Zyvox); although not mentioned in the Methods section, we assume that total linezolid concentrations have been analyzed and corrected for protein binding. High free AUC/MIC ratios corresponding to the EC90 value were observed, making it difficult to conclude on the absence of the correlation. Although drug exposure was lower in once-daily dosing than in twice-daily dosing, time above MIC and AUC/MIC appeared similar to and adequate for management of other resistant bacterial infections [2].
DISCUSSION
In this systematic review, we studied the current evidence for the recommended dosages for the treatment of MDR-TB with regimens containing linezolid. Since the introduction of the first anti-TB drug, it is known that monotherapy for TB causes high-grade resistance [42, 43]. This adage also counts for all second-line anti-TB drugs, including linezolid [44]. This overview of linezolid taught us that there is no early EBA, and only little extended EBA (2–7 days), advocating a small role for linezolid as sterilizing agent. In addition, no target for monotherapy could be established that is effective in preventing selection of drug-resistant mutants. Therefore, the concentration of other companion drugs must reach thresholds sufficient to prevent emergence of resistance to linezolid. From the hollow fiber model experiments, it appears that the concentration of the companion drug is important and has to exceed a certain threshold to prevent selection of linezolid-resistant mutants.
A significant PK variability can be observed and, as the difference between therapeutic and toxic drug concentrations of linezolid is rather small, therapeutic drug monitoring (TDM) may be indicated to optimize treatment. Based on this balance between efficacy and toxicity, 2 treatment strategies with linezolid can be proposed; however, it must be noted that these strategies will have to be validated in future studies:
Strategy 1: Short-course linezolid treatment (about 1 month) with 600 mg twice daily. No safety issues are expected as this is in line with the registered dosage for other indications than MDR-TB. This will allow the MIC to be higher and still reach the PK/PD target. Clearly, this strategy is limited by linezolid’s toxicity if treatment exceeds the period of 1 month.
Strategy 2: For long-term treatment (if tolerated till end of treatment), a maximum dose 600 mg once daily is recommended. For most of the isolates, a favorable AUC/MIC ratio will be reached. As toxicity is still a relevant problem at this dose, preferably a lower dose is used if lower MICs are detected. For this strategy, accurate determination of actual MIC values is recommended. For the current WHO short-course MDR-TB regimen, we refer to strategy 2, as strategy 1 is too toxic to be used for a period longer exceeding a period of 1 month.
Maximum kill (EC90) in hollow fiber models was observed at AUC/MIC of about 200 due to toxicity. This target can be reached at lower MIC but not at MIC values of 1 mg/L, which is the suggested epidemiological cutoff value without any consequence for toxicity. An AUC/MIC ratio of about 100 in presence of a companion drug with adequate exposure seems a very attractive target as it requires a lower dose and thereby reduces chance on toxicity.
The search strategy of this review was limited to studies specifically reporting PK/PD relationships; therefore, studies that contain PK, PD, or PK/PD data less explicitly (eg, not in title, abstract, tags, or Medical Subject Heading terms) might have been missed. Furthermore, data in healthy human volunteers were excluded from the review. This might be considered a limitation since one might argue that data from healthy volunteers is not informative, especially when compared with in vitro or animal data. However, PK data from healthy human volunteers might also be very different from TB patients due to comorbidities, disease-related malnutrition, or disease state [45]. Literature is inconclusive about the preferred administration of a daily dose of 600 mg. As AUC/MIC has a better correlation with bacterial kill compared to T>MIC (time the concentration exceeds the MIC during the dosing interval), no difference can be expected between 600 mg once daily or 300 mg twice daily. Once-daily 600 mg probably is easier to dose in a directly observed therapy regimen.
However, there are several knowledge gaps that direly need attention. Hollow fiber infection models used a very limited number of Mtb strains (different susceptibility patterns) for their study. From a scientific view, it seems interesting to repeat the experiments with a range of clinical strains. This can confirm whether the PK/PD targets are correct. Furthermore, the threshold for toxicity of linezolid established with the hollow fiber model needs to be validated within a prospective cohort. It also seems of interest to compare short-course 600 mg twice-daily with long-term < 600 mg once-daily treatment with respect to outcome and toxicity. Personalized linezolid treatment including MIC determination and TDM should preferably be studied in a prospective study to increase the level of evidence. Linezolid target attainment in children and corresponding treatment success rate should be studied in a prospective cohort. Finally, to study synergy between drugs in a treatment regimen is of importance, as it may help to guide selection of drugs for a regimen.
In conclusion, efficacy of linezolid seems to be driven by AUC/MIC. To prevent development of drug resistance, an AUC/MIC ratio of 100 in the presence of a companion drug at relevant exposure is required. A daily dose of 600 mg seems appropriate to balance between efficacy and toxicity. Being a drug with a very narrow therapeutic window [10], linezolid treatment may benefit from a more personalized approach—that is, measuring actual MIC values and TDM.
Supplementary Data
Supplementary materials are available at Clinical Infectious Diseases online. Consisting of data provided by the authors to benefit the reader, the posted materials are not copyedited and are the sole responsibility of the authors, so questions or comments should be addressed to the corresponding author.
Notes
Acknowledgments. This work is the result of a World Health Organization (WHO) initiative to systematically review the current recommended dose for second-line TB drugs presented in April 2017, Geneva, Switzerland.
Supplement sponsorship. This supplement is sponsored by the Baylor Institute of Immunology Research of the Baylor Research Institute.
Potential conflicts of interest. T. G. received grants from the National Institute of Allergy and Infectious Diseases, National Institutes of Health, during the conduct of the study. O. W. A. received grants from WHO, during the conduct of the study. All other authors report no potential conflicts. All authors have submitted the ICMJE Form for Disclosure of Potential Conflicts of Interest. Conflicts that the editors consider relevant to the content of the manuscript have been disclosed.

