


Abstract
The epidemiology of acute hepatitis A and E has been changing over the last 2 decades. The impact of concomitant chronic hepatitis B (CHB) on clinical outcomes remains unclear. We aimed to evaluate the morbidity and mortality of patients with acute hepatitis A or E with and without underlying CHB.
We identified consecutive patients with acute hepatitis A or E based on hepatitis serology from the electronic medical records of the Hospital Authority of Hong Kong from January 2000 to December 2016. Hepatic events, all-cause mortality, and liver-related mortality within 30 days of the diagnosis of acute hepatitis were evaluated.
The cohort included 1068 cases of acute hepatitis A and 846 cases of acute hepatitis E. More patients with acute hepatitis E than those with acute hepatitis A had underlying CHB (13.5% vs 8.0%; P < .001). Patients with hepatitis E had more all-cause mortality (3.9% vs 0.6%; P < .001), liver-related mortality (2.0% vs 0.3%; P < .001), and hepatic events (2.8% vs 0.3%; P < .001) within 30 days from diagnosis. In patients with acute hepatitis E, underlying renal failure (adjusted hazard ratio [aHR], 3.90; P < .001) and age ≥50 years (aHR, 3.25; P = .036) were associated with 30-day all-cause mortality, whereas CHB (aHR, 3.34; P = .02) was associated with 30-day liver-related mortality.
The mortality is higher in patients with acute hepatitis E than in those with hepatitis A. Coexisting CHB is the independent risk factor for liver-related mortality in patients with acute hepatitis E.
Acute hepatitis A and E have been a global health issue, especially in less developed countries where sanitary conditions are unfavorable. There have been approximately 1.5 million new cases of acute hepatitis A annually [1], yet the number has been declining over the past decade, likely related to the use of hepatitis A vaccine in some countries [2, 3]. In contrast, the incidence of acute hepatitis E has surged over the past decade [4, 5], causing an estimated 44000 deaths in 2015 according to the World Health Organization [6]. The clinical presentations of both acute hepatitis A and E range from asymptomatic hepatitis to fulminant liver failure and death [7].
Current knowledge on the clinical outcomes of acute hepatitis A and E is incomplete. Most studies involved relatively small numbers of patients [8] or patients admitted to tertiary centers [9]. This has hampered detailed analysis on the risk factors of adverse outcomes. One notable example is the issue of concomitant chronic hepatitis B virus (CHB) infection, which is common in many hepatitis A and E–endemic areas. So far, data on the impact of underlying CHB in patients with acute hepatitis A or E have been conflicting, with reports ranging from no to 20% increase in mortality [10–12]. Hence we aimed to evaluate the clinical outcomes of patients with acute hepatitis A and E in a region endemic for CHB and to establish the impact of CHB on the outcomes in those patients.
METHODS
Study Design and Data Source
We performed a population-level retrospective registry study using data from the Clinical Data Analysis and Reporting System (CDARS) of the Hospital Authority, Hong Kong. CDARS facilitates the retrieval of clinical data captured from different operational systems for analysis and reporting and provides good-quality information to support retrospective clinical and management decisions by integrating the clinical data residing in data warehouse [13]. This system captures diagnosis codes and laboratory results from all public hospitals and clinics in Hong Kong. All subjects with positive immunoglobulin M (IgM) to hepatitis A virus (HAV) and hepatitis E virus (HEV) between 1 January 2000 and 31 December 2016 were identified. Patients who had incomplete demographic data or clinical outcomes, age <18 at diagnosis, or concomitant acute hepatitis A and E infections were excluded.
Patients were followed for 30 days since the date of first documented positive IgM-HAV or IgM-HEV or until death. The study protocol was approved by the Joint Chinese University of Hong Kong–New Territories East Cluster Clinical Research Ethics Committee. Because of the retrospective nature of this study and the use of anonymized data, informed consent was waived.
Data Collection
Data were retrieved via CDARS in January 2017. Baseline date was defined as the date of the first appearance of IgM-HAV or IgM-HEV. Demographic data including sex and date of birth were captured. At baseline, liver and renal biochemistries and hematological and virological parameters were collected. Thereafter, serial liver and renal biochemistries were collected until the last follow-up. Renal failure was defined as chronic kidney disease stage 3A or greater based on estimated glomerular filtration rate (ie, <60 mL/minute/1.73 m2) established before the baseline date. The International Classification of Diseases, Ninth Revision, Clinical Modification (ICD-9-CM) diagnosis codes of relevant comorbidities (eg, cardiovascular diseases, diabetes mellitus), procedures, and laboratory parameters were retrieved and studied (Supplementary Table 1).
Outcomes
All deaths between January 2000 and December 2016 were determined using data from the Hospital Authority and Hong Kong death registry. Primary outcome was all-cause mortality. Secondary outcomes included liver-related mortality and hepatic events. Liver-related mortality was defined as death related to hepatic events. Hepatic events including hepatic encephalopathy, hepatorenal syndrome, and acute liver failure were identified based on ICD-9-CM diagnosis codes (Supplementary Table 1).
Statistical Analyses
Data were analyzed using SPSS software version 22.0 (IBM SPSS Statistics). Continuous variables were expressed as mean ± standard deviation or median (interquartile range) as appropriate, whereas categorical variables were presented as number (percentage). Qualitative and quantitative differences between 2 subgroups were analyzed by χ2 test or Fisher exact test for categorical parameters and Student t test or Mann-Whitney test for continuous parameters as appropriate. All variables were entered in the univariate analysis but only those variables with a P value <.2 were put into the multivariable analysis. On multivariable analyses with backward stepwise elimination, adjusted hazard ratios (aHRs) with 95% confidence intervals (CIs) of mortality were estimated with Cox proportional hazards regression. All statistical tests were 2-sided. Statistical significance was taken as P < .05.
RESULTS
Patient Characteristics and Incidence Trend
We identified 2227 potentially eligible subjects who first visited Hospital Authority clinics or hospitals with positive IgM-HAV or IgM-HEV during the study period. We excluded 4 subjects with concomitant positive IgM-HAV and IgM-HEV; 171 subjects of age <18 years; and 117 IgM-HAV–positive and 21 IgM-HEV–positive subjects with missing demographic data or clinical outcomes. The final analysis included 1068 patients with acute hepatitis A and 846 patients with acute hepatitis E (Figure 1).
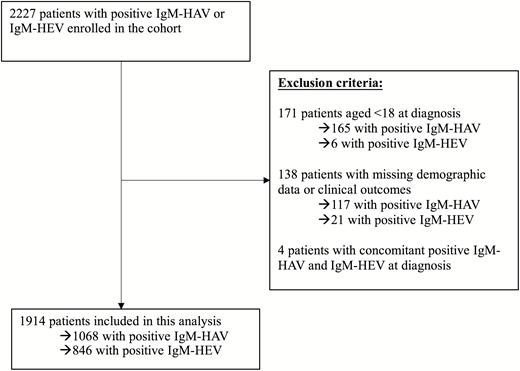
Flowchart of patient inclusions. Abbreviations: HAV, acute hepatitis A; HEV, acute hepatitis E; IgM, immunoglobulin M.
The number of patients with acute hepatitis E increased from 13 cases in 2000 to 64 cases in 2016, while that of acute hepatitis A decreased from 135 to 27 cases in the study period. The total number of patients with acute hepatitis A and E recruited by CDARS as well as the observed trends were consistent with the Centre for Health Protection (CHP) surveillance report based on clinician notification (Figure 2).
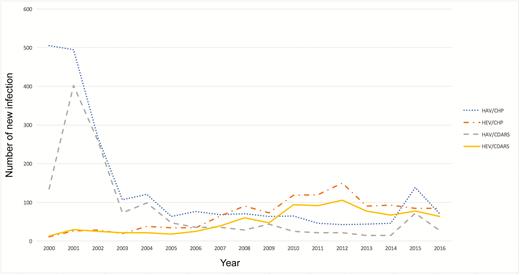
Total number of acute hepatitis A and E new infections, 2000–2016. Abbreviations: CDARS, Clinical Data Analysis and Reporting System; CHP, Centre for Health Protection; HAV, acute hepatitis A; HEV, acute hepatitis E.
Patients with acute hepatitis A were younger than the acute hepatitis E counterpart (33.7 ± 14.7 vs 53.6 ± 14.7 years; P < .001); the majority was male (61.3% and 67.4%, respectively). Eighty-five patients (8.0%) with acute hepatitis A also were positive for hepatitis B surface antigen (HBsAg), compared to 114 patients with acute hepatitis E (13.5%; P < .001). Thirty-one and 6 patients with acute hepatitis A and E, respectively, were born after the implementation of HBV universal vaccination in Hong Kong in 1988, and there was no significant change in the proportion of patients with CHB in either the acute hepatitis A or E cohort (8.2% and 13.6%, respectively). Patients with acute hepatitis E were also more likely to have renal failure (19.4%), cardiovascular disease (5.1%), and diabetes mellitus (14.8%) than those with acute hepatitis A (6.5%, 1.7%, and 2.3%, respectively; all P < .001).
Most patients had icteric hepatitis (72.5% of patients had serum total bilirubin >30 μmol/L) at the time of diagnosis of acute hepatitis (Table 1 and Supplementary Table 2). Patients with acute hepatitis E had higher serum total bilirubin level, international normalized ratio (INR), and serum creatinine level, and hence higher Model for End-Stage Liver Disease (MELD) score than the acute hepatitis A counterparts. In contrast, the serum alanine aminotransferase (ALT) levels in the acute hepatitis E cohort were significantly lower at 1583.5 (587.3–2855.0) IU/L, compared with 2032.5 (988.3–3209.8) IU/L in the acute hepatitis A cohort.
Baseline Clinical Characteristics
| Characteristic | Acute Hepatitis A (n = 1068) | Acute Hepatitis E (n = 846) | P Value |
|---|---|---|---|
| Male sex | 655 (61.3) | 570 (67.4) | .006 |
| Age, y, mean ± SD | 33.7 ± 14.7 | 53.6 ± 14.7 | <.001 |
| Platelet count, × 109 cells/L, mean ± SD | 189.7 ± 75.9 | 179.2 ± 86.9 | .013 |
| Missing, % | 30.6 | 11.3 | |
| INR, mean ± SD | 1.23 ± 0.58 | 1.50 ± 1.17 | <.001 |
| Missing, % | 30.6 | 12.1 | |
| Albumin, g/L, mean ± SD | 35.4 ± 5.0 | 31.3 ± 7.0 | <.001 |
| Missing, % | 24.8 | 10.0 | |
| Total bilirubin, μmol/L, median (IQR) | 97.3 (58.1–153.0) | 160.0 (60.0–297.0) | <.001 |
| Missing, % | 23.2 | 6.5 | |
| ALT, IU/L, median (IQR) | 2032.5 (988.3–3209.8) | 1583.5 (587.3–2855.0) | .001 |
| Missing, % | 23.0 | 6.4 | |
| Creatinine, μmol/L, median (IQR) | 81.3 (69.0–94.0) | 86.0 (72.5–103.0) | <.001 |
| Missing, % | 28.9 | 10.0 | |
| MELD score, mean ± SD | 14.4 ± 5.5 | 18.3 ± 9.3 | <.001 |
| Missing, % | 35.1 | 14.2 | |
| Positive HBsAg | 85 (8.0) | 114 (13.5) | <.001 |
| Positive anti-HCV | 6 (0.6) | 7 (0.8) | .482 |
| Comorbidities | |||
| Renal failure | 69 (6.5) | 164 (19.4) | <.001 |
| Cardiovascular diseases | 18 (1.7) | 43 (5.1) | <.001 |
| Diabetes mellitus | 25 (2.3) | 125 (14.8) | <.001 |
Data are presented as No. (%) unless otherwise indicated. Percentages are based on nonmissing data.
Abbreviations: ALT, alanine aminotransferase; anti-HCV, antibody to hepatitis C virus; HBsAg, hepatitis B surface antigen; INR, international normalized ratio; IQR, interquartile range; MELD, Model For End-Stage Liver Disease; SD, standard deviation.
Death and Hepatic Events
The 30-day all-cause mortality and liver-related mortality for patients with acute hepatitis E were 3.9% (33/846) and 2.0% (17/846), respectively; the corresponding figures in patients with acute hepatitis A were 0.6% (6/1068) and 0.3% (3/1068), respectively (both P < .001) (Table 2). Twenty-four patients (2.8%) with acute hepatitis E and 3 patients (0.3%) with acute hepatitis A developed acute liver failure within 30 days. Two of the 24 patients with acute hepatitis E who developed acute liver failure received liver transplantation and survived; they had MELD scores of 42.5 and 56.6 and one of them had underlying CHB. None of the patients with acute hepatitis A underwent liver transplantation.
Clinical Events in 30 Days
| Clinical Event | Acute Hepatitis A (n = 1068) | Acute Hepatitis E (n = 846) | P Value | |||
|---|---|---|---|---|---|---|
| All-cause mortality | 6 (0.6) | 33 (3.9) | <.001 | |||
| Liver-related mortality | 3 (0.3) | 17 (2.0) | <.001 | |||
| Hepatic events | 3 (0.3) | 24 (2.8) | <.001 | |||
| HBsAg | Positive (n = 85) | Negative (n = 983) | P Value | Positive (n = 114) | Negative (n = 732) | P Value |
| All-cause mortality | 2 (2.4) | 4 (0.4) | .076 | 8 (7.0) | 25 (3.4) | .071 |
| Liver-related mortality | 1 (1.2) | 2 (0.2) | .220 | 6 (5.3) | 11 (1.5) | .018 |
| Hepatic events | 1 (1.2) | 2 (0.2) | .220 | 6 (5.3) | 18 (2.5) | .120 |
Data are presented as No. (%) unless otherwise indicated. P values were estimated with χ2 test or Fisher exact test, whenever appropriate.
Abbreviation: HBsAg, hepatitis B surface antigen.
Four patients (2 from each cohort) had background cirrhosis before the study. In addition, 1 and 3 patients with acute hepatitis A and E, respectively, were pregnant during diagnosis. None developed hepatic events or death.
Predictors of Death in Patients With Acute Hepatitis E
As patients with acute hepatitis E exhibited significantly higher rates of mortality and hepatic events, targeted Cox proportional hazards regression models were employed to identify predictors of death in this subgroup. In multivariable analyses in patients with acute hepatitis E, preexisting renal failure (aHR, 3.90 [95% CI, 1.86–8.16]; P < .001) and age ≥50 years (aHR, 3.25 [95% CI, 1.08–9.76]; P = .036) were independent factors associated with 30-day all-cause mortality (Table 3). Preexisting renal failure (aHR, 3.23 [95% CI, 1.55–6.72]; P = .002) was the single independent factor associated with 30-day all-cause mortality in stratified univariate and multivariate analyses for acute hepatitis E patients aged ≥50 years. In multivariate analysis of patients aged <50 years, positive HBsAg (aHR, 18.38 [95% CI, 1.79–188.94]; P = .014), positive antibody to hepatitis C virus (aHR, 13.10 [95% CI, 1.25–137.23]; P = .032) and preexisting renal failure (aHR, 19.55 [95% CI, 2.56–149.35]; P = .004) were associated with 30-day all-cause mortality (Supplementary Table 2). Among 33 deaths from all-cause mortality, 18 patients had coexisting renal failure (54.5%). Of the 16 deaths from non-liver-related causes, 25% passed away due to pneumonia and sepsis, and 18.8% were due to hemorrhagic complications with nontraumatic intracranial or gastrointestinal hemorrhage. No hepatic events were noted in those with hemorrhagic complications. The rest of the non-liver-related deaths were unspecified. Of those who survived, the serum creatinine level in 95% of patients with acute kidney injury spontaneously returned to baseline with a mean duration of 17 days, without any form of dialysis. On the other hand, positive HBsAg was the independent predictor of 30-day liver-related mortality (aHR, 3.34 [95% CI, 1.21–9.23]; P = .02) (Table 3), in which 35.3% (6/17) of patients died from liver-related causes had underlying CHB.
Cox Proportional Hazards Regression Analyses of 30-Day All-Cause Mortality and 30-Day Liver-Related Mortality in Patients With Acute Hepatitis E Infection
| Univariate Analysis | Multivariable Analysis | |||||
|---|---|---|---|---|---|---|
| Characteristic | HR | (95% CI) | P Value | aHR | (95% CI) | P Value |
| 30-day all-cause mortality | ||||||
| Male sex | 1.117 | (.532–2.347) | .770 | |||
| Age ≥50 y | 4.690 | (1.649–13.340) | .004 | 3.245 | (1.079–9.762) | .036a |
| Albumin <35 g/L | NA | |||||
| Total bilirubin ≥18 μmol/L | NA | |||||
| ALT ≥ ULN | 0.844 | (.201–3.537) | .817 | |||
| Positive HBsAg | 2.088 | (.942–4.629) | .070 | 2.096 | (.931–4.717) | .074 |
| Positive anti-HCV | 3.794 | (.518–27.768) | .189 | 6.085 | (.783–47.305) | .084 |
| Renal failure | 5.273 | (2.657–10.464) | <.001 | 3.899 | (1.864–8.157) | <.001a |
| Cardiovascular disease | 2.657 | (.934–7.557) | .067 | 1.163 | (.386–3.501) | .789 |
| Diabetes mellitus | 0.790 | (.278–2.248) | .659 | |||
| 30-day liver-related mortality | ||||||
| Male sex | 1.168 | (.412–3.316) | .770 | |||
| Age ≥50 y | 2.987 | (.858–10.393) | .085 | 3.316 | (.942–11.680) | .062 |
| Albumin <35 g/L | NA | |||||
| Total bilirubin ≥18 μmol/L | NA | |||||
| ALT ≥ ULN | 0.818 | (.108–6.219) | .846 | |||
| Positive HBsAg | 3.550 | (1.313–9.599) | .013 | 3.344 | (1.212–9.225) | .020a |
| Positive anti-HCV | 7.618 | (1.010–57.451) | .049 | 6.954 | (.869–55.651) | .068 |
| Renal failure | 1.754 | (.618–4.977) | .291 | |||
| Cardiovascular diseases | NA | |||||
| Diabetes mellitus | 0.768 | (.176–3.356) | .725 | |||
Abbreviations: aHR, adjusted hazard ratio; ALT, alanine aminotransferase; anti-HCV, antibody to hepatitis C virus; CI, confidence interval; HBsAg, hepatitis B surface antigen; HR, hazard ratio; NA, not available; ULN, upper limit of normal.
aP < .05.
Patients with acute hepatitis E and positive HBsAg were more likely to be male (76.3% vs 66.0%) and had lower baseline platelet count (152 vs 184 × 109 cells/L) and ALT levels (1217 vs 1610 U/L). Serum bilirubin levels, INR, and MELD scores between the 2 groups were not significantly different (Supplementary Table 3).
Antiviral Treatment for Chronic Hepatitis B and Clinical Outcomes
Among the 199 patients who were HBsAg positive, 78 patients (13 and 65 in acute hepatitis A and E cohort, respectively) received oral nucleos(t)ide analogues (NAs) as the antiviral treatment for CHB. Among those who started oral NAs, 9 (69.2%) and 33 (50.8%) patients with acute hepatitis A and E, respectively, received NAs after diagnosis of acute hepatitis. NA-treated CHB patients had more hepatic events and mortality than untreated patients in the acute hepatitis E cohort (Table 4). Hepatic events and mortality did not differ significantly comparing those who started NA treatment before and after the diagnosis of acute hepatitis A or E. Use of entecavir in the hepatitis A and E cohorts with CHB coinfection did not increase hepatic events or mortality.
Clinical Events in 30 Days in Patients Who Were Positive for Hepatitis B Surface Antigen (n = 199) and Did or Did Not Receive Antiviral Treatment
| Clinical Event | NA-Treated | Untreated | P Value |
|---|---|---|---|
| Acute hepatitis A and HBsAg positive | (n = 13) | (n = 72) | |
| All-cause mortality | 1 (7.7) | 1 (1.4) | .284 |
| Liver-related mortality | 1 (7.7) | 0 (0) | .153 |
| Hepatic events | 1 (7.7) | 0 (0) | .153 |
| Acute hepatitis E and HBsAg positive | (n = 65) | (n = 49) | |
| All-cause mortality | 8 (12.3) | 0 (0) | .010 |
| Liver-related mortality | 6 (9.2) | 0 (0) | .036 |
| Hepatic events | 6 (9.2) | 0 (0) | .036 |
Data are presented as No. (%). P values were estimated with Fisher exact test.
Abbreviations: HBsAg, hepatitis B surface antigen; NA, nucleos(t)ide analogue.
DISCUSSION
This was one of the largest population-based studies on acute hepatitis A and E. The numbers of patients with acute hepatitis A or E identified were comparable to figures notified to the government, suggesting that the study has already captured almost all diagnosed cases and is representative of the whole population. In our study, patients with acute hepatitis E had poorer clinical outcomes than those with acute hepatitis A. Underlying CHB and coexisting renal failure (ie, chronic kidney disease stage 3A or greater) had major impacts on clinical outcomes, as they were independently associated with liver-related and all-cause mortality in patients with acute hepatitis E, respectively.
Studies from Europe and developing countries showed different outcomes on patients with preexisting CHB or other chronic liver diseases and acute hepatitis E. Chronic hepatitis B had no impact on morbidity and mortality in a multicenter study performed in the United Kingdom and Toulouse, France, where only 11 of 343 patients with cirrhosis (3.2%) had acute hepatitis E infection [10]. An Indian case-control study comparing cirrhotic patients and healthy subjects showed that patients who developed rapid decompensation were more likely to be HEV RNA positive (50%) than compensated patients (10%), which led to the conclusion that hepatitis E increased mortality of cirrhotic patients up to 20% [11]. A retrospective study of 228 Chinese CHB patients with acute hepatitis E demonstrated that presence of cirrhosis led to more severe disease [12]. These 3 existing studies illustrated that difference in clinical outcome would only be demonstrated in some cohorts with sufficient numbers of cirrhotic patients affected by acute hepatitis E at the same time. Our study reported the findings of one such large cohort of patients with acute hepatitis E, so that we could identify preexisting CHB as an important risk factor of liver-related mortality. A Chinese case-control study revealed no significant difference in serum HBV DNA levels to suggest any stimulation of HBV DNA and thus viral activity by the superimposed acute hepatitis E infection [14]. Hence, the underlying mechanism of poorer clinical outcomes with acute hepatitis E in patients with CHB, and whether background cirrhosis plays a role in the pathogenesis, remains unclear. Further scientific studies regarding any virological or molecular interactions shall be carried out.
Coexisting chronic kidney disease was shown in our study to associate with all-cause mortality in all patients and the age ≥50 years subgroup with acute hepatitis E infection. We postulate that patients with chronic kidney diseases have higher risks of infection [15–17] (eg, pneumonia) and platelet dysfunction, leading to higher bleeding risks than among normal subjects [15, 18]. This is turn leads to infective or hemorrhagic complications causing mortality, as implicated in our cohort with pneumonia, gastrointestinal bleeding, and intracranial bleeding being causes of death in acute hepatitis E patients with chronic kidney disease. Otherwise, stratified analysis in patients aged <50 years revealed wide CIs with limited clinical outcomes; thus, the results were of debatable significance.
Oral NAs are effective treatments for HBV infection, and our study showed that treating HBV is adversely related to clinical outcomes in acute hepatitis E patients with chronic HBV infection. Yet it is of note that the HBV status and HBV DNA levels of individuals were not retrieved from our database; significant numbers of patients received NAs after diagnosis of acute hepatitis, which may have significantly confounded the effect of NA treatment in chronic HBV infection with hepatitis E coinfection.
Our study also echoed the decreasing trend of acute hepatitis A and the increasing trend of acute hepatitis E over the decade in Hong Kong as well as other Asia Pacific countries including Singapore and Japan [19, 20]. With this trend, a higher incidence rate of acute hepatitis E and its related mortality will be anticipated. Given the implication of CHB infection in acute hepatitis E, preventive measures might be implemented, in particular for subjects at risk such as patients with CHB and chronic kidney disease [14]. Preventive measures include increasing public awareness, especially among high-risk groups, of the rising incidence of acute hepatitis E, and promoting sanitary measures. Furthermore, studies to evaluate the efficacy and safety of HEV vaccine in these high-risk groups are warranted.
Our study has the strength of large sample size and adopting hard clinical outcomes (eg hepatic events, deaths, liver transplantation) as our endpoints. ICD-9-CM diagnosis codes employed in retrieval of clinical data from a unifying database from different hospitals in Hong Kong added heterogeneity of cases and reduced selection bias. The consistent incidence rates with an independent source from the local health authority support the reliability and validity of our data. Yet our study also had a few limitations. First, it was a retrospective study with data collected from the local registry. The timing and frequency of blood tests were heterogeneous. However, the use of hard clinical outcomes has minimized the effect of this limitation. Second, there were missing data from the cohort. Although patients with incomplete demographics and clinical outcomes were excluded, about 20%–30% of laboratory parameters were missing in patients with acute hepatitis A, which might limit the statistical power of this subgroup. The low incidences of clinical events and mortality in both the hepatitis A and E cohorts might also have limited the statistical power of data analysis on their risk factors. Some patients with mild acute hepatitis A or E who were not hospitalized would have been missed, so we might have overestimated the mortality as the hospitalized patients tended to have more severe hepatitis and other complications. Fortunately, the difference in the numbers of cases identified by CDARS and CHP was small; in particular, most cases of acute hepatitis E were captured in recent years. Some patients with very mild acute hepatitis A might not even seek medical care; hence, these cases would not be captured by both CDARS and CHP. The same may also explain the higher prevalence of CHB in the acute hepatitis E cohort due to more severe clinical outcomes leading to hospital admission than the acute hepatitis A cohort.
In conclusion, CHB virus infection is an important risk factor of liver-related mortality in patients with acute hepatitis E, who had poorer clinical outcomes compared to those with acute hepatitis A. Further studies on the benefits of HEV vaccine in high-risk patients with preexisting CHB, particularly in those with other important risk factors, such as coexisting renal failure, would be warranted. Our study has provided important information to health authorities. Policy makers of countries or regions endemic for CHB should be proactive to implement targeted vaccination for HEV in subjects who are at increased risk of mortality.
Supplementary Data
Supplementary materials are available at Clinical Infectious Diseases online. Consisting of data provided by the authors to benefit the reader, the posted materials are not copyedited and are the sole responsibility of the authors, so questions or comments should be addressed to the corresponding author.
Notes
Author contributions. J. C.-T. L., G. L.-H. W., T. C.-F. Y., Y.-K. T., K. L.-Y. L., and V. W.-S. W. had full access to all the data in the study and take responsibility for the integrity of the data and the accuracy of the data analysis. All authors were responsible for the study concept and design. . C.-T. L., G. L.-H. W., T. C.-F. Y., Y.-K. T., K. L.-Y. L., and V. W.-S. W. were responsible for the acquisition and analysis of data. All authors were responsible for the interpretation of data and drafting, and critical revision of the manuscript for important intellectual content.
Potential conflicts of interest. G. L.-H. W. has served as an advisory committee member for Gilead, and as a speaker for Abbott, AbbVie, Bristol-Myers Squibb (BMS), Echosens, Furui, Gilead, Janssen, and Roche. G. C.-Y. L. has served as an advisory committee member for Gilead; has served as a speaker for MSD and Gilead; and has received research grant(s) from Gilead. H. L.-Y. C. is a consultant for AbbVie, BMS, Intellia, MedImmune, Gilead, Janssen, and Roche; has received honoraria for lectures from AbbVie, BMS, Echosens, Gilead, Merck, Novartis, and Roche; and has received an unrestricted grant from Roche for hepatitis B research. V. W.-S. W. has served as an advisory committee member for AbbVie, Roche, Novartis, Gilead, and Otsuka and as a speaker for AbbVie, BMS, Roche, Novartis, Abbott Diagnostics, and Echosens,. All other authors report no potential conflicts. All authors have submitted the ICMJE Form for Disclosure of Potential Conflicts of Interest. Conflicts that the editors consider relevant to the content of the manuscript have been disclosed.
References
Author notes
J. C.-T. L. and G. L.-H. W. contributed equally to this work.

