


Abstract
This study was performed to assess the incidence of and risk factors for Candida infection in the first 100 days after allogeneic hematopoietic stem cell transplantation (HSCT) and the impact on long-term survival.
We performed an outcome analysis of 28542 acute leukemia patients who underwent HSCT from 2000 to 2012. There were 347 patients with candidemia by day 100 and 28195 without candidemia or any other type of Candida infection.
The incidence of candidemia by day 100 was 1.2% and occurred at a median of 22 days after HSCT. Higher 100-day nonrelapse mortality (NRM; hazards ratio [HR], 3.0, P < .0001) and lower 100-day overall survival (OS; HR, 2.5, P < .0001) were observed in patients with candidemia. The case fatality rate by day 100 in patients with candidemia was 22% (76/347). Factors associated with candidemia occurrence were female gender, bone marrow or cord blood stem cell source, T-cell depletion, use of total body irradiation, and acute graft vs host disease. Among the patients alive at day 100, the 5-year NRM and OS after a median follow-up of 5.6 years (95% confidence interval, 5.5 – 5.7) for patients with and without candidemia were 22.5% vs 13.5%, P < .0001 and 45.6% vs. 53.4%, P = .0003, respectively. In multivariate analysis, the occurrence of a candidemia episode by day 100 was an independent risk factor for higher NRM (HR, 1.7, P = .001) and lower OS (HR, 1.4, P = .001).
The early occurrence of candidemia after HSCT is still associated with higher NRM and lower short- and-long-term OS.
Invasive fungal infection (IFI) is a frequent complication after hematopoietic stem cell transplantation (HSCT), negatively affecting overall patient morbidity and mortality in both adult and pediatric patients [1, 2]. Candida spp. is the second most frequent etiologic agent of IFI after HSCT, representing 11%–28% of all IFIs [1, 3, 4]. The epidemiology of Candida spp. infections changed with the advent of fluconazole prophylaxis. In 2 randomized, placebo-controlled trials conducted in the early 1990s, fluconazole was shown to reduce the incidence of systemic invasive candidiasis from 18%–20% to 3%–7% and, in 1 trial, also to improve the short-term survival at day 110 after HSCT [5, 6]. There was a subsequent detailed analysis after an 8-year follow-up in the study where fluconazole prophylaxis was maintained throughout the period of high risk of acute graft vs host disease (GVHD) occurrence, that is, for the 75 days after HSCT [7]. The analysis showed a survival benefit of fluconazole prophylaxis in patients who received an allogeneic graft, whether matched or mismatched, related or unrelated, due to a reduced incidence of late Candida infections, a decreased Candida-related mortality, and a decreased incidence of gut GVHD [7]. These data led to the broad adoption of fluconazole prophylaxis, administered during the pre-engraftment period of autologous and allogeneic HSCT and, only for allogeneic HSCT, extended to day 75 after HSCT to cover the period of higher acute GVHD risk. The introduction of echinocandins represented a further step forward in the antifungal prophylaxis after HSCT. In a randomized, double-blind, phase 3 trial involving the pre-engraftment neutropenic phase, micafungin showed an overall efficacy superior to that of fluconazole [8]. Other retrospective studies showed that prophylaxis with caspofungin was safe and effective in both adults and pediatric patients [9, 10]. Despite the improvements obtained with fluconazole and echinocandin prophylaxis, breakthrough Candida infections still occur [11], though less frequently than in the past, and are associated with a crude mortality of 39%–49%, with an attributable mortality of about 20%–50% and with an overall lower survival [1, 3, 12]. In recent years, with the advent of new antifungal drugs (eg, liposomal amphotericin B, echinocandins, triazoles), prospective randomized studies focused on response rates and 12-week survival after Candida infection, especially in nonneutropenic patients [13, 14]. The influence of Candida infection on long-term outcome after HSCT in the years when extended fluconazole prophylaxis has been routinely used has not been evaluated. Our aim in this study was to assess the incidence of and risk factors for Candida infection in the first 100 days after allogeneic HSCT and to assess the impact of candidemia on patient long-term survival.
Methods
The study included all first allogeneic HSCTs in patients with acute leukemia performed from January 2000 to December 2012 in member centers of the European Society for Blood and Marrow Transplantation (EBMT). This time interval was chosen based on the fact that during this period, human leukocyte antigen matching with a high-resolution method and the antifungal prophylaxis, at least with fluconazole, were routinely adopted by all transplant centers and, at the same time, the more recent antifungal drugs (liposomal amphotericin B, echinocandins, and triazoles) were available. The EBMT is a scientific organization that collects annual data from centers that perform autologous and allogeneic HSCT throughout Europe through a web-based registry called ProMISe. Data collection and processing were in accordance with standards at every center for patient confidentiality and good clinical practice.
Endpoints
The main endpoints were to assess the incidence of and risk factors for candidemia diagnosed by day 100 after HSCT and to assess their impact on nonrelapse mortality (NRM) and overall survival (OS).
Patient Data Selection
During the study period, 53476 first allogeneic HSCTs were performed in patients with an underlying diagnosis of acute leukemia and were registered in the ProMISe registry by completing the essential medical data form. This form is mandatory for all centers belonging to the EBMT network and requires information about demographics, type of acute leukemia, acute leukemia remission status, type of transplant, type of conditioning regimen, source of stem cell, engraftment, and survival. More detailed data are collected using a second optional transplant form that contains information about transplant complications such as organ toxicity, GVHD, and infections, although its completion is optional at the discretion of centers. The complete dataset required by both forms was available for 28793 of 53476 (54%) patients undergoing HSCTs. Candida infections of any type and diagnosed by day 100 were reported in 598 of 28793 patients (2.1%). The classification of Candida infections according to organs or system involved was as follows: blood Candida infection (candidemia), 347 (58%); deep organ candidiasis, 156 (26%); superficial candidiasis involving mucosa and skin; and candidiasis of genitourinary tract, 95 (16%). For the purpose of this study, the analysis was performed on 28542 comprising the 347 patients with candidemia by day 100 and the 28195 patients without candidemia or any other type of Candida infection. The remaining 251 patients with deep organ, mucosa, skin, and genitourinary tract Candida infections were excluded from analysis due to the difficulty of retrospectively determining whether they were proven, probable, or possible Candida infections. Figure 1 shows the selection process of study groups.

Flowchart of the selection process for the study group.
Patient Management and Definitions
A diagnosis of candidemia was based on the positivity of 1 or more blood cultures growing Candida species and the presence of clinical signs and symptoms of infection, as listed by international guidelines [15]. Standard measures were adopted, according to EBMT suggested policies, to prevent or treat organ toxicity, graft versus host reaction (GVHD), and infectious complications [16, 17]. Neutrophil (PMN) and platelet (PLT) engraftment were defined as the first of 3 and 7 consecutive days on which PMN and PLT counts exceeded 0.5 × 10⁹/L and 20 × 109/L, respectively. Standard criteria were used to define acute or chronic GVHD [18–20]. Only patients who had PMN engraftment or survived at least 100 days after HSCT were considered assessable for chronic GVHD.
Statistical Analyses
Descriptive statistics were performed for the main patient and HSCT characteristics using median and range in case of continuous variables and frequencies in case of categorical variables. The incidence of 100-day candidemia was estimated using the cumulative incidence method, considering the candidemia as the event of interest and the death due to any cause as a competing event. The univariate and multivariate risk factor analysis for 100-day candidemia was performed with the cause-specific Cox regression model. A variable with a P value < .1 in the univariate analysis was entered into the multivariate model. The following variables were considered for the model: patient and donor age (continuous), patient and donor gender, diagnosis (acute myeloid leukemia vs acute lymphoblastic leukemia [ALL] vs other), time from diagnosis to transplant, disease status, donor type, patient and donor cytomegalovirus (CMV) serostatus, intensity of conditioning, stem cell source, in vivo and ex vivo T-cell depletion, antithymocyte globulin (ATG) use, total body irradiation (TBI) use, acute GVHD, and PMN engraftment. The occurrence of candidemia, acute GVHD, and PMN engraftment were analyzed as time-dependent covariates. The OS and NRM after day 100 were assessed. Kaplan-Meier estimator was used to obtain the OS, considering death due to any cause as an event; the cumulative incidence method was applied to estimate the NRM, considering the relapse of the underlying disease as a competing event. This analysis was restricted to patients who survived to day 100 post-transplant. Case fatality rate was defined by any death in patients with candidemia. P values < .05 were considered statistically significant. In order to asses the cumulative incidence of candidemia according to the number of risk factors, we developed a risk scoring system, taking into account the variables that were significant based on the multivariate model known at the date of HSCT. All analyses were performed with the statistical software SAS v.9.4 (SAS Institute Inc., Cary, North Carolina).
RESULTS
During the study period, 28542 eligible patients from 26 countries and 153 EBMT centers, diagnosed with acute leukemia, who underwent a first allogeneic HSCT were identified. The median follow-up period was 5.6 years (95% confidence interval [CI], 5.5, 5.7); 15938 patients (56%) were male, with a median age at HSCT of 39 years, range 0–77.
Acute myeloid leukemia was the most frequent diagnosis reported in 18075 (63%) of cases. The incidence of candidemia by day 100 was 347 (1.2%), with a median time to occurrence of 22 days after HSCT (range, 1–100; Figure 2). Table 1 shows the main demographic, clinical, and transplant characteristics of the patients with and without candidemia by day 100. The case fatality rate by day 100 in patients with candidemia was 22% (76/347). Patients with candidemia showed a higher 100-day NRM (hazards ratio [HR], 3.0; 95% CI, 2.3–3.9; P < .0001) and lower 100-day OS (HR, 2.5; 95% CI, 2.0–3.2; P < .0001) compared with patients without candidemia.
Demographic and Clinical Characteristics of Study Patients
| Characteristic | Patients With Candidemia (N = 347) 1.2% | Patients Without Candidemia (N = 28195) 98.8% | Total (N = 28542) 100% |
|---|---|---|---|
| Sex of the recipient (n = 28 542) | |||
| Male | 173 (49.9) | 15 765 (55.9) | 15938 (55.8) |
| Female | 174 (50.1) | 12 430 (44.1) | 12604 (44.2) |
| Age of the recipient at HSCT, years (n = 28 542) | |||
| Median (range) | 40.1 (0.8–70.3) | 39.0 (0.3–77.3) | 39.0 (0.3–77.3) |
| Mean (SD) | 36.63 (17.85) | 37.09 (18.27) | 37.09 (18.27) |
| Underlying disease (n = 28 542) | |||
| Acute myeloid leukemia | 201 (57.9) | 17 874 (63.4) | 18075 (63.3) |
| Acute lymphoblastic leukemia /other acute leukemia | 146 (42.1) | 10 321 (36.6) | 10467 (36.7) |
| Donor age, years (n = 17 774) | |||
| Median | 35.8 (0.0–72.0) | 35.1 (0.0–84.0) | 35.1 (0.0–84.0) |
| Mean (SD) | 33.04 (16.88) | 33.33 (17.78) | 33.32 (17.76) |
| Time from diagnosis to stem cell transplantation, months (n = 28 542) | |||
| Median (range) | 6.7 (0.4–147.6) | 6.5 (0.0–652.0) | 6.5 (0.0–652.0) |
| Mean (SD) | 14.60 (18.97) | 13.80 (22.16) | 13.81 (22.13) |
| Donor type (n = 28 542) | |||
| Sibling | 126 (36.3) | 12 887 (45.7) | 13013 (45.6) |
| Mismatched related | 174 (50.1) | 11 862 (42.1) | 12036 (42.2) |
| Unrelated | 47 (13.5) | 3446 (12.2) | 3493 (12.2) |
| Status at HSCT (n = 25 389) | |||
| Complete remission | 305 (94.7) | 23 240 (92.7) | 23545 (92.7) |
| No complete remission | 17 (5.3) | 1827 (7.3) | 1844 (7.3) |
| Stem cell source (n = 28 542) | |||
| Peripheral blood | 204 (58.8) | 17 918 (63.6) | 18122 (63.5) |
| Bone marrow | 109 (31.4) | 8308 (29.5) | 8417 (29.5) |
| Cord blood | 34 (9.8) | 1969 (7.0) | 2003 (7.0) |
| Cytomegalovirus in the patient and donor (n = 24 342) | |||
| +/+ | 102 (30.7) | 9160 (38.2) | 9262 (38.0) |
| −/− | 101 (30.4) | 6874 (28.6) | 6975 (28.7) |
| −/+ | 35 (10.5) | 2541 (10.6) | 2576 (10.6) |
| +/− | 94 (28.3) | 5435 (22.6) | 5529 (22.7) |
| Antithymocyte globulin given for any reason (n = 26 208) | |||
| No | 197 (56.9) | 15 964 (61.7) | 16161 (61.7) |
| Yes | 149 (43.1) | 9898 (38.3) | 10047 (38.3) |
| T-cell depletion (n = 25 399) | |||
| No | 104 (30.7) | 11 726 (46.8) | 11830 (46.6) |
| Ex vivo only | 30 (8.8) | 790 (3.2) | 820 (3.2) |
| In vivo only | 174 (51.3) | 11 312 (45.1) | 11486 (45.2) |
| Both ex vivo and in vivo | 31 (9.1) | 1232 (4.9) | 1263 (5.0) |
| TBI given (n = 28 303) | |||
| No | 142 (40.9) | 13 563 (48.5) | 13705 (48.4) |
| Yes | 205 (59.1) | 14 393 (51.5) | 14598 (51.6) |
| TBI total dose, Gy (n = 12 821) | |||
| Median (range) | 12.0 (2.0–14.6) | 12.0 (0.1–24.4) | 12.0 (0.1–24.4) |
| Mean (SD) | 10.68 (3.23) | 10.15 (3.67) | 10.16 (3.67) |
| Reduced intensity conditioning (n = 27 785) | |||
| Reduced | 82 (23.7) | 7741 (28.2) | 7823 (28.2) |
| Standard | 264 (76.3) | 19 698 (71.8) | 19 962 (71.8) |
| Donor sex (n = 27 960) | |||
| Male | 209 (61.5) | 16 579 (60.0) | 16 788 (60.0) |
| Female | 131 (38.5) | 11 041 (40.0) | 11 172 (40.0) |
| Acute graft vs host disease (n = 27 169) | |||
| No | 216 (65.5) | 18 876 (70.3) | 19 092 (70.3) |
| Yes | 114 (34.5) | 7963 (29.7) | 8077 (29.7) |
| PMN engraftment by day + 100 (n = 28 060) | |||
| No | 16 (4.7) | 957 (3.5) | 973 (3.5) |
| Yes | 328 (95.3) | 26 759 (96.5) | 27 087 (96.5) |
| Time to PMN engraftment (n = 26 363) | |||
| Median | 17.0 (7.0–94.0) | 17.0 (1.0–100.0) | 17.0 (1.0–100.0) |
| Mean (SD) | 18.90 (8.88) | 18.00 (7.03) | 18.01 (7.06) |
Abbreviations: HSCT, hematopoietic stem cell transplantation; PMN, polymorphonuclear cell; SD, standard deviation; TBI, total body irradiation.
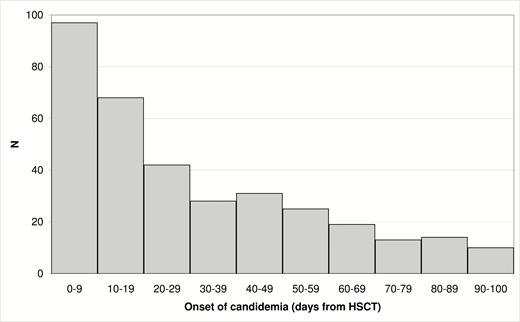
Distribution of candidemia episodes according to day of occurrence. Abbreviation: HSCT, hematopoietic stem cell transplantation.
Risk Factor Analysis for Candidemia by Day 100
In the univariate analysis, the factors that were associated with candidemia (P < .1) were female gender, diagnosis of ALL or other acute leukemia (undifferentiated, mixed, biphenotypic), mismatched related or unrelated donor, bone marrow (BM) or cord blood (CB) stem cell source, recipient/donor CMV serostatus +/-, myeloablative conditioning regimen, adoption of in vivo and ex vivo T-cell depletion, use of ATG, use of TBI, and the presence of acute GVHD. The multivariate analysis showed a significant association for female gender vs male (HR, 1.4; 95% CI, 1.1, 1.7; P = .007); BM or CB vs peripheral blood (PB) stem cell source (HR, 1.4; 95% CI, 1.1, 1.8; P = .007 for BM and HR, 1.9; 95% CI, 1.3, 2.8; P = .002 for CB); ex vivo only T-cell depletion (HR, 4.4; 95% CI, 2.8, 6.9; P < .001; in vivo only T-cell depletion (HR, 2.0; 95% CI, 1.5, 2.5; P < .0001); both ex vivo and in vivo (HR, 2.6; 95% CI, 1.6, 4.1; P < .0001); use of TBI (HR, 1.4; 95% CI, 1.1, 1.7; P = .01); and acute GVHD (HR, 1.7; 95% CI, 1.3, 2.4; P = .0006; Table 2).
Risk Factor Analysis for Candidemia: Results of Univariate and Multivariate Analyses
| Variable | Univariate | Multivariate | ||
|---|---|---|---|---|
| HR (95% CI) | P Value | HR (95% CI) | P Value | |
| Sex of the recipient | ||||
| Male | 1.000 | … | 1.000 | … |
| Female | 1.279 (1.036–1.578) | .0220 | 1.358 (1.086–1.698) | .0072 |
| Underlying disease | ||||
| Acute myeloid leukemia | 1.000 | … | … | … |
| Acute lymphoblastic leukemia/other acute leukemia | 1.257 (1.016–1.556) | .0351 | … | … |
| Donor type | ||||
| Sibling | 1.000 | .0012 a | … | … |
| Mismatched related | 1.520 (1.208–1.911) | .0003 | … | … |
| Unrelated | 1.439 (1.029–2.011) | .0333 | … | … |
| Stem cell source | ||||
| Peripheral blood | … | .0555 a | 1.000 | .0011a |
| Bone marrow | 1.142 (0.905–1.440) | .2644 | 1.412 (1.097–1.816) | .0074 |
| Cord blood | 1.538 (1.070–2.212) | .0201 | 1.873 (1.260–2.785) | .0019 |
| Cytomegalovirus in the patient and donor | ||||
| +/+ | 1.000 | .0204 a | … | … |
| −/− | 1.305 (0.991–1.719) | .0576 | … | … |
| −/+ | 1.227 (0.836–1.801) | .2962 | … | … |
| +/− | 1.556 (1.176–2.060) | .0020 | … | … |
| Antithymocyte globulin given (for any reason) | ||||
| No | 1.000 | … | … | … |
| Yes | 1.231 (0.995–1.524) | .0551 | … | … |
| T-cell depletion | ||||
| No | … | <.0001 a | 1.00 | <.0001a |
| Ex vivo only | 4.273 (2.846–6.414) | <.0001 | 4.428 (2.836–6.914) | <.0001 |
| In vivo only | 1.742 (1.366–2.221) | <.0001 | 1.951 (1.506–2.528) | <.0001 |
| Both ex vivo and in vivo | 2.860 (1.915–4.272) | <.0001 | 2.590 (1.645–4.078) | <.0001 |
| Total body irradiation given | ||||
| No | 1.000 | … | 1.000 | … |
| Yes | 1.355 (1.094–1.678) | .0054 | 1.381 (1.091–1.749) | .0074 |
| Reduced intensity conditioning | ||||
| Reduced | 1.000 | … | … | … |
| Standard | 1.270 (0.992–1.628) | .0583 | … | … |
| Acute graft vs host disease | ||||
| No | 1.000 | … | 1.000 | … |
| Yes | 1.668 (1.228–2.265) | .0011 | 1.740 (1.268–2.388) | .0006 |
Patient age at hematopoietic stem cell transplantation (HSCT), donor age, time from diagnosis to HSCT, remission status at HSCT, donor sex, and neutrophil engraftment were considered in the univariate analysis but were not significant (P > .1).
Abbreviations: CI, confidence interval; HR, hazards ratio.
aOverall comparison.
The cumulative incidence of candidemia for patients without or with 1, 2, 3, or more negative risk factors was 0.5% (0.2, 0.9), 0.9% (0.7, 1.1), 1.4% (1.2–1.6), and 2.1% (1.8, 2.5), respectively (P < .0001; Figure 3).
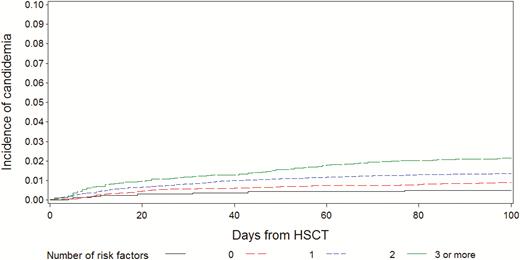
Cumulative incidence of candidemia according to the number of risk factors. Abbreviation: HSCT, hematopoietic stem cell transplantation.
NRM and OS at Day 100 After HSCT
At day 100 from HSCT, 24376 patients were alive; of them, 269 were with and 24107 were without a prior candidemia episode, respectively. In these 24376 patients, the 5-year NRM was 22.5% (95% CI, 17–28) vs 13.5% (13–14; P < .0001; Figure 4), and the 5-year OS was 45.6% (95% CI, 39–52) vs 53.4% (95%, 53–54; P = .0003; Figure 5) for the groups with and without candidemia, respectively.
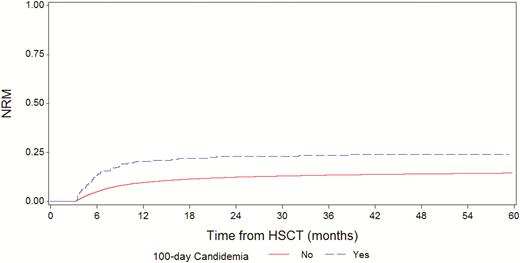
Nonrelapse mortality in patients with or without candidemia by day 100 post-hematopoietic stem cell transplantation. Abbreviation: HSCT, hematopoietic stem cell transplantation.
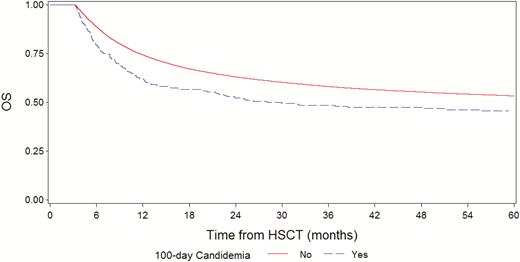
Overall survival in patients with or without candidemia by day 100 post-hematopoietic stem cell transplantation. Abbreviation: HSCT, hematopoietic stem cell transplantation.
The impact of the occurrence of candidemia by day 100 on NRM and OS after day 100 was assessed. After adjusting the models for the main demographic and clinical factors in both risk factor analyses, the occurrence of a candidemia episode by day 100 was associated with higher NRM (HR, 1.7; 95% I, 1.2, 2.3; P = .001 and lower OS (HR, 1.4; 95% CI, 1.1, 1.7; P = .001).
DISCUSSION
The burden of Candida infection has been diminished in the last 2 decades by the introduction of fluconazole and echinocandin prophylaxis [5–12, 21, 22] and, recently, as an indirect effect of mold-driven prophylaxis with broad-spectrum triazoles such as posaconazole and voriconazole [23–25]. The use of fluconazole as prophylaxis in the early months after HSCT as well as of micafungin is recommended because of its good safety profile and its efficacy in reducing morbidity by Candida infection [16]. A more recent epidemiological survey that compared 2 patient groups recruited in 2 periods, 1999–2003 and 2011–2015, showed that a reduced incidence of candidemia was documented for patients affected by lympho-myeloproliferative diseases and autologous HSCT; in allogeneic HSCT, the incidence, though low, did not change significantly, being 1.1% and 1.5% [12]. Notably, the incidence of candidemia found in this study was similar to that reported in a prospective European epidemiological study performed in 2005–2009, when the incidence of fungemia, 90% due to Candida species, ranged from 1.99% to 2.1% in allogeneic adult HSCT [26]. Given the lack of central pathogen review and the lack of standardization of isolation methods, we did not collect reliable information regarding the type of Candida species isolated. Actually, a common epidemiological feature reported recently is the increased isolation of C. non-albicans that is associated with a 12-week mortality rate of 48.9%. Among these Candida non-albicans species, Candida glabrata has been associated with a higher mortality, whereas infection by Candida krusei was generally considered a cause of failure of fluconazole prophylaxis due to its intrinsic resistance [3, 27–31].
The damage of innate immunity, especially breakage of the integrity of mucosal and skin barriers by mucositis or an indwelling central venous line, severe and prolonged neutropenia, prolonged use of steroids, concomitant bacterial infection or prolonged broad-spectrum antibiotic treatment, and use of parenteral nutrition is a known risk factor for the occurrence of Candida infection in cancer patients [30, 32]. In a retrospective study conducted from 1994 through1997, the risk factors for candidemia were colonization by Candida, bacteremia, and CMV disease [7]. In the present study, the clinical and transplant characteristics that are significantly associated with early candidemia in the multivariate analysis are the result of undesired effects of the transplant procedures on the patient’s innate immunity. TBI, as part of a myeloablative conditioning regimen, is an important cause of severe mucositis and severe neutropenia. The use of BM or CB as a stem cell source is associated with a slower neutrophil recovery compared with PB as a stem cell source. T-cell depletion and acute GVHD are associated with deeper immunosuppression and the need for high-dose steroids. In this analysis, female gender was a significant risk factor for candidemia. Unlike age, this is the first report of gender being significantly associated with candidemia occurrence [33]. Moreover, we found that the cumulative incidence of candidemia progressively increases with the number of risk factors, from 0.5% in patients without risk factors to 2.1% in patients with 3 or more risk factors.
Over the last 2 decades, several studies have reported an increased response rate and 12-week survival in patients with candidemia with the use of antifungal agents with a better efficacy and safety profile compared with the old deoxycholate amphotericin B [5, 34–36]. In the present study, the response rate to episodes of candidemia was not calculable because we did not have access to the type and duration of targeted treatment used for candidemia, although we emphasize that the period investigated includes the years in which echinocandins, liposomal amphotericin B, and voriconazole were widely available. Patients who develop an IFI after HSCT may have an inferior outcome compared with patients without IFI because the success of treatment is not only dependent on the intrinsic susceptibility of the isolated strain to antifungal therapy but is also influenced by the presence of comorbidity factors, the patient performance status, the status of remission of underlying disease, the type of immune recovery, and the development of acute or chronic GVHD. In fact, any type of IFI in the first 180 days after HSCT is the strongest independent prognostic factor for a lower 1-year survival [1]. In our study, assessing survival after day 100, we found that patients with an episode of candidemia by day 100 had a higher NRM and an inferior OS compared with patients without candidemia. Moreover, analyzing the risk factors, the occurrence of candidemia was associated with higher NRM and lower OS together with other factors such as sex of the recipient, age, CMV serostatus in the patient and donor, type of leukemia, disease remission status, T-cell depletion, acute GVHD, donor type, donor sex, type of conditioning regimen, and PMN engraftment already known to be associated with transplant outcomes. Although we cannot exclude that this poorer outcome is related to an insufficient control of Candida infection in HSCT patients or C. non-albicans–resistant strains, we speculate that Candida infection is a surrogate marker of those patients who may be more vulnerable due to immuno-incompetence and, therefore, more exposed to other causes of death, infectious and noninfectious.
In conclusion, the improvement in terms of prophylaxis and therapy of Candida infection has significantly reduced the burden of this complication in HSCT patients compared with the past, but candidemia remains associated with poorer short- and-long-term survival and high case-fatality rates. The negative impact of an early candidemia episode in the era of fluconazole and other broad-spectrum triazole or echinocandin primary prophylaxis warrants confirmation in prospective studies.
Notes
Acknowledgments. We thank Rodney Seddon for review of the English style and Anna Pegoraro, MD, for help with editing the manuscript
Potential conflicts of interest. All authors: No reported conflicts of interest. All authors have submitted the ICMJE Form for Disclosure of Potential Conflicts of Interest. Conflicts that the editors consider relevant to the content of the manuscript have been disclosed.

