


Abstract
Frequent use of antibiotics is thought to create selection pressure by clearing susceptible bacteria and allowing resistant bacteria to spread in a community. A cluster-randomized trial comparing 2 different frequencies of mass azithromycin distributions for trachoma provided a convenient experiment for determining the causal relationship between antibiotic consumption and antibiotic resistance.
Twenty-four communities were randomized to either annual or biannual mass azithromycin distributions for trachoma. Randomization was stratified on health catchment area and trachoma prevalence. Swabs were processed for the genetic macrolide resistance determinants ermB and mefA/E in a masked fashion from a random sample of 120 preschool children before treatment and another 120 children after 2 years of mass antibiotics.
Macrolide resistance determinants were similar in the 12 annually and 12 biannually treated communities before treatment, with a median prevalence among preschool children of 20% (interquartile range [IQR], 10%–40%) in each group. By 24 months, macrolide resistance determinants were found more commonly in the biannually treated communities (median, 60% [IQR, 50%–80%]) than the annually treated communities (median, 40% [IQR, 20%–40%]; P < .001). Adjusting for baseline, the 24-month prevalence of macrolide resistance determinants in the biannual group was 29.4% higher than that of the annual group (95% confidence interval, 10.5%–56.7%).
This randomized trial used direct genetic methods to confirm the causal relationship of community antibiotic consumption and antibiotic resistance. Communities randomized to less frequent use of antibiotics had a significantly lower prevalence of genetic antibiotic resistance determinants.
NCT00792922.
Selective pressure from antibiotics is thought to contribute to the spread of resistant bacteria in a community [1]. Although antibiotic selection pressure has proven difficult to study in a prospective experimental manner, mass drug administrations (MDAs) for trachoma provide a unique opportunity to do so. The World Health Organization has called for the global elimination of trachoma by the year 2020 (GET2020), and to that end recommends repeated mass distributions of azithromycin to clear the causative agent, Chlamydia trachomatis [2]. Entire communities receive a standard dose of azithromycin at high coverage levels at a single point in time, making trials of MDAs an attractive way to study community spread of antibiotic resistance.
A previous study performed in the context of MDAs for trachoma found that nasopharyngeal pneumococcal macrolide resistance was higher in communities that had been randomized to quarterly distribution of mass azithromycin compared with those that had not received any programmatic antibiotics [3]. In the present study, we expand upon these findings by comparing genetic macrolide resistance determinants in communities treated with annual vs biannual mass azithromycin treatments. Cluster randomization was chosen for the underlying trial to account for within-community transmission of ocular chlamydia. In the context of the present study, cluster randomization allowed the study of horizontal spread of resistance within communities. We hypothesized that communities treated less frequently, and therefore with a reduced level of antibiotic selection pressure, would have lower levels of macrolide resistance determinants.
METHODS
Study Design
This study describes a prespecified secondary outcome of the Niger site of the Partnership for the Rapid Elimination of Trachoma (PRET; ClinicalTrials.gov identifier NCT00792922) [4]. PRET-Niger was a cluster-randomized trial that took place in the Matameye district in the Zinder region of Niger from May 2010 to August 2013 [5]. The primary outcome of the trial was ocular chlamydia infection, and the main finding was that biannual mass azithromycin distributions targeted to children were noninferior to annual distributions of the entire community. Ethical approval was obtained from the Committee on Human Research at the University of California, San Francisco and the Comité d’Ethique du Niger.
Participants
Communities were eligible for PRET-Niger if they had a population of 250–600 people on the previous government census, were >4 km from the center of any semiurban area, and had >10% prevalence of clinically active trachoma among children 0–5 years of age, with active trachoma defined as the presence of trachomatous inflammation–follicular and/or trachomatous inflammation–intense [6, 7]. Mass azithromycin distributions were conducted in Matameye from 2002 to 2006, but no MDAs for trachoma had been administered since then. Due to the high prevalence of illiteracy in the study area, the ethical boards approved verbal consent, which was obtained from community leaders before randomization and from participants or a caregiver at the time of antibiotic distribution and examinations.
Randomization and Masking
The unit of randomization for the present study was the grappe, a government health unit (termed “community” in this report). Forty-eight communities were randomized in a 2 × 2 factorial design: standard (~80%) vs enhanced (>90%) treatment coverage, and annual treatment of the entire community vs biannual treatment targeted to children aged 6 months to 12 years. The methods for randomization and allocation concealment have been described previously [5]. Macrolide resistance was monitored in a stratified random sample of 24 communities, with an equal number from each of the 4 treatment groups. In the present study, we treat the annual MDA communities as a single group and the biannual MDA communities as a comparison group (Figure 1). Study participants were not masked to the intervention but laboratory personnel were masked to the study visit, community, and treatment arm.
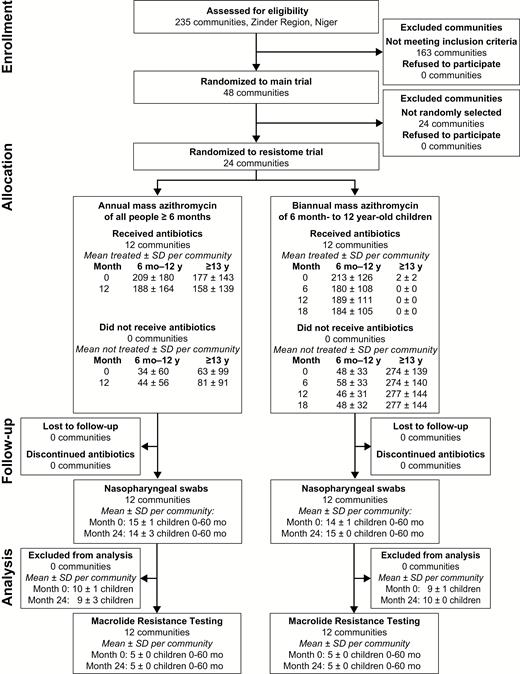
Participant flow diagram.
Abbreviation: SD, standard deviation.
Intervention
In the annually treated communities, all individuals aged ≥6 months were offered a single dose of oral azithromycin (20 mg/kg with a maximum dose of 1 g) every 12 months (months 0 and 12 in the present report). In the biannually treated communities, all children aged 6 months to 12 years were offered the same dose of azithromycin once every 6 months (months 0, 6, 12, and 18 in the present report). In both groups, children <6 months old were offered topical 1% tetracycline ointment to be applied to both eyes twice a day for 6 weeks [7].
Resistance Monitoring
The 24 communities randomly selected for nasopharyngeal swabbing were evaluated approximately 2–4 weeks before the baseline treatment and then again at the 24-month study visit, which was approximately 6 months after the fourth biannual mass treatment and 12 months after the second annual treatment. During these visits, trained field staff attempted to collect nasopharyngeal swabs from a random sample of 15 children aged 0–60 months from each community. Nasopharyngeal samples were collected using a calcium alginate swab, which was placed and transported in 1 mL of skim milk-tryptone-glucose-glycerin (STGG) medium [3, 8]. Samples were kept on ice for <8 hours while in the field, then at −20°C for 3 months in Niger, then at 4°C for <96 hours during transport to San Francisco, and finally at −80°C until processed.
Laboratory Assessment
Five swabs from the baseline visit and 5 from the 24-month visit were randomly selected from each of the 24 communities for resistance testing, resulting in a total sample of 240 swabs. Twenty-four randomly selected swabs were tested twice in a masked fashion to assess reproducibility. Polymerase chain reaction (PCR) testing for the 2 most common genetic resistant determinants associated with streptococcal macrolide resistance, ermB and mefA/E, was performed straight from the specimen, before isolating a specific bacterium [9]. Thus, this analysis characterizes the resistome of the entire nasopharyngeal niche as opposed to the resistance of a single bacterial isolate.
To analyze each sample, DNA was first extracted from 100 µL of STGG medium surrounding the swab, using the QIAamp DNA Mini Kit (Qiagen, Valencia, California). DNA was isolated following the manufacturer’s instructions with a few modifications, including an initial 1-hour incubation at 56°C with Buffer ATL and proteinase K and using 100 µL for the final elution volume. Fifty-microliter PCR assays targeted toward lytA (to detect the presence of pneumococcus), ermB, and mefA/E were then performed using 5 µL of extracted DNA and the TopTaq DNA polymerase kit (Qiagen, Valencia, California). Previously described primers and PCR conditions for lytA, ermB, and mefA/E regions were used in conjunction with the TopTaq manufacturer’s instructions to perform the reactions [9, 10]. Following amplification, gel electrophoresis was used to analyze the PCR products and to determine whether the 3 genes were present or absent in each sample.
To validate and compare this resistome approach to more traditional methods, a random subset of 33 of the 240 samples were chosen to undergo microbiology testing in parallel with the PCR testing. These 33 samples were processed according to our standard protocol described previously, using selective media in carbon dioxide at 35°C, optochin disks, and bile solubility testing to identify and isolate Streptococcus pneumoniae colonies [3]. Etest strips (bioMérieux, Marcy-l’Étoile, France) were used on S. pneumoniae isolates to determine minimum inhibitory concentrations (MICs) for azithromycin and clindamycin, with resistance defined as an MIC of ≥16 µg/mL and ≥2 µg/mL, respectively. Cross-resistance to both azithromycin and clindamycin (MLSB phenotype) is suggestive of ermB as the resistance determinant, whereas azithromycin resistance in the absence of clindamycin resistance (M phenotype) suggests mefA/E as the resistance determinant [11].
Statistical Methods
In the prespecified primary analysis, the community-specific prevalence of nasopharyngeal genetic macrolide resistance (ie, ermB and/or mefA/E) at 24 months was compared between the 12 annually treated and 12 biannually treated communities using a permuted t test (100000 replications, accounting for the stratified randomization). In light of the factorial design, we performed a similar analysis that modeled the prevalence of genetic resistance as a function of each factor of the randomization as well as the interaction between the 2 factors. To test the repeatability of duplicate tests, we calculated the analysis of variance–based intraclass correlation coefficient (ICC). To assess the between-community variation in macrolide resistance, we calculated an ICC from a mixed-effects logistic regression model that included data from both time points and specified community as a random effect with a random slope over time point. The sample size for the underlying trial was based on the primary trachoma outcome [5]. Because the expected effect size was larger for the resistance outcomes, we sampled fewer communities and children for this outcome. Assuming a community-level ICC of 0.1 from a previous study and a 2-sided α of .05, then including 5 children per community from each of 12 communities per treatment group provided 80% power to demonstrate a 30% difference in prevalence between the 2 treatment groups [3]. Statistical analyses were performed with R software (R Foundation for Statistical Computing, Vienna, Austria).
RESULTS
The pretreatment monitoring visit of the PRET-Niger trial took place in May 2010. Communities were subsequently randomized to either annual azithromycin distributions of the entire community or to biannual azithromycin distributions targeted to children (Figure 1). Baseline characteristics of the 2 treatment groups are shown in Table 1; groups were well balanced. Mass antibiotic distributions occurred as scheduled in all communities, with high antibiotic coverage in the targeted population (Figure 1) and among children <5 years of age (Table 1).
Baseline Characteristics and Azithromycin Treatment for Children Aged 0–60 Months
| Characteristic | Mean (95% Confidence Interval) | |
|---|---|---|
| Annually Treated (12 Communities) | Biannually Treated (12 Communities) | |
| Baseline characteristic | ||
| No. of children | 157 (59–254) | 159 (110–209) |
| Mean age, mo | 32 (31–34) | 33 (32–34) |
| Proportion female, % | 51.2 (48.4–54.0) | 48.4 (45.4–51.4) |
| Prevalence of follicular trachoma, % | 26.1 (17.8–34.4) | 18.7 (14.7–22.7) |
| Azithromycin coverage, % | ||
| Month 0 | 85.8 (82.3–89.0) | 80.1 (74.9–84.7) |
| Month 6 | 0 (0) | 84.2 (79.2–88.8) |
| Month 12 | 80.5 (77.6–83.4) | 80.4 (76.4–84.6) |
| Month 18 | 0 (0) | 79.7 (75.2–83.8) |
PCR assays for lytA, ermB, and mefA/E were successful in all 240 nasopharyngeal swabs, with lytA positive in 216 (90.0%), ermB positive in 70 (29.2%), and mefA/E positive in 37 (15.4%). The ermB and mefA/E resistance determinants were detected in 83 of 216 (38.4%) lytA-positive swabs and 5 of 24 (20.8%) lytA-negative swabs. Results stratified by age, treatment status, and geographic proximity are shown in the Supplementary Materials. The community-level ICC for the presence of ermB and/or mefA/E was 0.07 (95% confidence interval [CI], .01–.46). PCR testing was performed on 2 aliquots from the same tube for 24 samples; on average, 87.5% of these tested positive for lytA, 29.2% tested positive for ermB, and 10.4% tested positive for mefA/E. Among the 24 pairs, a discrepancy in the genetic result was found in 0 lytA pairs, 4 ermB pairs (ICC, 0.61 [95% CI, .36–.86]), and 1 mefA/E pair (ICC, 0.79 [95% CI, .63–.94]).
Table 2 shows the average prevalence of genetic resistance determinants in each arm before and 24 months after initiation of mass azithromycin distributions. The prevalence of genetic macrolide resistance determinants was identical in the 2 study groups before treatment, with a median of 20% (interquartile range [IQR], 10%–40%) of each community’s 5 randomly selected swabs positive for ermB and/or mefA/E in both the annual and biannual groups. After 2 years of mass treatments, the proportion of the community’s swabs positive for ermB and/or mefA/E increased in each group, to a median of 40% (IQR, 20%–40%) in the annually treated group and 60% (IQR, 50%–80%) in the biannually treated group (P = .08 for annual group and P = .002 for biannual group, sign rank test comparing pretreatment to month 24; Figure 2). The biannually treated communities were significantly more likely to have a positive test for ermB or mefA/E at month 24 than were the annually treated communities (P < .001, permuted t test accounting for stratified randomization). As a sensitivity analysis, we also performed a linear regression that adjusted for the proportion of swabs positive for ermB and/or mefA/E at baseline and included an interaction term to account for the factorial design; this gave a similar result (prevalence of resistance determinants 29.4% higher in biannual vs annual group; 95% CI, 10.5%–56.7%; P = .02, with an interaction P = .75).
Mean Prevalence of lytA, ermB, and mefA/E Genetic Determinants, Stratified by Study Visit and Treatment Arm
| Genetic Determinant | Month 0 | Month 24 | ||
|---|---|---|---|---|
| Annual (n = 12) | Biannual (n = 12) | Annual (n = 12) | Biannual (n = 12) | |
| lytA+ | 91.7 (83.8–99.5) | 90.0 (83.5–96.5) | 91.7 (83.7–99.6) | 86.7 (74.7–98.6) |
| ermB–/mefA/E– | 76.7 (65.7–87.6) | 76.7 (65.4–87.9) | 63.3 (52.0–74.6) | 36.7 (25.8–47.5) |
| ermB+/mefA/E– | 13.3 (5.1–21.6) | 13.3 (2.3–24.3) | 23.3 (12.8–33.8) | 35.0 (24.1–45.8) |
| ermB–/mefA/E+ | 5.0 (0–10.0) | 8.3 (0.4–16.2) | 1.7 (0.1–3.2) | 15.0 (0–30.7) |
| ermB+/mefA/E+ | 5.0 (0.1–9.9) | 1.7 (0.2–3.1) | 11.7 (3.8–19.6) | 13.3 (4.6–22.1) |
Data represent the average prevalence across the 12 communities of the treatment arm, with 95% confidence intervals in parentheses.
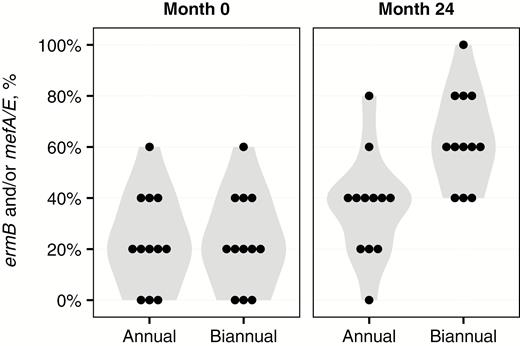
Violin plots depicting the proportion of swabs positive for either the ermB or mefA/E genetic resistance determinant, stratified by study visit and treatment group. A dot plot is superimposed, with each dot representing a community.
A subset of 33 swabs also underwent pneumococcal microbiology testing to validate the PCR resistome-based approach (Figure 3). Of these 33 swabs, 26 (78.8%) grew S. pneumoniae in culture, all of which were lytA positive on genetic testing. Of the 7 swabs from which S. pneumoniae could not be isolated, all except 1 were lytA negative on genetic testing. When comparing the microbiologic antibiotic susceptibility data with that of the resistance determinants, 26 of 33 (78.8%) samples had concordant results (ie, M phenotype accompanied by ermB–/mefA/E+ genetic results, and MLS phenotype accompanied by ermB+ genetic results). In the 7 instances where the results were discrepant, the genetic tests always detected macrolide resistance that the culture did not.
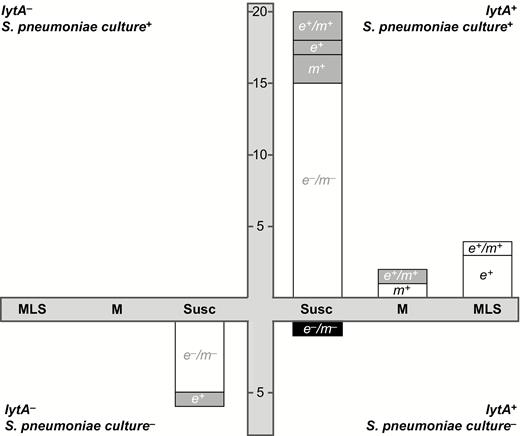
Comparison of microbiology and resistome approaches for detecting Streptococcus pneumoniae and macrolide resistance. The 4 quadrants depict all possible combinations of lytA genetic testing and S. pneumoniae microbiological testing. The swabs for which microbiological culture for S. pneumoniae and genetic testing for lytA were in agreement are shown in the upper right quadrant (both tests positive) and lower left quadrant (both negative). Each bar represents a group of samples with the same microbiological Etest result, with “MLS” indicating resistance to azithromycin and clindamycin, “M” indicating resistance to azithromycin only, and “Susc” indicating resistance to neither antibiotic. Within each bar, the number of swabs testing positive for each genetic resistance determinant is shown, labeled as e+ (ermB+/mefA/E–), m+ (ermB–/mefA/E+), e+/m+ (ermB+/mefA/E+), or e–/m– (ermB–/mefA/E–). The white portion of the bar indicates that the genetic results were concordant with the results from microbiologic testing, whereas the gray portion indicates a discrepancy.
DISCUSSION
This study’s key finding was the causal and cumulative exposure-dependent relationship between antibiotic selection pressure and community antibiotic resistance: Communities randomized to biannual mass azithromycin distributions had a significantly higher prevalence of genetic macrolide resistance compared with communities randomized to annual mass azithromycin. This positive correlation suggests not only that increases in a population’s azithromycin consumption will increase the amount of macrolide resistance, but also that curbing azithromycin use will directly lead to a reduction in community resistance.
The present study randomized communities to a difference in both the dose and frequency of antibiotic use, and performed resistance monitoring 6 months after the most recent antibiotic treatment in the biannual group, but 12 months after the most recent treatment in the annual group. Thus the difference in resistance determinants observed in this trial could be attributed to the volume of antibiotics, frequency of antibiotics, or proximity of treatment. We speculate that administering azithromycin to the entire population at the same time effectively cleared the vast majority of wild-type streptococcal and nonstreptococcal bacteria that were colonizing the nasopharyngeal niche, leaving only the preexisting azithromycin-resistant strains, which we observed in approximately 20% of children before treatment. Resistant bacteria likely spread to other children through direct contact, able to quickly take up residence in the nasopharynx given the lack of any competition from wild-type bacteria. However, wild-type bacteria are thought to be more fit than resistant bacteria [12, 13]. Previous studies have shown that in the absence of continued antibiotic selection pressure, the wild-type susceptible bacteria will eventually retake the nasopharyngeal niche [8]. Under this sequence of events, the frequency of antibiotic use was likely a more important factor than the total volume, as the biannually treated communities were not given as much time for the wild-type strains to reexert their competitive advantage [14]. It is important to note that these findings could also be explained simply by the differential time between treatment and monitoring in the 2 arms of the trial. Such an explanation would not change the main conclusion of the trial though, since the resistance determinants observed in the biannual arm would be present in the community for twice as long as those in the annual arm.
After 2 years of treatment, the proportion of preschool-aged children with genetic macrolide resistance was 40% for communities given annual mass azithromycin and 60% for those treated with twice-annual, child-targeted azithromycin. Differences in study design, geographic location, study year, and sample processing limit the ability to compare with prior studies. Nonetheless, it is worthwhile to note that the magnitude of genetic macrolide resistance determinants in the present study is higher than a previous study of child-targeted annual mass azithromycin distributions in Nepal, but consistent with a study from Ethiopia [8, 15]. The clinical impact of nasopharyngeal macrolide resistance is unclear, as macrolide antibiotics are not frequently used in most trachoma-endemic areas and resistance declines once MDAs are stopped [8, 16]. Moreover, although pneumococcal colonization of the nasopharynx is thought to be a necessary precursor for invasive pneumococcal disease, it is possible that resistant strains carry a fitness cost and are less able to invade [14, 17].
Instead of employing traditional microbiology to evaluate pneumococcal carriage and macrolide resistance, we chose to assess the macrolide resistome. Specifically, we evaluated the 2 most common macrolide genetic resistance determinants (ermB and mefA/E), without first identifying the organisms. The resistome approach is attractive in resource-limited settings where the cold chain is problematic, as bacteria need not be viable in a specimen in order for PCR to detect DNA. Moreover, the resistome approach allows an examination of the entire reservoir of genetic macrolide resistance present within any given specimen. As a result, ermB and mefA/E can be detected regardless of whether the genetic resistance determinant is present in a single pneumococcus strain, in multiple strains, or in a different bacterial species altogether.
This study has several limitations. The sample size was relatively small. We used a resistome approach, which limited the ability to assess clinical significance. For example, because ermB can be inducible, it is possible that this resistance determinant could have become repressed over time, mimicking wild-type bacteria. We did not attempt to estimate the proportion of pneumococci in the nasopharynx carrying the resistance determinants, further limiting the ability to infer clinical resistance from these data. The impact of the resistance determinants on respiratory infections in the study communities is unknown. Nonstudy antibiotic consumption was not quantified during the study. The study was conducted in Niger in communities that had received mass azithromycin distributions in the past, potentially affecting the generalizability to other settings. However, although it is possible that the magnitude of macrolide resistance may be specific to Niger, we think it likely that the key finding of the trial—that the relationship between antibiotic selection pressure and antibiotic resistance is causal and dose-dependent—is generalizable, especially given the solid foundation of other studies from diverse geographic locations [3, 18–20].
In conclusion, we assessed the ermB-mefA/E resistome of preschool children in communities randomized to either annual or biannual mass azithromycin treatments, and validated this resistome approach in a subset of swabs processed by conventional microbiologic methods. We found evidence that more frequent mass azithromycin treatments for trachoma were causally associated with an increased prevalence of genetic macrolide resistance. Our findings confirm observational studies that have noted a positive correlation between antibiotic consumption and antimicrobial resistance, and suggest that reducing levels of antibiotic consumption in a population is an effective method for reducing the community prevalence of antibiotic resistance.
Supplementary Data
Supplementary materials are available at Clinical Infectious Diseases online. Consisting of data provided by the authors to benefit the reader, the posted materials are not copyedited and are the sole responsibility of the authors, so questions or comments should be addressed to the corresponding author.
Notes
Disclaimer. The funder of the study had no role in study design, data collection, data analysis, data interpretation, or writing of the report. The corresponding author had full access to all the data in the study and has final responsibility for the decision to submit for publication.
Acknowledgments. The authors thank the data and safety monitoring committee, including Douglas Jabs, MD, MBA (chair); Antoinette Darville, MD; Maureen Maguire, PhD; and Grace Saguti, MD, who were generous with their time and advice and met before and during the study. The authors also thank Kurt Dreger, who designed and helped maintain the database, and all of our colleagues in Niger at Programme National de Santé Oculaire who helped perform the study, including Yacouba Moussa, Abdoul Karim Morou, Hadjara Soumana, Hamida Halirou, Hassane Seyni, Alhassane Yahaya Agali, Hadiza Dan Sounsou, Chano Hamidan, Adamou Madougou, Diallo Salamatou, and Omar Haougui.
Financial support. This work was supported by the Bill & Melinda Gates Foundation ; That Man May See; and Research to Prevent Blindness.
Potential conflicts of interest. All authors: No reported conflicts. All authors have submitted the ICMJE Form for Disclosure of Potential Conflicts of Interest. Conflicts that the editors consider relevant to the content of the manuscript have been disclosed.

