


Abstract
The effect of antiretroviral therapy (ART) on chloroquine and desethyl-chloroquine plasma concentrations was evaluated in clinical trial participants. Concentrations did not differ among participants receiving protease inhibitor–based ART (n = 9), efavirenz-based ART (n = 15), or other ART (n = 8) and those not receiving ART (n = 31). Efavirenz seemed to inhibit chloroquine desethylation.
Despite the rise of multidrug-resistant malaria parasites over the last several decades, chloroquine retains its clinical relevance. In endemic areas with chloroquine-susceptible, non-falciparum Plasmodium spp., it remains a recommended agent for the treatment and prevention of malaria [1]. Regions of sub-Saharan Africa where widespread use of chloroquine was abandoned owing to resistance have witnessed reemergence of susceptible parasites [2], although reports of resistance among Plasmodium vivax are increasing [3], and chloroquine continues to be used in some sub-Saharan African communities even where it is not a recommended therapy. It is also used in the treatment of autoimmune conditions.
Regions of malaria transmission overlap with those of high human immunodeficiency virus (HIV) prevalence, necessitating coadministration of antimalarial drugs and HIV antiretroviral therapy (ART). However, the potential pharmacokinetic drug interactions of chloroquine and ART in humans have not previously been reported [4]. Chloroquine plasma concentrations are mainly driven by its large apparent volume of distribution (100–1000 L/kg) and its slow clearance that occurs via multiple mechanisms of elimination, imparting a long terminal half-life of 20–60 days [5–7]. HIV protease inhibitors (PIs) are potent cytochrome P450 (CYP) 3A4 inhibitors and may interact with chloroquine—a substrate of various CYP isozymes—to increase chloroquine concentrations and predispose to toxicity [8]. Efavirenz, a nonnucleoside reverse-transcriptase inhibitor, is a mixed inhibitor and inducer of CYP isozymes and might thereby increase or reduce concentrations [8–10]. CYP-mediated desethylation of chloroquine produces an active major metabolite, desethyl-chloroquine, buffering against potential attenuation of drug effect by inducers [11].
METHODS
We assessed the pharmacokinetic drug interactions of PI- and efavirenz-containing ART regimens with chloroquine to inform the potential need, if any, for dose adjustment of chloroquine in patients on these regimens. The study was done in the context of a phase II clinical trial of chloroquine for reducing immune activation in HIV infection [12]. The trial enrolled 70 adults with HIV infection between 2009 and 2012, of whom 65 contributed specimens for pharmacokinetic assays (Figure 1).
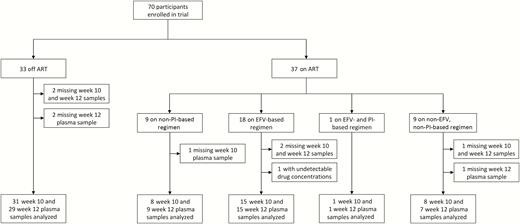
Flow chart of study participants included in the pharmacokinetic interaction analysis. Abbreviations: ART, antiretroviral therapy; EFV, efavirenz; PI, protease inhibitor.
Chloroquine phosphate was administered orally as a daily dose of 250 mg salt (150 mg base) for 12 weeks, and trough plasma samples were acquired 10 and 12 weeks after the first dose, when concentrations approach steady state. The trial included a group of participants not receiving ART (n = 31). Among patients receiving ART (n = 34), 9 were on a PI-based regimen, 16 on an efavirenz-based regimen, 1 on a regimen containing both a PI and efavirenz, and 8 on a regimen with neither a PI nor efavirenz. The PIs included ritonavir-boosted atazanavir (n = 7) and darunavir (n = 3). Other ART regimens were combinations of nucleoside reverse-transcriptase inhibitors (abacavir, emtricitabine, lamivudine, tenofovir, didanosine) with nonnucleoside reverse-transcriptase inhibitors other than efavirenz (etravirine, nevirapine, rilpivirine) and/or the integrase inhibitor raltegravir. The study was approved by the Johns Hopkins University institutional review board.
Plasma concentrations of chloroquine and desethyl- chloroquine were determined by means of a newly developed and validated method using solid-phase extraction and liquid chromatography with tandem mass spectrometry at the Department of Clinical Pharmacology, Mahidol-Oxford Tropical Medicine Research Unit, Bangkok, Thailand. The range of quantitation was 1.13–702 ng/mL, and the observed total assay coefficient of variation was <5% in all quality control samples, in accordance with US Food and Drug Administration guidance [13]. Forty-three participants had 2 replicates at identical time points, owing to duplicate aliquots. For these participants, the average concentration at each time point was used.
Differences in median plasma drug concentrations were assessed using Kruskal-Wallis one-way analysis of variance, Wilcoxon rank-sum test for unadjusted pairwise comparisons, and linear regressions of pooled and unpooled week 10 and 12 data for adjusted analyses. To best approximate a gaussian distribution, square-root–transformed concentrations were used for linear regression models, based on results of skewness and kurtosis tests of normality. The sample size afforded 80% power to detect a 1-fold difference (−50% to 100% change) in mean plasma drug concentrations among all subgroups with a 2-tailed α value of .05. All statistical analyses were done using Stata software (version14.0; StataCorp).
RESULTS
Study Population
Participants were predominantly male (91%), and those receiving ART tended to be older than those who were not (P < .001) (Table 1). A few were taking medications with potential for pharmacokinetic interactions, including proton pump inhibitors (PPIs) and systemic triazoles. There were no reported toxic effects related to chloroquine, including among the 5 trial participants for whom no specimen was available. Three participants had only a week 10 sample, of whom 2 were not receiving ART and 1 was on a non–PI-based, non–efavirenz-based ART regimen; and 1 participant on a PI–based regimen contributed only a week 12 sample. One participant on an efavirenz-based regimen had undetectable drug concentrations and was excluded from the primary analysis for presumed nonadherence. A sensitivity analysis including this participant in all models did not significantly influence results.
Characteristics of Study Participants
| Characteristic | No ART (n = 31) | PI-based ART (n = 9) | EFV-based ART (n = 15) | Other ARTa (n = 8) |
|---|---|---|---|---|
| Age, median (IQR), y | 39 (30–44) | 50 (46–52) | 50 (42–55) | 50 (49–56) |
| Female sex, no. (%) | 3 (10) | 1 (11) | 1 (7) | 1 (13) |
| Weight, median (IQR), kg | 80 (70–92) | 81 (69–82) | 73 (62–88) | 75 (71–89) |
| HIV viremia, no. (%)b | 31 (100) | 1 (11) | 0 (0) | 0 (0) |
| Concomitant medications, no. (%) | ||||
| Proton pump inhibitor | 4 (13) | 2 (22) | 2 (13) | 1 (13) |
| Triazole c | 2 (7) | 1 (11) | 2 (13) | 1 (13) |
| Week 10 drug concentration | ||||
| Chloroquine, median (IQR), ng/mL | 214 (139–279) | 190 (138–320) | 333 (149–360) | 219 (171–383) |
| Desethyl-chloroquine, median (IQR), ng/mL | 206 (94–332) | 136 (65–504) | 146 (73–234) | 208 (135–406) |
| Chloroquine to desethyl-chloroquine ratio | 1.04 | 1.40 | 2.28d | 1.05 |
| Week 12 drug concentration | ||||
| Chloroquine, median (IQR), ng/mL | 210 (159–290) | 222 (136–311) | 294 (160–366) | 176 (79–337) |
| Desethyl-chloroquine, median (IQR), ng/mL | 225 (72–342) | 282 (71–462) | 146 (53–320) | 170 (64–329) |
| Chloroquine to desethyl-chloroquine ratio | 0.93 | 0.79 | 2.01 | 1.04 |
Abbreviations: ART, antiretroviral therapy; EFV, efavirenz; HIV, human immunodeficiency virus; IQR, interquartile range; PI, protease inhibitor.
a“Other ART” regimens included combinations of nucleoside reverse-transcriptase inhibitors (abacavir, emtricitabine, lamivudine, tenofovir, didanosine) with nonnucleoside reverse-transcriptase inhibitors other than efavirenz (etravirine, nevirapine, rilpivirine) and/or the integrase inhibitor raltegravir.
bHIV viremia was defined as quantifiable HIV RNA at any time during the study period.
cTriazoles included fluconazole and itraconazole.
dParticipants receiving EFV-containing regimens had chloroquine concentrations more than twice those of desethyl-chloroquine (P = .049), compared with no statistically significant differences within other groups.
Effect on Chloroquine and Desethyl-chloroquine Plasma Concentrations
Between-group comparisons showed no differences in drug concentrations across any of the groups, including after adjustment for age, sex, weight, and concomitant use of a PPI or triazole in both pooled and unpooled analyses. The median week 10 plasma concentration was 227 (interquartile range, 147–352) ng/mL for chloroquine and 184 (89–333) ng/mL for desethyl-chloroquine. The respective median week 12 plasma concentrations were 235 (interquartile range, 156–317) ng/mL and 197 (71–342) ng/mL (Figure 2). The single participant receiving combined efavirenz and PI therapy had chloroquine concentrations of 252 and 317 ng/mL at weeks 10 and 12, respectively, and desethyl-chloroquine concentrations of 87 and 148 ng/mL. Among participants with high outlying plasma concentrations, 3 were on a PI-based regimen, 1 on an efavirenz-based regimen, and 2 on other ART regimens, 3 were not receiving ART, and none were taking a PPI or systemic triazole.
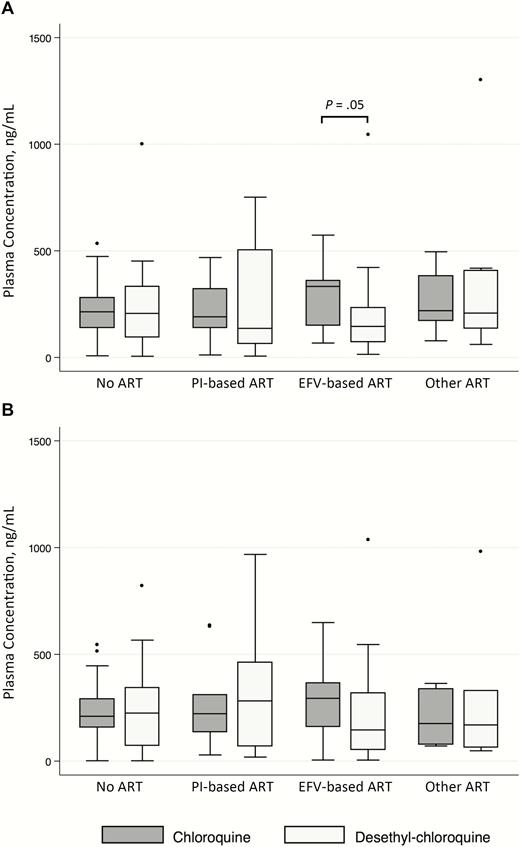
Box-and-whisker plot showing median values, upper and lower quartiles, and outliers of plasma concentrations of chloroquine and desethyl-chloroquine in adults with human immunodeficiency virus infection on or off ART regimens after 10 (panel A) and 12 (panel B) weeks of chloroquine (150 mg base daily). “Other ART” regimens included combinations of nucleoside reverse-transcriptase inhibitors (abacavir, emtricitabine, lamivudine, tenofovir, didanosine) with nonnucleoside reverse-transcriptase inhibitors other than efavirenz (etravirine, nevirapine, rilpivirine) and/or the integrase inhibitor raltegravir. Abbreviations: ART, antiretroviral therapy; EFV, efavirenz; PI, protease inhibitor.
Effect on Metabolic Conversion to Desethyl-chloroquine
Within-group comparisons of chloroquine and desethyl-chloroquine concentrations were performed to explore the possible influence of ART regimens on metabolic conversion of chloroquine. For both week 10 and pooled week 10 and 12 data, participants on efavirenz-containing regimens had chloroquine concentrations approximately twice those of desethyl-chloroquine, compared with no difference in all other groups (efavirenz-based ART, 333 vs 146 ng/mL [P = .049]; no ART, 214 vs 206 ng/mL [P = .67]; PI-based ART, 190 vs 136 ng/mL [P = .79]; other ART, 219 vs 208 ng/mL [P = .92]) (preceding P values are for unpooled week 10 data; P = .09 for efavirenz-based regimens at week 12, and P = .007 for pooled week 10 and 12 data). The difference remained significant after conditioning on age, sex, weight, and use of PPI or triazole, suggesting that efavirenz inhibits desethylation of chloroquine.
DISCUSSION
We found no significant differences in plasma concentrations of chloroquine or its metabolite, desethyl-chloroquine, among individuals receiving PI-based ART, efavirenz-based ART, or non–PI-based, non–efavirenz-based ART and those not receiving ART. Efavirenz seemed to reduce metabolic conversion of chloroquine to desethyl-chloroquine, although not to an extent that significantly influenced exposure to one or the other.
Desethylation of chloroquine is catalyzed in part by CYP 3A4 and 2C8, the former inhibited by both PIs and efavirenz and the latter by efavirenz, while relying also on nonenzymatic processes that govern drug disposition [8, 14, 15]. The observed difference in efavirenz-containing but not PI-containing regimens therefore suggests a role of other, non–CYP-mediated mechanisms, such as hepatic or renal drug transporter effects.
There were limitations to the study design. The results presented here apply only to the dose of chloroquine used in the trial, 150 mg base daily, which is between the World Health Organization recommended adult dosages for antimalarial prophylaxis (300 mg base weekly) and treatment (25 mg/kg base over 3 days) and comparable to those used to treat rheumatologic diseases (eg, 150 mg base once to twice daily). The low dose of chloroquine relative to the malaria treatment dose may have reduced the sensitivity of the study to detect changes in concentrations among groups, although the direction of change is unlikely to be affected by dose. We did not assess the pharmacokinetic impact of chloroquine on ART. Chloroquine was administered to adults with HIV infection who did not have malaria limiting generalizability to other populations. A strength of the study design was inclusion of a concurrent control group not taking ART.
To the best of our knowledge, this is the first reported study of pharmacokinetic interactions between chloroquine and ART. Coadministration of chloroquine at a dosage of 150 mg base daily with ART was well tolerated, and chloroquine disposition was not significantly impaired. Future drug-drug interaction studies using malaria treatment and prevention doses of chloroquine in HIV-infected individuals receiving ART would be further informative.
Notes
Financial support. This work was supported by the AIDS Clinical Trial Group (grant UMI AI068636), the National Institute of General Medical Sciences (grant T32-GM-066691 to M. M. I.), the Sherrilyn and Ken Fisher Center for Environmental Infectious Diseases, Division of Infectious Diseases, Johns Hopkins University School of Medicine (support to M. M. I.), and the Wellcome Trust of Great Britain (support to the Mahidol-Oxford Tropical Medicine Research Unit).
Acknowledgments. We thank the study volunteers, as well as Linda Boone and Ellyn Sherman of the AIDS Clinical Trial Group Leadership and Operations Center, Boston, Massachusetts, and Kyle Whitson and Alex Benns of the Biomedical Research Institute, Rockville, Maryland, for their logistical support. We also thank Noreen Hynes, MD, MPH, director of the Johns Hopkins University School of Medicine Travel and Tropical Medicine Clinic, for her review of and comments on the manuscript.
Potential conflicts of interest. M. M. L. has received grant support from Gilead. J. T. reports grants paid to his institution from the Wellcome Trust and the Bill & Melinda Gates Foundation. C. F. reports serving as a paid consultant for Merck, GlaxoSmithKline, ViiV Healthcare, Cipla, Janssen Pharmaceuticals, and Mylan Pharmaceuticals. All other authors report no potential conflicts of interest. All authors have submitted the ICMJE Form for Disclosure of Potential Conflicts of Interest. Conflicts that the editors consider relevant to the content of the manuscript have been disclosed.

