


Abstract
Human immunodeficiency virus type 1 (HIV-1) subtype has been shown to be associated with disease progression. We compared cognitive function between individuals infected with HIV-1 subtype G and CRF02_AG in Nigeria.
For this cross-sectional study, samples were analyzed from 146 antiretroviral-naive participants. Genotypic analysis of plasma HIV RNA was performed by nested polymerase chain reaction of protease and reverse transcriptase genes, and sequences were aligned with curated HIV-1 subtype references. Cognitive status was determined using demographically adjusted T scores and global deficit score (GDS) obtained from a comprehensive neuropsychological test battery.
A total of 76 (52.1%) participants were infected with CRF02_AG, 48 (32.8%) with subtype G, and 22 (15.1%) with other HIV-1 strains. In a multivariable linear regression adjusting for plasma HIV RNA, CD4 count, and depression score, mean global T score was lower among subtype G–infected compared with CRF02_AG-infected participants (mean difference, –3.0 [95% confidence interval {CI}, –5.2, to –.7]; P = .011). Also, T scores were significantly lower among subtype G– than CRF02_AG-infected participants for the speed of information processing, executive function, and verbal fluency ability domains. Adjusting for similar variables in a logistic regression, the odds of global cognitive impairment (GDS ≥0.5) were 2.2 times higher among subtype G compared with CRF02_AG-infected participants (odds ratio, 2.2 [95% CI, .9–5.4]; P = .078).
Cognitive performance was significantly worse among antiretroviral-naive individuals with HIV-1 subtype G vs CRF02_AG infection. Further studies are required to characterize the mechanistic basis for these differences.
Human immunodeficiency virus (HIV) infection remains a leading cause of morbidity and mortality globally despite significant strides in treatment and control efforts [1]. HIV-1 infection leads to complications that affect virtually every organ system, and without treatment, many are invariably fatal. Although the virus is not known to infect neurons, there are broad effects on the nervous system affecting the brain, spinal cord and peripheral nerves [2]. Progressive neural damage in the brain, attributable directly to the virus or the inflammatory response it induces, results in neurological syndromes collectively referred to as HIV associated neurocognitive disorders (HAND) [3]. The pathogenesis of HAND involves the interaction of viral, host, treatment, and comorbid factors, though the specific mechanisms remain unclear [4].
Advances in phylogenetic analyses of HIV sequence diversity have provided valuable insights into the origin, evolution, and transmission of HIV [5]. The HIV-1 virus is classified into 4 phylogenetic groups: M, N, O, and P [6]. Group M, which is the most widespread and almost entirely responsible for the HIV pandemic, is further divided into 9 subtypes (A–D, F–H, J, and K) as well as various sub-subtypes, circulating recombinant forms (CRFs), and several unique recombinant forms [5]. In Nigeria, CRF02_AG and G are the predominant HIV-1 subtypes reported, contributing approximately 80% of circulating strains [7, 8].
Disease progression has been shown to vary with HIV-1 subtype in a number of studies from different populations [9, 10]. There are also indications from a few studies that HIV-1 subtype may be associated with HAND occurrence and severity [11, 12]. In this report, we compared cognitive function between individuals infected with subtype G and CRF02_AG in Nigeria.
METHODS
Design
This was a cross-sectional study among a subset of participants at baseline from a prospective cohort study of HAND conducted in Abuja, Nigeria, between 2011 and 2014.
In the overall cohort, 216 HIV-infected and 114 HIV-uninfected participants were enrolled consecutively from HIV counseling and testing centers at 2 tertiary facilities, the National Hospital (NHA) and the University of Abuja Teaching Hospital (UATH), both in Abuja, Nigeria. All individuals were ≥18 years of age, able to communicate in English, and antiretroviral naive with no history of active tuberculosis, syphilis, or other infections (including hepatitis B and C). The participants also had no evidence of active central nervous system (CNS) or systemic disease, based on clinical assessment that did not include brain imaging or spinal fluid analysis. Similarly, there was no history of significant head trauma, history of or current alcohol abuse, or use of other mind-altering substances. Prospective participants were also excluded if they had previous diagnosis of a learning disability or psychiatric disorder, or other disorders associated with focal neurological deficits.
Demographic and clinical information was obtained using standardized questionnaires, a general medical assessment, and comprehensive neuropsychological testing. Written informed consent was obtained from all study participants.
Study Participants
One hundred forty-six participants with plasma HIV RNA ≥1000 copies/mL were selected for sequencing analysis and determination of the HIV-1 subtype involved. Of these, 124 participants infected with subtype G and CRF02_AG were identified for the analyses in this study. All study procedures were approved by the University of Maryland, Baltimore, NHA, and UATH institutional review boards.
Neuropsychological Assessment
A standardized neuropsychological battery was administered to all study participants. To minimize the potential impact of cultural differences on test performance, words in verbal tests unfamiliar to individuals from the region were, after appropriate pilot testing, replaced by more familiar terms. The following ability domains, with individual tests in parentheses, were examined: speed of information processing (WAIS-III Digit Symbol, WAIS-III and Symbol Search); attention/working memory (Paced Auditory Serial Addition Task, and WMS-III Spatial Span); executive functions (Stroop Color and Word Test); learning (Hopkins Verbal Learning Test–Revised [HVLT-R] total learning and the Brief Visuospatial Memory Test–Revised [BVMT-R] total learning); memory (HVLT-R delayed recall, BVMT-R delayed recall); verbal fluency (Letter [word sound] Fluency, Category Fluency: Nouns [animals], and Category Fluency: Verbs [actions]); motor speed and dexterity (Grooved Pegboard Test, Finger Tapping Test, and Timed Gait). Participants were screened for effort using the Hiscock Digit Memory Test, and for depression with the Beck Depression Inventory.
Raw test scores from the neuropsychological tests were converted to scaled scores based on the scores of the HIV-uninfected controls. Standardized T scores, with mean of 50 (standard deviation, 10) and adjusted for age, sex, and education were generated for each test. Deficit scores (DSs) ranging from 0 (no deficit) to 5 (severe deficit) were created from the T scores: T score ≥40 = DS score of 0; T score 35–39 = DS score of 1; T score 30–34 = DS score of 2; T score 25–29 = DS score of 3; T score 20–24 = DS of 4; T score <20 = DS score of 5. Domain T and DS were calculated by averaging scores of individual tests within each domain, and across all tests to generate global T and global deficit scores (GDS), respectively. A mean T score <40 (at least 1 standard deviation below the normative mean) in each domain signified impairment for that domain, whereas a GDS ≥0.5 was defined as global neurocognitive impairment [13].
Laboratory Procedures
Clinical Laboratory Testing
Whole blood was analyzed for the determination of HIV-1 serological status, measurement of plasma HIV-1 RNA (limit of detection: 20 copies/mL), and CD4+ T-cell count at the Institute of Human Virology, Nigeria-supported Training Laboratory in Asokoro District Hospital, Abuja.
Phylogenetic Analyses
Plasma HIV-1 RNA from participants with viral load ≥1000 copies/mL was sequenced at the Institute of Human Virology Nigeria laboratory, using established in-house methods developed and optimized for Nigerian isolates. To prepare the samples for molecular characterization, 500 µL of plasma was subjected to low-speed centrifugation to remove debris. The virus was then pelleted by centrifugation at 23500 × g for 1 hour. Viral RNA was extracted using the QIAamp Viral RNA Mini Assay (QIAgen, Valencia, California) and stored at –80°C. Reverse-transcription polymerase chain reaction was performed as described earlier [8]. Amplification products were sequenced with an Applied Biosystems (Foster City, California) 3130 automated sequencer, assembled using Sequencher 5.4 (Gene Codes Corporation, Ann Arbor, Michigan), and aligned with HIV-1 curated subtype references for the polymerase (pol protease–reverse transcriptase) region. Phylogenetic analysis was done using maximum-likelihood methods and tree constructed in FastTree (Figure 1) [14].
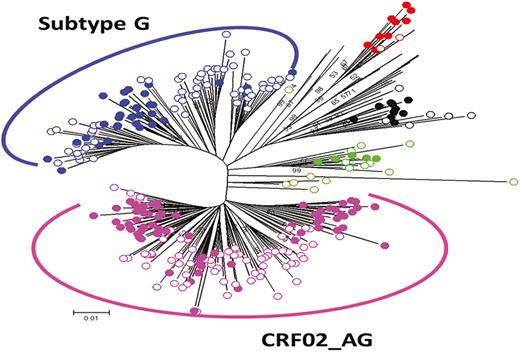
Phylogenetic tree of pol protease–reverse transcriptase sequences (N = 146). This maximum-likelihood tree was constructed in FastTree using general time reversible substitution model with gamma-distributed rate variation among sites for human immunodeficiency virus type 1 subtype determination. Reference sequences are represented as solid circles and newly derived sequences as open circles.
Statistical Analysis
Demographic and clinical characteristics were compared between participants infected with subtype G and CRF02_AG using χ2 and Wilcoxon tests. Multivariable linear regression models were fit to compare global and domain T scores between subtype G– and CRF02_AG-infected individuals, adjusting for CD4 count, plasma HIV RNA, and depression score. Similarly, multivariable logistic regression analyses were done to assess the odds of global and domain impairment comparing subtype G to CRF02_AG-infected participants, adjusting for the same variables. All statistical analyses were performed using SAS version 9.3 software (SAS Institute, Cary, North Carolina).
RESULTS
HIV-1 Subtype Distribution
Of the total 146 HIV-1–infected participants, 76 (52.1%) were infected with the circulating recombinant form CRF02_AG, 48 (32.8%) with subtype G, and 22 (15.1%) with other subtypes (CRF06_cpx [6.1%], A [2.7%], A1G [2.1%], C [2.1%], CRF43_02G [1.4%], and D [0.7%]). Participants with subtype G and CRF02_AG (N = 124) were compared for our main analyses as presented in the following results.
Demographic and Clinical Characteristics
The median age of participants was 34 years, and about two-thirds were female (Table 1). The distribution of subtype did not differ by age or sex. Individuals with subtype G had a higher median number of years of education compared to those with CRF02_AG (P = .02). Median CD4 cell count and plasma HIV RNA were 296 cells/µL and 4.7 log copies/mL, respectively, and neither differed by subtype. The median Beck Depression Inventory score was higher among subtype G as compared to CRF02_AG-infected participants (P = .03). Overall, 27.4% of the participants were cognitively impaired, with a higher proportion among subtype G (31.3%)–infected than CRF02_AG (25%)–infected patients (P = .07), consistent with higher median GDS among subtype G hosts (P = .04) (Table 1).
Demographic and Clinical Characteristics (N = 124)
| Characteristic | All | CRF02_AG | G | P Value |
|---|---|---|---|---|
| (N = 124) | (n = 76) | (n = 48) | ||
| Age, y, median (Q1, Q3) | 34 (29, 39) | 34.5 (30, 41) | 36 (33, 45) | 0.16a |
| Female sex, No. (%) | 83 (66.9) | 48 (63.2) | 35 (72.9) | 0.26b |
| Educationc, y, median (Q1, Q3) | 12 (12, 14) | 12 (12, 13) | 13 (12, 15.5) | 0.02a |
| CD4 cell count/μL, median (Q1, Q3) | 296 (210423) | 313 (207424) | 274 (210423) | 0.62a |
| Log10 plasma HIV RNA copies/mL, median (Q1, Q3) | 4.7 (4.3, 5.1) | 4.8 (4.3, 5.2) | 4.6 (4.3, 4.9) | 0.11a |
| Cognitive impairment (GDS ≥0.5), No. (%) | 34 (27.4) | 19 (25) | 15 (31.3) | 0.07b |
| Global deficit score, median (Q1, Q3) | 0.24 (0.12, 0.47) | 0.18 (0.06, 0.41) | 0.35 (0.12, 0.53) | 0.04a |
| Global T score, median (Q1, Q3) | 48.5 (45.7, 52.8) | 49.3 (46.4, 53.0) | 47.4 (44.5, 51.0) | 0.03a |
| Beck Depression Inventory score, median (Q1, Q3) | 5.5 (1, 10) | 4 (1, 8.5) | 7.5 (2, 14) | 0.03a |
Abbreviations: GDS, global deficit score; HIV, human immunodeficiency virus; Q1, 25th percentile; Q3, 75th percentile.
Wilcoxon test.
χ2 test.
Approximately 12 years of education, equivalent to high school graduate.
Comparisons of Global and Domain-Specific Cognitive Scores Between Subtype G– and CRF02_AG-Infected Individuals
In a multivariable linear regression adjusting for plasma HIV RNA, CD4 count, and depression score, global T score was lower among subtype G–infected participants as compared to those with CRF02_AG (mean difference, –3.0 [95% confidence interval {CI}, –5.2 to –.7]; P = .011). Also, T scores were significantly lower among subtype G–infected compared with CRF02_AG-infected participants for the speed of information processing, executive function, and verbal fluency cognitive domains (P = .002, .001, and .018, respectively). No statistically significant differences were found for the other ability domains, though all showed similar trend for differences between the 2 subtypes (Table 2).
Linear Regression Comparing Global and Domain Scores Between Human Immunodeficiency Virus Type 1 Subtype G and CRF02_AG
| Domain | Univariable | Multivariablea | |||||
|---|---|---|---|---|---|---|---|
| No. | β | (95% CI) | P Value | β | (95% CI) | P Value | |
| Global T score | 124 | –2.3 | (–4.3 to –.3) | .027 | –3.0 | (–5.2 to –.7) | .011 |
| Speed of information processing | 124 | –4.4 | (–7.7 to –1.1) | .009 | –5.8 | (–9.3 to –2.2) | .002 |
| Attention/working memory | 124 | –.5 | (–3.6 to 2.7) | .764 | –1.0 | (–4.5 to 2.5) | .563 |
| Executive function | 124 | –5.4 | (–8.9 to –1.9) | .003 | –6.3 | (–10.1 to –2.5) | .001 |
| Learning | 124 | –1.2 | (–4.1 to 1.7) | .405 | –1.1 | (–4.3 to 2.0) | .480 |
| Memory | 124 | –2.3 | (–5.7 to 1.0) | .164 | –3.0 | (–6.7 to .8) | .121 |
| Verbal fluency | 124 | –2.9 | (–6.3 to .4) | .081 | –4.5 | (–8.2 to –.8) | .018 |
| Motor speed/dexterity | 124 | –1.1 | (–3.6 to 1.3) | .372 | –1.4 | (–4.1 to 1.3) | .303 |
Abbreviations: β, mean difference (subtype G vs CRF02_AG); CI, confidence interval.
Adjusted for plasma human immunodeficiency virus RNA, CD4 count, and Beck Depression Inventory score.
Comparisons of Global and Domain-Specific Cognitive Impairment between Subtype G– and CRF02_AG-Infected Individuals
In a multivariable logistic regression, adjusting for the same variables (as above), the odds of global neurocognitive impairment were higher among subtype G as compared to CRF02_AG-infected participants, but at a marginal significance (odds ratio [OR], 2.2 [95% CI, .9–5.4]; P = .078). The odds of impairment for the executive function and memory domains were higher among subtype G–infected individuals, though with only a moderate trend for the latter (OR, 2.6 [95% CI, 1.1–6.3]; P = .031 and 2.4 [95% CI, .9–6.0]; P = .067, respectively). This pattern was also seen for the speed of information processing, learning, and motor domains, whereas a reverse pattern was observed for attention and verbal fluency domains, but none of these were statistically significant (Table 3).
Logistic Regression for Global and Domain Impairment Comparing Human Immunodeficiency Virus Type 1 Subtype G and CRF02_AG
| Domain | Univariable | Multivariablea | |||||
|---|---|---|---|---|---|---|---|
| No. | OR | (95% CI) | P Value | OR | (95% CI) | P Value | |
| Global impairment (GDS ≥0.5) | 124 | 2.2 | (.9–5.2) | .07 | 2.2 | (.9–5.4) | .078 |
| Speed of information processing | 124 | 1.4 | (.5–3.6) | .529 | 1.5 | (.5–4.2) | .487 |
| Attention/working memory | 124 | 0.5 | (.2–1.8) | .313 | 0.5 | (.1–1.6) | .221 |
| Executive function | 124 | 2.4 | (1.1–5.6) | .036 | 2.6 | (1.1–6.3) | .031 |
| Learning | 124 | 1.2 | (.4–3.2) | .741 | 1.1 | (.4–3.2) | .874 |
| Memory | 124 | 2.4 | (1.0–5.9) | .051 | 2.4 | (.9–6.0) | .067 |
| Verbal fluency | 124 | 0.5 | (.2–1.5) | .234 | 0.5 | (.2–1.6) | .235 |
| Motor speed/dexterity | 124 | 1.3 | (.3–5.1) | .714 | 1.3 | (.3–5.4) | .754 |
Abbreviations: CI, confidence interval; GDS, global deficit score; OR, odds ratio.
Adjusted for plasma human immunodeficiency virus RNA, CD4 count, and Beck Depression Inventory score.
DISCUSSION
In this study, we found evidence of a significantly worse cognitive performance among antiretroviral-naive individuals infected with HIV-1 subtype G as compared to those with CRF02_AG infection. We also showed corresponding evidence, though marginal, for a greater likelihood of neurocognitive impairment among subtype G compared with the CRF02_AG-infected patients. This finding is further evidence of phenotypic variability between HIV-1 subtypes and, in this regard, an indication of likely differences in their neuropathogenic potential.
To our knowledge, this is the first demonstration of differences in effects on cognitive function for the 2 predominant HIV-1 subtypes (CRF02_AG and G) in Nigeria and West Africa, a region bordering the epicenter of the HIV epidemic [15]. This finding is particularly significant, given the fact that our study participants have relatively less advanced HIV disease and HAND profile than that reported for other cohorts [16].
Reports from other regions also provide evidence for possible differential effects of HIV-1 subtypes on HAND pathogenesis. In a sample of 60 treatment-naive participants with advanced HIV disease from Uganda, Sacktor et al [11] showed a significantly higher proportion of patients with dementia among HIV-1 subtype D–infected patients compared to those with HIV-1 subtype A infection. This is consistent with multiple reports demonstrating greater systemic disease progression among subtype D– than subtype A–infected patients [9, 17]. Similarly, in vitro and animal studies have shown a relatively lower potential for direct neurotoxicity and induction of inflammatory response for the predominant subtype C in India compared with subtype B virus. The India clade C has a Cys31Ser polymorphism, which disrupts a di-cysteine motif in tat [18], potentially providing a mechanistic basis for the observed lower prevalence of HAND in some areas where this clade predominates [12].
The CRF02_AG genome is a mosaic of subtype A (gag and vpr and parts of pol, env, and nef) and subtype G (LTR, rev, tat, and parts of pol, env, and nef) [19]. CRF02_AG has higher in vitro replicative fitness compared with its progenitor subtypes A and G, a characteristic postulated to account for its predominance in West Africa, likely resulting from higher viral load and transmission capability [19, 20]. Our results showing higher likelihood of cognitive dysfunction in subtype G as compared to CRF02_AG hosts may suggest either minimal or no effect of replicative fitness on HAND pathogenesis. Conversely, such higher replication capacity may have negative effects on the establishment of latent reservoirs that are postulated to play a significant role in the neuropathogenesis of HAND [21]. High viral replication may be associated with higher cytopathic effects, resulting in a diminished pool of replication-competent cells capable of reverting to a latent reservoir state to perpetuate the cycle of infection [22].
Beyond differences in replication capacity, subtype G was shown to have a higher infectivity rate for a human osteosarcoma cell line expressing CD4 and CCR5 compared with CRF02_AG or subtype A [23]. This finding may potentially apply to other cells expressing these receptors, including monocytes and lymphocytes. Higher infectivity for mononuclear cells (MCs) is a plausible mechanism for our findings, as MCs are the main avenue for viral entry into the CNS [24]. We recently reported that neurocognitive impairment in our cohort was associated with levels of HIV DNA within lymphocytes [25]. Thus, subtype G may have neurotropic advantage over CRF02_AG, possibly through a higher intrinsic capacity to infect the cellular vehicles involved in viral trafficking to the CNS. While differences in replicative fitness may be a manifestation of variability in the relatively conserved pol gene sequences, differences in infectivity may be related to variation in the more variable env gene sequences. The hypervariable “V3” part of the env region is important in HIV-1 pathogenesis, including immune response and infectivity, as well as determination of syncytium phenotype known to be related to disease progression [26–28]. However, further studies are needed to determine which parts of the viral genome are involved and specific changes in sequence responsible for the observed phenotypic differences.
A recent in vitro study found evidence of minimal effects of CRF02_AG tat on human brain microvascular endothelial cells, a major component of the blood–brain barrier, compared to subtype B tat, which induced significantly greater upregulation of proinflammatory mediators [29]. Although the comparison was not with subtype G, this may still indicate a relatively lower proinflammatory activity for CRF02_AG tat, which may be associated with decreased neurovirulence potential. We compared plasma levels of monocyte activation markers (soluble CD14, soluble CD163, monocyte chemoattractant protein 1) between subtype G– and CRF02_AG-infected individuals but found no statistically significant differences (data not shown). Nonetheless, studies comparing CRF02_AG and G strains with regard to differences in tat sequences and activity are needed.
Another possible explanation for our findings may relate to the reported differences in viral tropism between subtypes G and CRF02_AG. A study from north-central Nigeria, where the current study was conducted, showed significantly higher CXCR4 (X4) co-receptor usage for subtype G compared with CRF02_AG isolates [30]. X4 co-receptor usage corresponds to a syncytium-inducing characteristic known to correlate with HIV disease progression, and a shift from CCR5 (R5) to dual R5X4 or X4 co-receptor use has been observed in advanced stages of HIV infection [31, 32]. The frequency of X4-using strains among subtype C–infected individuals was also reported to be lower than for subtype B. Similarly, X4 use was demonstrated to be higher for subtype D as compared to subtype A–infected individuals, possibly indicating an earlier switch to X4 in the more virulent subtype D strains [33, 34]. These patterns of co-receptor tropism appear to correspond with observed differences between these subtypes regarding disease progression and HAND burden [11, 12]. Hence, it is plausible that higher X4 tropism may correlate with greater risk for HAND. While neurons do not possess CD4+ receptors to support productive infection by HIV, they do express CXCR4, which can bind to X4 tropic gp120 and, as a result, undergo apoptosis [35–37]. Studies are required to confirm whether such effects are more likely to result from infection with subtype G, which has greater X4 tropism than CRF02_AG.
Our results indicate that the global associations found in this study are driven mainly by associations within 3 cognitive domains: speed of information processing, executive function, and memory function. Deficits in these domains are consistent with the predominant subcortical pattern of cognitive dysfunction seen in HIV, attributed largely to lesions affecting frontostriatal circuits [38, 39]. This consistency provides some empirical evidence in support of our findings.
This study has some limitations. Participants were required to be able to communicate in English, the language used for the administration of the neuropsychological tests. This excludes a significant segment of the population in the study setting, where English literacy is around 60% [40], thereby potentially limiting the generalizability of findings. Similarly, participants with plasma HIV RNA <1000 copies/mL were excluded to ensure optimal viral amplification and accuracy of phylogenetic analyses. If the subtype associations among those excluded differ from those included, then the study may be subject to some selection bias. In an exploratory analysis, we found no significant differences between the participants and those excluded regarding the distribution of impairment status, as well as for key demographic and immunovirologic characteristics (data not shown). Another limitation is our use of a single gene region (pol) for subtype determination, which may be associated with potential misclassification, especially for new recombinant forms. However, this was unlikely to have affected the strains compared in this study, given the subtype distribution pattern observed, which is consistent with earlier reports [6]. Lack of imaging studies for our participants is a further limitation, as occult CNS conditions undetectable by clinical neurological examination may confound our findings.
There are notable strengths to this study. We excluded prospective participants with other medical conditions known to be associated with cognitive impairment, thereby enabling an unconfounded assessment of HAND. Furthermore, the study utilized a comprehensive neuropsychological test battery for the assessment of cognitive function and identified the cognitive domains largely affected, thereby providing leads for further studies to explore in depth the neuropathogenic processes involved.
CONCLUSIONS
This study found a significantly higher level of impaired cognitive function among treatment-naive individuals infected with HIV-1 subtype G as compared to CRF02_AG in Nigeria. The findings were largely driven by deficits in executive function, memory, and speed of information processing cognitive domains. This provides support to the emerging evidence indicating that HIV-1 subtypes likely differ in their neuropathogenic potential. Further studies are required to characterize the mechanistic basis for the observed differences.
Notes
Financial support. This work was supported by the National Institutes of Health (grant number R01 MH086356 to W. A. B. and W. R.) and by the National Institutes of Health Fogarty/AIDS International Training and Research Program (grant number 2D43TW001041-14; training support to J. J.).
Potential conflicts of interest. All authors: No reported conflicts of interest. All authors have submitted the ICMJE Form for Disclosure of Potential Conflicts of Interest. Conflicts that the editors consider relevant to the content of the manuscript have been disclosed.

