


Abstract
We previously reported that vaccination with the tetravalent dengue vaccine (CYD-TDV; Dengvaxia) may bias the diagnosis of dengue based on immunoglobulin M (IgM) and immunoglobulin G (IgG) assessments.
We undertook a post hoc pooled analysis of febrile episodes that occurred during the active surveillance phase (the 25 months after the first study injection) of 2 pivotal phase III, placebo-controlled CYD-TDV efficacy studies that involved ≥31000 children aged 2–16 years across 10 countries in Asia and Latin America. Virologically confirmed dengue (VCD) episode was defined with a positive test for dengue nonstructural protein 1 antigen or dengue polymerase chain reaction. Probable dengue episode was serologically defined as (1) IgM-positive acute- or convalescent-phase sample, or (2) IgG-positive acute-phase sample and ≥4-fold IgG increase between acute- and convalescent-phase samples.
There were 1284 VCD episodes (575 and 709 in the CYD-TDV and placebo groups, respectively) and 17673 other febrile episodes (11668 and 6005, respectively). Compared with VCD, the sensitivity and specificity of probable dengue definition were 93.1% and 77.2%, respectively. Overall positive and negative predictive values were 22.9% and 99.5%, respectively, reflecting the much lower probability of correctly confirming probable dengue in a population including a vaccinated cohort. Vaccination-induced bias toward false-positive diagnosis was more pronounced among individuals seronegative at baseline.
Caution will be required when interpreting IgM and IgG data obtained during routine surveillance in those vaccinated with CYD-TDV. There is an urgent need for new practical, dengue-specific diagnostic algorithms now that CYD-TDV is approved in a number of dengue-endemic countries.
NCT01373281 and NCT01374516.
(See the and the .)
Serological assays detecting anti-dengue immunoglobulin M (IgM) or immunoglobulin G (IgG) antibodies, with or without dengue nonstructural protein 1 (NS1) antigen detection, are widely used for dengue diagnosis, seroprevalence analysis, and disease surveillance, as such tests are user friendly and affordable. However, the utility of these serological assays may be confounded by dengue vaccination as IgG and IgM levels may reflect vaccine-induced responses [1]. Reliance on these serological assessments among recipients of a live, attenuated, tetravalent dengue vaccine (CYD-TDV; Dengvaxia) would lead to a significant number of false positives (17% for probable dengue defined as (1) IgM-positive acute or convalescent sample or (2) IgG-positive acute sample and ≥4-fold rise in IgG), particularly within the first 2 months after vaccination [2]. As such, serological assessment of dengue during routine clinical practice and surveillance should be interpreted with caution following the introduction of the vaccine. However, the robustness or generalizability of the observation was limited as the sample assessed was from a single epidemiological setting and contained a limited number of symptomatic dengue serotype 3 and 4 infections [3]. In addition, the data did not allow for a robust evaluation of potential covariates.
Here we assessed the impact of dengue vaccination on the serological diagnosis of dengue in larger and more diverse epidemiological settings of 2 phase III CYD-TDV efficacy studies [4], which involved ≥31000 children aged 2–16 years across 10 countries and 33 cities in Asia and Latin America [5, 6]. This large sample, with data for all 4 serotypes, allowed us to explore the impact of previous dengue exposure and other potential covariates on the serological diagnosis of dengue.
METHODS
Study Design and Participants
The 2 phase III CYD-TDV studies have been published [5, 6]; these had similar designs and were undertaken in 5 Asia-Pacific countries (CYD14; NCT01373281) and 5 Latin American countries (CYD15; NCT01374516). Healthy children aged 2–14 years in CYD14 and 9–16 years in CYD15 were randomly assigned 2:1 to receive CYD-TDV or placebo. A subgroup in each study (n = 2000) was assigned for additional immunogenicity assessment including 1 at baseline (immunogenicity subset). The vaccine or placebo was given subcutaneously at months 0, 6 (±15 days), and 12 (±30 days).
Sample Collection and Laboratory Analyses
Active surveillance of participants started on the day of the first injection and lasted until month 25. Parents, guardians, and the children were reminded during weekly contacts to visit the trial or healthcare center at any time in case of acute febrile illness (temperature ≥38°C on ≥2 consecutive days). In addition to laboratory tests undertaken according to local standards of care, 2 blood samples were taken: an acute-phase sample within 5 days of fever onset and a convalescent-phase sample 7–14 days later.
Acute-phase samples were tested for NS1 antigen (Platelia Bio-Rad Laboratories, Marnes-La-Coquette, France), with a dengue screen quantitative reverse-transcription polymerase chain reaction (PCR) assay, and a serotype-specific PCR assay (SimplexaDengue Kit, Focus Diagnostics, California) [7]. Both acute and convalescent samples were tested for dengue IgM and IgG with the commercially available anti-dengue IgM (EL1500M, DxSelect Kit) and IgG (EL1500G, DxSelect Kit) capture enzyme-linked immunosorbent assay (ELISA) kits. Participants were considered positive if the index value was >1.0.
In the immunogenicity subset, dengue neutralizing antibody concentrations were measured with the plaque reduction neutralization test (PRNT50) at baseline and 28 days after the second and third vaccine dose. Japanese encephalitis (JE) and yellow fever (YF) neutralizing antibodies were also measured at baseline in studies undertaken in Asia and Latin America, respectively. All dengue-related assays were done under masked conditions at the study sponsor’s Global Clinical Immunology laboratories (Swiftwater, Pennsylvania) or the Centre for Vaccine Development at Mahidol University (Bangkok, Thailand).
Dengue Cases
Febrile episodes were classified as VCD if dengue NS1 antigen and/or amplified dengue genomic sequences were detected in the acute sample. In the context of a dengue vaccine trial, dengue diagnosis based solely on antibody serological analysis is recognized to be presumptive, not definitive [8]. We took a conservative approach and defined probable dengue infection as either (1) IgM-positive acute- or convalescent-phase samples, or (2) IgG-positive acute-phase sample and a ≥4-fold IgG increase between acute- and convalescent-phase samples, to be consistent with current World Health Organization guidelines [9].
Statistical Analyses
We pooled the participant-level data after assessing the comparability of the results between studies. Descriptive analyses were undertaken (performed with SAS version 9.2 software) on all febrile episodes in the overall population and immunogenicity subset. Anti-dengue IgM and IgG levels from acute and convalescent samples were used to derive the proportion of participants meeting the criteria for “probable dengue” among those with VCD or other febrile episodes without virological evidence of dengue (ie, negative NS1 antigen and dengue screen PCR result). Among the immunogenicity subset, descriptive analyses of IgM and IgG index values among VCD and other febrile episodes were undertaken according to participants baseline dengue serostatus (seropositive defined as ≥10 1/dilution (dil) for at least 1 serotype and seronegative defined as <10 1/dil for any serotype).
Descriptive analyses of IgM and IgG levels, according to treatment group, VCD or other febrile episode classification, and by additional covariates were performed. The additional covariates explored included number of injections received before febrile episode, time since last vaccination, delay between fever onset and acute sample collection date, participant age, number of days of fever, the need for hospitalization, dengue baseline status, and JE or YF baseline status. The profile of the ratios of the IgM/IgG mean index values was assessed for participants in the immunogenicity subset.
RESULTS
Febrile Episodes
There were 18957 febrile episodes experienced by 10272 participants: 6848 CYD-TDV and 3424 placebo recipients (Table 1) [5, 6]. Acute blood samples were obtained for 17765 (93.7%) episodes, and convalescent samples for 18489 (97.5%) episodes. There were 1284 VCD episodes and 17673 other febrile episodes. Twenty-eight episodes without an acute serum sample for virological testing were included with other febrile episodes. In the immunogenicity subset, there were 145 VCD episodes and 2646 other febrile episodes.
Serology Profiles of Virologically Confirmed Dengue Cases and Other Febrile Episodes Without Virological Evidence of Dengue
| Virologically Confirmed Dengue Episodes | Febrile Episodes Without Virological Evidence of Dengue | |||||||||||
|---|---|---|---|---|---|---|---|---|---|---|---|---|
| Serology | CYD-TDV Group | Control Group | Total | CYD-TDV Group | Control Group | Total | ||||||
| Febrile illness in all participants | 575 | (100) | 709 | (100) | 1284 | (100) | 11 668 | (100) | 6005 | (100) | 17 673 | (100) |
| IgM acute >1 | 264 | (45.9) | 234 | (33.0) | 498 | (38.8) | 2466 | (21.1) | 843 | (14.0) | 3309 | (18.7) |
| IgM convalescent >1 | 532 | (92.5) | 648 | (91.4) | 1180 | (91.9) | 2337 | (20.0) | 809 | (13.5) | 3146 | (17.8) |
| IgM acute or convalescent >1 | 538 | (93.6) | 656 | (92.5) | 1194 | (93.0) | 2959 | (25.4) | 1062 | (17.7) | 4021 | (22.8) |
| IgG acute >1 | 521 | (90.6) | 507 | (71.5) | 1028 | (80.1) | 10 739 | (92.0) | 4191 | (69.8) | 14 930 | (84.5) |
| IgG 4-fold | 79 | (13.7) | 183 | (25.8) | 262 | (20.4) | 67 | (0.6) | 94 | (1.6) | 161 | (0.9) |
| IgG 4-fold and acute >1 | 29 | (5.0) | 19 | (2.7) | 48 | (3.7) | 7 | (0.1) | 0 | (0) | 7 | (0.0) |
| IgG convalescent >1 | 564 | (98.1) | 656 | (92.5) | 1220 | (95.0) | 10 734 | (92.0) | 4177 | (69.6) | 14 911 | (84.4) |
| IgG acute or convalescent >1 | 568 | (98.8) | 662 | (93.4) | 1230 | (95.8) | 10 894 | (93.4) | 4265 | (71.0) | 15 159 | (85.8) |
| Probablea | 539 | (93.7) | 657 | (92.7) | 1196 | (93.1) | 2962 | (25.4) | 1062 | (17.7) | 4024 | (22.8) |
| Febrile illness in participants seropositive at baselineb | 26 | (100) | 59 | (100) | 85 | (100) | 1196 | (100) | 629 | (100) | 1825 | (100) |
| IgM acute >1 | 10 | (38.5) | 21 | (35.6) | 31 | (36.5) | 189 | (15.8) | 105 | (16.7) | 294 | (16.1) |
| IgM convalescent >1 | 25 | (96.2) | 55 | (93.2) | 80 | (94.1) | 194 | (16.2) | 101 | (16.1) | 295 | (16.2) |
| IgM acute or convalescent >1 | 25 | (96.2) | 55 | (93.2) | 80 | (94.1) | 258 | (21.6) | 133 | (21.1) | 391 | (21.4) |
| IgG acute >1 | 25 | (96.2) | 54 | (91.5) | 79 | (92.9) | 1146 | (95.8) | 552 | (87.8) | 1698 | (93.0) |
| IgG 4-fold | 2 | (7.7) | 6 | (10.2) | 8 | (9.4) | 4 | (0.3) | 2 | (0.3) | 6 | (0.3) |
| IgG 4-fold and acute >1 | 1 | (3.8) | 1 | (1.7) | 2 | (2.4) | 0 | (0) | 0 | (0) | 0 | (0) |
| IgG convalescent >1 | 26 | (100) | 58 | (98.3) | 84 | (98.8) | 1141 | (95.4) | 550 | (87.4) | 1691 | (92.7) |
| IgG acute or convalescent >1 | 26 | (100) | 59 | (100) | 85 | (100) | 1156 | (96.7) | 556 | (88.4) | 1712 | (93.8) |
| Probablea | 25 | (96.2) | 55 | (93.2) | 80 | (94.1) | 258 | (21.6) | 133 | (21.1) | 391 | (21.4) |
| Febrile illness in participants seronegative at baselineb | 33 | (100) | 27 | (100) | 60 | (100) | 521 | (100) | 300 | (100) | 821 | (100) |
| IgM acute >1 | 14 | (42.4) | 9 | (33.3) | 23 | (38.3) | 145 | (27.8) | 35 | (11.7) | 180 | (21.9) |
| IgM convalescent >1 | 33 | (100) | 25 | (92.6) | 58 | (96.7) | 143 | (27.4) | 29 | (9.7) | 172 | (21.0) |
| IgM acute or convalescent >1 | 33 | (100) | 26 | (96.3) | 59 | (98.3) | 172 | (33.0) | 44 | (14.7) | 216 | (26.3) |
| IgG acute >1 | 29 | (87.9) | 7 | (25.9) | 36 | (60.0) | 390 | (74.9) | 36 | (12.0) | 426 | (51.9) |
| IgG 4-fold | 5 | (15.2) | 17 | (63.0) | 22 | (36.7) | 4 | (0.8) | 10 | (3.3) | 14 | (1.7) |
| IgG 4-fold and acute >1 | 1 | (3.0) | 1 | (3.7) | 2 | (3.3) | 1 | (0.2) | 0 | (0) | 1 | (0.1) |
| IgG convalescent >1 | 33 | (100) | 23 | (85.2) | 56 | (93.3) | 392 | (75.2) | 31 | (10.3) | 423 | (51.5) |
| IgG acute or convalescent >1 | 33 | (100) | 24 | (88.9) | 57 | (95.0) | 402 | (77.2) | 40 | (13.3) | 442 | (53.8) |
| Probablea | 33 | (100) | 26 | (96.3) | 59 | (98.3) | 172 | (33.0) | 44 | (14.7) | 216 | (26.3) |
Data are presented as No. (%).
Abbreviations: IgG, immunoglobulin G; IgM, immunoglobulin M.
aProbable episodes defined as (1) IgM-positive acute or convalescent sample or (2) IgG-positive acute sample and at least a 4-fold rise in IgG between acute to convalescent samples.
bImmunogenicity subset.
Serological Profile of Virologically Confirmed Dengue Episodes
Among VCD episodes, there was a higher proportion of IgM-positive acute samples (264; 45.9% [95% confidence interval {CI}, 41.8%–50.1%] vs 234; 33.0% [95% CI, 29.6%–36.6%]) and a lower proportion of 4-fold IgG titer increases (79; 13.7% [95% CI, 11.0%–16.8%] vs 183; 25.8% [95% CI, 22.6%–29.2%]) in the CYD-TDV group than the control group. Overall, 1196 (93.1% [95% CI, 91.6%–94.5%]) VCD episodes fulfilled the serological criteria of probable dengue, with no difference between the CYD-TDV and control groups (539; 93.7% [95% CI, 91.4%–95.6%] and 657; 92.7% [95% CI, 90.5%–94.5%]).
Serological Profile of Other Febrile Episodes Without Virological Evidence of Dengue
Most other febrile episodes had IgG-positive acute sera (14930; 84.5% [95% CI, 83.9%–85.0%]) (Table 1), and there was a higher proportion in the CYD-TDV group (10739; 92.0% [95% CI, 91.5%–92.5%]) than in the control group (4191; 69.8% [95% CI, 68.6%–71.0%]). Overall, 4024 (22.8% [95% CI, 22.2%–23.4%]) of these cases met the probable dengue criteria, with a higher proportion observed in the CYD-TDV group (2962; 25.4% [95% CI, 24.6%–26.2%]) than the control group (1062; 17.7% [95% CI, 16.7%–18.7%]).
Immunogenicity Subset
Seropositive Participants
In baseline dengue-seropositive participants (Table 1), there was no difference between the CYD-TDV and control groups in the proportion of IgM (acute or convalescent) positive samples among VCD (96.2% [95% CI, 80.4%–99.9%] and 93.2% [95% CI, 83.5%–98.1%], respectively) or other febrile episodes (21.6% [95% CI, 19.3%–24.0%] and 21.1% [95% CI, 18.0%–24.6%]) (Figure 1). Similarly, among VCD episodes, there was no difference between the 2 study groups in the proportion of acute IgG-positive samples (96.2% [95% CI, 80.4%–99.9%] and 91.5% [95% CI, 81.3%–97.2%]). However, among other febrile episodes, the proportion of acute IgG-positive samples was higher in the CYD-TDV group (95.8% [95% CI, 94.5%–96.9%]) than the control group (87.8% [95% CI, 84.9%–90.2%]) (Figure 1). Overall, 80 (94.1% [95% CI, 86.8%–98.1%]) VCD and 391 (21.4% [95% CI, 19.6%–23.4%]) other febrile episodes met the probable dengue criteria, with no difference between the 2 study groups.
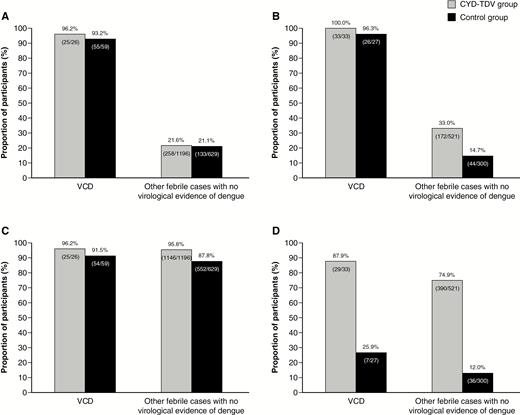
Proportion of immunoglobulin M–positive (acute or convalescent) participants in virologically confirmed dengue (VCD) cases and other febrile cases without virological evidence of dengue according to baseline dengue serostatus, seropositive/immune (A) or seronegative/nonimmune (B) at baseline, and proportion of acute immunoglobulin G–positive participants according to baseline dengue serostatus, seropositive/immune (C) and seronegative/nonimmune (D) at baseline. VCD episodes were defined with a positive test for dengue nonstructural protein 1 (NS1) antigen or dengue polymerase chain reaction. Baseline dengue serostatus was defined by plaque reduction neutralization test (PRNT50); seropositive was defined as a titer ≥10 1/dil for at least 1 serotype and seronegative as a titer <10 1/dil for any serotype.
VCD episodes had a significant increase in relative IgM and IgG levels between acute and convalescent samples regardless of whether the participants were vaccinated or not (Figure 2). Although no such increases were observed with other febrile episodes, those in the CYD-TDV group had higher acute IgG levels. In addition, participants in the CYD-TDV group had higher convalescent IgM levels than those in the placebo group, but the 2 groups had similar convalescent IgG levels.
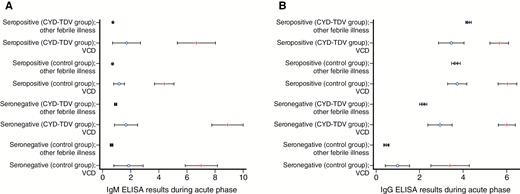
Change in relative immunoglobulin M (A) and immunoglobulin G (B) levels between acute (blue circle) and convalescent (red line) samples in virologically confirmed dengue (VCD) episodes and other febrile episodes without virological evidence of dengue, according to the dengue baseline serostatus (immune or nonimmune) and the treatment received (CYD-TDV or placebo control). VCD episodes were defined with a positive test for dengue nonstructural protein 1 (NS1) antigen or dengue polymerase chain reaction. Abbreviations: ELISA, enzyme-linked immunosorbent assay; IgG, immunoglobulin G; IgM, immunoglobulin M; VCD, virologically confirmed dengue.
Seronegative Participants
In baseline dengue-seronegative participants (Table 1), among VCD episodes, the proportion of IgM-positive (acute or convalescent) samples in the CYD-TDV and placebo groups were similar (100% [95% CI, 89.4%–100.0%] vs 96.3% [95% CI, 81.0%–99.9%]) (Figure 1). However, among other febrile episodes, there was a 2.2-fold higher proportion of IgM-positive samples in the CYD-TDV group than the control group (33.0% [95% CI, 29.0%–37.2%] vs 14.7% [95% CI, 10.9%–19.2%]). The proportion of acute IgG-positive samples was 3.4-fold higher in the CYD-TDV group among participants with VCD (87.9% [95% CI, 71.8%–96.6%] vs 25.9% [95% CI, 11.1%–46.3%]), and 6.2-fold higher among other febrile episodes (74.9% [95% CI, 70.9%–78.5%] vs 12.0% [95% CI, 8.6%–16.2%]). Nearly all the VCD episodes (59; 98.3% [95% CI, 91.1%–100%]) and about a quarter of other febrile episodes (216; 26.3% [95% CI, 23.3%–29.5%]) met the probable dengue criteria. The proportion of episodes that met the probable dengue criteria among other febrile episodes was 2.2-fold higher in the CYD-TDV group.
VCD episodes among seronegative participants had a significant increase in relative IgM and IgG levels between acute and convalescent samples regardless of whether the participants were vaccinated or not (Figure 2). No such increase was observed with other febrile episodes; however, those in the CYD-TDV group had markedly higher acute IgG levels. Participants in the CYD-TDV group had higher convalescent IgG levels than those in the control group, and there was also a trend toward higher convalescent IgM levels in the CYD-TDV group.
Sensitivity, Specificity, Positive Predictive Value, and Negative Predictive Value
The sensitivity, specificity, positive predictive value (PPV), and negative predictive value (NPV) of the IgM and IgG serological profiles compared to virological confirmation are summarized in Table 2. The identification of probable dengue had 93.1% sensitivity and 77.2% specificity. The probable dengue criteria would lead to a high number of false positives among CYD-TDV recipients, as shown by the low PPV (22.9%) and a high NPV (99.5%).
Sensitivity, Specificity, Positive Predictive Value, and Negative Predictive Value of Immunoglobulin M and Immunoglobulin G Serological Profiles Compared to Virologically Confirmed Dengue
| Serology | CYD-TDV Group | Control Group | Total | |||||||||
|---|---|---|---|---|---|---|---|---|---|---|---|---|
| Sensitivity | Specificity | PPV | NPV | Sensitivity | Specificity | PPV | NPV | Sensitivity | Specificity | PPV | NPV | |
| Febrile illness in all participants | ||||||||||||
| IgM acute or convalescent >1 | 93.6% | 74.6% | 15.4% | 99.6% | 92.5% | 82.3% | 38.2% | 98.9% | 93.0% | 77.2% | 22.9% | 98.2% |
| IgG acute or convalescent >1 | 98.8% | 6.6% | 5.0% | 99.1% | 93.4% | 29.0% | 13.4% | 97.4% | 95.8% | 14.2% | 7.5% | 66.2% |
| Probablea | 93.7% | 74.6% | 15.4% | 99.6% | 92.7% | 82.3% | 38.2% | 99.0% | 93.1% | 77.2% | 22.9% | 99.5% |
| Febrile illness in participants seropositive at baseline | ||||||||||||
| IgM acute or convalescent >1 | 96.2% | 78.4% | 8.8% | 99.9% | 93.2% | 78.9% | 29.3% | 99.2% | 94.1% | 78.6% | 17.0% | 99.7% |
| IgG acute or convalescent >1 | 100.0% | 3.3% | 2.2% | 100.0% | 100.0% | 11.6% | 9.6% | 100.0% | 100.0% | 6.2% | 4.7% | 100.0% |
| Probablea | 96.2% | 78.4% | 8.8% | 99.9% | 93.2% | 78.9% | 29.3% | 99.2% | 94.1% | 78.6% | 17.0% | 99.7% |
| Febrile illness in participants seronegative at baseline | ||||||||||||
| IgM acute or convalescent >1 | 100.0% | 67.0% | 16.1% | 100.0% | 96.3% | 85.3% | 37.1% | 99.6% | 98.3% | 73.7% | 21.5% | 99.8% |
| IgG acute or convalescent >1 | 100.0% | 22.8% | 7.6% | 100.0% | 88.9% | 86.7% | 37.5% | 98.9% | 95.0% | 46.2% | 11.4% | 99.2% |
| Probablea | 100.0% | 67.0% | 16.1% | 100.0% | 96.3% | 85.3% | 37.1% | 99.6% | 98.3% | 73.7% | 21.5% | 99.8% |
Abbreviations: IgG, immunoglobulin G; IgM, immunoglobulin M; NPV, negative predictive value; PPV, positive predictive value.
aProbable episodes defined as (1) IgM-positive acute or convalescent sample or (2) IgG-positive acute sample and at least a 4-fold rise in IgG between acute to convalescent samples.
Covariate Analysis
No additional parameters had an influence on the bias, possibly due to the CYD-TDV, observed in IgM/IgG responses according to participants’ baseline serostatus in VCD and in other febrile episodes.
Immunoglobulin M/Immunoglobulin G (Convalescent) Ratios
VCD episodes among seronegative participants had potentially higher IgM/IgG ratios than in those who were seropositive, regardless of the treatment group (Figure 3). In addition, IgM/IgG ratios for VCD episodes were generally higher than with other febrile episodes (Figures 3 and 4). Of note, the IgM/IgG ratios were spread over a wider range among seronegative participants in the control group compared with the CYD-TDV group, regardless of VCD or other febrile episode. There was no threshold that would differentiate between primary infection vs subsequent dengue infections.
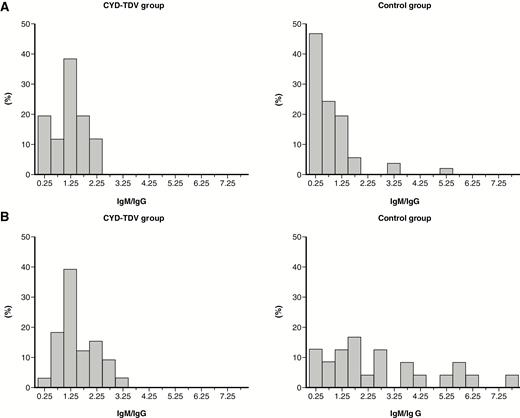
Immunoglobulin M (IgM)/immunoglobulin G (IgG) ratio distribution (on convalescent samples) in participants with virologically confirmed dengue (VCD) according to the treatment received and the baseline dengue serostatus: seropositive/immune (A) and seronegative/nonimmune (B). VCD episodes were defined with a positive test for dengue nonstructural protein 1 (NS1) antigen or dengue polymerase chain reaction. Baseline dengue serostatus was defined by plaque reduction neutralization test (PRNT50); seropositive was defined as a titer ≥10 1/dil for at least 1 serotype and seronegative as a titer <10 1/dil for any serotype.
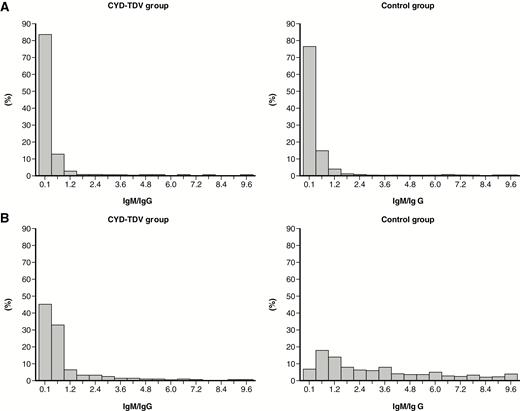
Immunoglobulin M (IgM)/immunoglobulin G (IgG) ratio distribution (on convalescent samples) in participants with other febrile episodes (no virological evidence of dengue) according to the treatment received and the baseline dengue serostatus: seropositive/immune (A) and seronegative/nonimmune (B). Baseline dengue serostatus was defined by plaque reduction neutralization test (PRNT50) assay; seropositive was defined as a titer ≥10 1/dil for at least 1 serotype and seronegative as a titer <10 1/dil for any serotype.
Seronegative Placebo Participants With Probable Dengue Episodes but No Virological Evidence of Dengue
There were 44 (14.7%) probable dengue episodes among 30 seronegative participants with other febrile episodes in the placebo group (Table 1); the lack of virological confirmation was intriguing as these episodes had IgM-positive samples and occurred in participants not previously exposed to dengue/CYD-TDV at study start. These episodes were investigated further to ascertain the reasons for their IgM seropositivity through an assessment of the participants’ IgM, IgG, and PRNT profiles during the study. Five (11.4%) of these episodes, among 3 participants, occurred after a previous VCD and none had a PRNT titer increase for any serotypes (unlike after the previous VCD episode). Therefore, the IgM and/or IgG seropositivity in these episodes could be residual to the previous VCD episode and is consistent with persistence of such antibodies.
Of the remaining 39 episodes, 5 (11.4%) in 5 participants had a PRNT titer increase before the respective episodes, suggesting potential prior asymptomatic dengue infections during the study. No further PRNT titer increase occurred after these asymptomatic episodes. Therefore, the serology profile observed for these episodes could be due to asymptomatic infections. Twenty-eight (63.6%) of the other episodes in 17 participants (1 participant had 7 febrile episodes of which 4 were before a VCD episode and 3 were after) had acute and/or convalescent IgM-positive samples but no increase was observed between acute and convalescent. Except for 1 episode (JE-seropositive participant), all episodes had IgG-negative acute and convalescent samples, and none of the latter 27 episodes had a PRNT increase. Overall, these episodes did not have the serological or PRNT profile associated with VCD. Therefore, these episodes were most probably due to detection variability in the IgM ELISA. The final 6 (13.6%) episodes in 6 participants had IgM-positive samples and PRNT titer increase after the episode for 1 serotype. Of these, 2 had an IgM increase between acute and convalescent and 1 of these was IgG positive, which was consistent with the VCD profile. These latter 2 episodes were suggestive of potential symptomatic dengue, but prior asymptomatic infection cannot be ruled out as no PRNT data were available for these episodes.
DISCUSSION
Vaccination with CYD-TDV induces anti-dengue IgM and IgG. As such, it is no surprise that it has an impact on the diagnosis of dengue based on these serological markers. Our observations from >18000 febrile episodes, including >1200 VCD episodes, confirms the limited specificity and PPV of serological diagnosis of dengue, and the bias in the case of dengue vaccination [2]—specifically, vaccination-induced bias toward false-positive dengue diagnosis based on IgM serological diagnosis in individuals seronegative at baseline presenting with febrile episodes (false-positive rates of 33.0% and 14.7% in the CYD-TDV and control groups, respectively), as well as a larger vaccination-induced bias based on IgG serological diagnosis in these individuals (false-positive rates of 77.2% and 13.3%, respectively). The bias is observed up to month 4 after vaccination; however, the studies were not designed to ascertain the kinetics of dengue IgG and IgM responses and would need to be confirmed. Thus, the utility of these serological markers would be reduced in the diagnosis of dengue in populations where CYD-TDV is introduced.
The current immunological definitions of dengue infection based on IgM and IgG serology are inadequate in vaccinated individuals and need to be reevaluated urgently as the dengue vaccine is now available in several endemic countries. Dengue vaccination history would now be needed to help interpret diagnosis and surveillance results based on serology alone. New practical, dengue-specific diagnostic algorithms are needed, which may include, in addition to IgM and IgG, other assays or tests that are not affected by vaccine-induced immunity. The specific dengue NS1 antigen test and dengue PCR tests remain valid evidence of dengue infection.
We observed a clear difference in the serological profile between VCD episodes and other febrile episodes, consistent with our earlier observations [2]. VCD episodes had significantly increased IgM and IgG levels between acute and convalescent samples regardless of the group, which were not observed in those with other febrile episodes. These observations need to be interpreted with caution as they are based on mean index values for IgM and IgG that were derived from ELISAs that were not validated for quantitative results. Nonetheless, the ELISA spectrophotometric reading of optical density is expected to have been directly proportional to the concentration of IgM and IgG present in the samples.
Additional descriptive analyses showed that baseline dengue serostatus (as defined by the PRNT50) had an impact on the IgM and IgG levels observed in VCD and other febrile episodes among CYD-TDV recipients and controls. Due to the high variability associated with the IgM and IgG data, none of the other covariates explored were observed to have a direct impact on the observed difference in IgM and IgG levels according to baseline serostatus and study group.
Although several studies have reported to be able to discriminate between primary and subsequent dengue infections based on the ratio of IgM and IgG (discriminatory ratio cutoff range, 0.88–1.78; values above cutoff defining primary infection) [10–14], no threshold was observed that would allow us to differentiate between primary vs subsequent wild-type dengue infections in vaccinated participants. Typically, IgM responses are higher during primary infection than in subsequent dengue infections; conversely, IgG responses are higher during subsequent infections than primary infections [15].
A number of limitations need to be considered when trying to generalize our observations. We had a large sample size that may have overpowered our analysis, thereby making type I errors more likely (ie, finding a statistically significant trivial or clinically irrelevant association). However, the results are consistent with those in our earlier study, which assessed fewer febrile episodes [2]. In addition, our observations were from 10 countries across Asia and Latin America, with differing epidemiological settings [4]. It may be possible that the IgM/IgG profile of VCD episodes varies as a function of the infecting serotype (not assessed in the current study). Another limitation was that we used commercial ELISAs from a single company and therefore cannot conclude whether similar results would be obtained with other assays with different characteristics. In addition, IgM and IgG were not assessed at baseline; only baseline PRNT50 results were available for a limited subset. Therefore, it was not possible to determine if asymptomatic dengue had occurred during the study before the febrile episode. Nonetheless, we identified a few probable dengue episodes that could be attributed to prior asymptomatic infection in seronegative participants in the placebo group. The annual incidence of asymptomatic dengue infection in this cohort of children was 14.8%, 4.4 times higher than for symptomatic dengue (3.4%) [16]. The time since vaccination might also have an additional impact on the magnitude of vaccine-induced bias toward false positives; further research on this matter is needed.
In summary, new practical, dengue-specific diagnostic algorithms that include assays/tests (such as NS1 antigen test and dengue PCR) that are not affected by vaccine-induced immunity are urgently needed for dengue case management and surveillance as vaccination can confound the interpretation of probable dengue diagnosis based solely on anti-dengue IgM and IgG. In addition, the diagnostic algorithms would need to take into account established flaviviruses such as YF in Latin America and JE in Asia, as well as new emerging flavivirus diseases such as Zika; all of these may further confound the serological diagnosis of probable dengue.
Notes
Acknowledgments. We thank colleagues at Global Clinical Immunology laboratory, Sanofi Pasteur, for their contributions to this study. Editorial assistance with the preparation of this manuscript was provided by Richard Glover, inScience Communications, Springer Healthcare. Funding for this assistance was provided by Sanofi Pasteur. The authors also thank Jean-Sébastien Persico for editorial assistance and manuscript coordination on behalf of Sanofi Pasteur.
Financial support. This work was supported by Sanofi Pasteur.
Potential conflicts of interest. E. P., A. M., M. B., D. C., D. L. C., M. L., R. L. O., M.-L. T., F. N., and A. B. are employees of Sanofi Pasteur, a company engaged in the development of a dengue vaccine that has been licensed in several countries. J. L. A.-G., L. V., P. P., and N.H. T. have been clinical trial investigators for and received associated payments from Sanofi Pasteur. All authors have submitted the ICMJE Form for Disclosure of Potential Conflicts of Interest. Conflicts that the editors consider relevant to the content of the manuscript have been disclosed.
References

