


Abstract
Despite successful antiretroviral therapy, people living with human immunodeficiency virus (PLWH) experience higher rates of age-related morbidity, including abnormal brain structure, brain function, and cognitive impairment. This has raised concerns that PLWH may experience accelerated aging-related brain pathology.
We performed a multicenter longitudinal study of 134 virologically suppressed PLWH (median age, 56.0 years) and 79 demographically similar human immunodeficiency virus (HIV)–negative controls (median age, 57.2 years). To measure cognitive performance and brain pathology, we conducted detailed neuropsychological assessments and multimodality neuroimaging (T1-weighted, T2-weighted, diffusion magnetic resonance imaging [MRI], resting-state functional MRI, spectroscopy, arterial spin labeling) at baseline and at 2 years. Group differences in rates of change were assessed using linear mixed effects models.
One hundred twenty-three PLWH and 78 HIV-negative controls completed longitudinal assessments (median interval, 1.97 years). There were no differences between PLWH and HIV-negative controls in age, sex, years of education, smoking or alcohol use. At baseline, PLWH had poorer global cognitive performance (P < .01), lower gray matter volume (P = .04), higher white matter hyperintensity load (P = .02), abnormal white matter microstructure (P < .005), and greater brain-predicted age difference (P = .01). Longitudinally, there were no significant differences in rates of change in any neuroimaging measure between PLWH and HIV-negative controls (P > .1). Cognitive performance was longitudinally stable in both groups.
We found no evidence that middle-aged PLWH, when receiving successful treatment, are at increased risk of accelerated aging-related brain changes or cognitive decline over 2 years.
Combination antiretroviral therapy (cART) has drastically reduced AIDS-associated morbidity and mortality [1], dramatically improving life expectancy for people living with human immunodeficiency virus (PLWH) [2]. Nevertheless, higher comorbidity rates have been observed in PLWH, including neurological, cardiovascular, renal, hepatic, and pulmonary disease; cancer; osteoporosis; and physical frailty [3–6]. Given that higher rates of such conditions are typically seen with increasing age, this has raised the concern that PLWH may have an accelerated risk of age-related deterioration in health, despite effective cART.
Higher rates of cognitive impairment are reported in PLWH compared to human immunodeficiency virus (HIV)–negative individuals [7, 8]. These are associated with neuroimaging abnormalities including: lower brain volume, increased white matter hyperintensities (WMHs), abnormal white-matter microstructure, lower cerebral perfusion, changes to neural metabolite concentrations, and altered functional connectivity [9–19]. Potentially, this pathology interacts with normal age-related changes to the brain, leading to an apparent “acceleration” of brain aging [20]. Accelerated brain changes and cognitive decline may significantly increase the risk of neurodegenerative diseases, substantially impacting public health, given the approximately 35 million PLWH worldwide [21]. However, abnormal brain structure and function in PLWH does not necessarily indicate an accelerated pathological process; brain injury may be either static or progressive, something that cannot be disentangled using cross-sectional studies.
During the cART era, only a small number of longitudinal neuroimaging investigations of PLWH have been conducted [16, 22–29]. Some, but not all, have provided evidence for accelerated brain pathology [23–26, 28, 29]. However, these studies have key limitations. First, some did not include longitudinal assessment of controls. When controls were included, they often differed from PLWH on important factors such as rates of smoking and alcohol use. Hence, the influence of aging and lifestyle factors associated with “accelerated” aging were not controlled for. As these factors influence brain structure and function independently from HIV [30–32], apparent brain abnormalities can be difficult to interpret. Second, studies have often included a high proportion of PLWH with unsuppressed plasma HIV RNA. These studies may not be representative of PLWH in resource-rich settings, of whom the vast majority receive suppressive cART. Hence, previous longitudinal studies have not clarified whether brain pathology and cognitive impairment seen in PLWH on suppressive cART are static or accelerating.
Here, we sought to definitively address whether PLWH on cART show accelerated changes in age-related neuroimaging measures. Detailed multimodal measures of brain structure and function were derived on 2 occasions in a large cohort assessed longitudinally with a 2-year interval. Our hypotheses were that (1) magnetic resonance imaging (MRI) measures of brain structure and function are abnormal at baseline in PLWH; (2) greater rates of change over 2 years in MRI metrics will be present in PLWH compared to HIV-negative participants, indicating the presence of accelerated brain pathology; and (3) progressive change in MRI metrics will be associated with a decline in cognitive function, despite successful cART.
METHODS
Participants
This longitudinal, observational study included 134 PLWH and 79 HIV-negative controls with similar demographic and lifestyle characteristics (Table 1). Recruitment of HIV-negative individuals was done via social networks of PLWH participants and through sexual health clinics, to reduce recruitment biases that may cause important demographic or lifestyle differences. Participants were recruited from London and Amsterdam as part of the Comorbidity in Relation to AIDS (COBRA) collaboration [14, 20, 33]. Assessments were conducted at baseline and after 2 years. Exclusion criteria were age <45 years, current depressive symptoms (Patient Health Questionnaire–9 score ≥15), neurological or psychiatric diagnosis, previous cerebral infections (including AIDS-defining central nervous system [CNS] diseases), self-reported intravenous drug use within the past 6 months, daily recreational drugs use (except cannabis), excess alcohol intake (>48 units/week), and MRI contraindications. All PLWH were required to be on cART, with undetectable plasma HIV RNA (<50 copies/mL) for ≥12 months prior to enrollment. The study was approved by the Academic Medical Center, Amsterdam (number NL 30802.018.09) institutional review board and a UK Research Ethics Committee (number 13/LO/0584 Stanmore, London). All participants provided written informed consent.
Characteristics of People Living With Human Immunodeficiency Virus (HIV) and HIV-Negative Participants
| Characteristics | PLWH | HIV-Negative | P Value |
|---|---|---|---|
| No. | 134 | 79 | |
| Age, y, at baseline | 56 (51–62) | 57 (52–65) | .22 |
| Sex | .79 | ||
| Female | 9 (7) | 6 (8) | |
| Male | 125 (93) | 73 (92) | |
| Ethnicity | .02 | ||
| White | 118 (88) | 77 (97) | |
| Black-African | 16 (12) | 2 (3) | |
| Study site | .31 | ||
| Amsterdam | 75 (63) | 50 (56) | |
| London | 59 (37) | 29 (44) | |
| Scanner system at baselinea | .04 | ||
| Siemens Verio 3T | 59 (44) | 29 (37) | |
| Philips Intera | 46 (34) | 20 (25) | |
| Philips Ingenia | 29 (22) | 30 (38) | |
| Completed follow-up | 123 (92) | 78 (99) | .83 |
| Assessment interval, y | 1.97 (1.77–2.12) | 1.91 (1.76–2.07) | .20 |
| Years of education | 14 (13–16) | 16 (14–16) | .21 |
| Smoking status | .26 | ||
| Current smoker | 40 (30) | 20 (25) | |
| Ex-smoker | 58 (43) | 29 (37) | |
| Never smoked | 36 (27) | 30 (38) | |
| Alcohol consumption, units per week | 5.5 (1.5–15.0) | 7.5 (1.5–17.5) | .37 |
| Use of recreational drugs in past 6 mo | 44 (33) | 18 (23) | .16 |
| Systolic blood pressure, mm Hg | 131 (124–140) | 130 (123–142) | .63 |
| Diastolic blood pressure, mm Hg | 85 (78–93) | 84 (77–91) | .55 |
| Total cholesterol/HDL cholesterol ratio | 4.1 (3.4–5.1) | 4.0 (3.5–4.8) | .63 |
| Body mass index, kg/m2 | 24.6 (22.6–27.4) | 24.6 (23.2–28.4) | .29 |
| Time since HIV diagnosis, y | 15 (9–20) | … | |
| Duration of ART, y | 13 (7–17) | … | |
| Plasma HIV RNA <50 copies/mL | 134 (100) | … | |
| History of clinical AIDS | 42 (31) | … | |
| Nadir CD4+ count, cells/µL | 180 (90–250) | … | |
| CD4+ count, cells/µL | 618 (472–806) | … | |
| CD4+:CD8+ cell count ratio | 0.84 (0.60–1.12) | … | |
| Antiretroviral regimens | |||
| Currently on NRTIs | 124 (92.5) | … | |
| 1 NRTI | 11 (8.9) | … | |
| 2 NRTIs | 109 (87.9) | … | |
| 3 NRTIs | 2 (3.2) | … | |
| Currently on PIs | 68 (50.7) | … | |
| Currently on NNRTIs | 74 (55.2) | … | |
| Currently on other drugs | 21 (15.7) | … |
Data are presented as median (interquartile range) or No. (%). P values refer to group-comparison Wilcoxon rank-sum or Fisher exact tests where appropriate.
Abbreviations: ART, antiretroviral therapy; HDL, high-density lipoprotein; HIV, human immunodeficiency virus; NNRTI, nonnucleoside reverse transcriptase inhibitor; NRTI, nucleoside reverse transcriptase inhibitor; PI, protease inhibitor; PLWH, people living with human immunodeficiency virus.
aAll participants were scanned on the same scanner system at baseline and follow-up, except for those scanned on the Philips Intera at baseline, who were scanned on the Philips Ingenia at follow-up.
Neuropsychological Assessment
Participants completed a comprehensive neuropsychological assessment, testing 6 cognitive domains: attention, executive function, information processing speed, language fluency, memory, and motor function (Supplementary Table 1). Raw scores were standardized as T-scores, adjusted for age, sex, and education level, with higher T-scores representing better cognitive function. T-scores were averaged within domains to calculate domain specific T-scores and across domains to calculate a global T-score. Three PLWH participants were missing data for 1 or more domains. Follow-up data were missing for 1 HIV-negative participant.
Neuroimaging Acquisition
Multiple modalities of MRI data were acquired at both sites. These were T1-weighted MRI, T2-weighted fluid-attenuated inversion recovery (T2-FLAIR), diffusion MRI, resting-state functional MRI (fMRI), arterial spin labeling (ASL), and magnetic resonance spectroscopy (MRS), using standard sequences (see Supplementary Materials for acquisition details). The scanner in London was a Siemens 3T Verio. In Amsterdam, a Philips 3T Intera was used initially, then upgraded to a Philips 3T Ingenia during the baseline assessment period.
Neuroimaging Processing
Six different MRI modalities were processed to generate measures of brain structure and function. These included both voxelwise measures and regional or global summary metrics (full details in Supplementary Materials). The measures used were brain volume, cortical thickness, brain-predicted age difference (brain-PAD) [20], WMH load, white matter microstructure (ie, fractional anisotropy, mean diffusivity), resting-state functional connectivity, cerebral perfusion, and concentrations of neural metabolites (choline, creatine, glutamate/glutamine, myo-i nositol, N-acetyl-aspartate [NAA]). Longitudinal neuroimaging data were unavailable for 3 PLWH and 4 controls. Further exclusions were made after quality control, per modality (Supplementary Materials).
Statistical Analysis
Univariate analyses were conducted on metrics derived from the neuroimaging processing, resulting in 23 variables. Data normality was determined and nonnormal variables were log-transformed. Cross-sectional baseline analysis used linear regressions with each neuroimaging measure as the outcome variable and HIV status, age, scanner and intracranial volume (ICV) as predictors. For longitudinal analysis, linear mixed effects models were used with each neuroimaging metric as the outcome variable, fixed effects for visit (ie, baseline and follow-up), HIV status, age, scanner, and ICV and a random effect identifying each subject, which modeled repeated measures. Differences in rates of change were evaluated by assessing the significance of group-by-visit interactions. Least-squares mean estimates were derived from linear mixed models to provide group means adjusted for covariates. The same approach was used to assess neuropsychological data, using HIV status, age, and study site as predictors. These analyses were conducted using R version 3.2 [34].
Voxelwise analyses were conducted for longitudinal assessment of brain volume, white-matter microstructure, and cerebral perfusion, using spatially normalized data. For brain volume, the Jacobian determinants representing volumetric expansions and contractions between baseline and follow-up were analyzed. For white matter microstructure and perfusion, baseline diffusion tensor imaging or blood-flow values were subtracted from follow-up values, giving a “difference” map. General linear models were used to compare groups using FSL “Randomise” [35], covarying for age, scanner, and ICV. Multiple comparison correction involved 10000 permutations and threshold-free cluster enhancement.
RESULTS
Characteristics of PLWH and HIV-Negative Controls
The PLWH and HIV-negative controls were similar in terms of age and sex (Table 1), though there was a higher proportion of people of black-African ethnicity in the PLWH group (P = 0.02). The groups had similar years of education, smoking and alcohol intake, use of recreational drugs, blood pressure, cholesterol levels, and body mass index. All PLWH were receiving cART and had plasma HIV RNA levels of <50 copies/mL. The median CD4+ T-lymphocyte count was 618 cells/μL. The median time since HIV diagnosis was 15 (interquartile range [IQR], 9–20) years and the median duration of cART was 13 (IQR, 7–17) years.
Longitudinal Participation
Of the 213 participants who took part in the baseline assessment, 12 did not complete the follow-up (11 PLWH; 1 HIV-negative), due to death (n = 3), time commitments (n = 2), or health complications (n = 7). This left a total of 201 participants with longitudinal data (retention rate, 94.3%).
Baseline Cognitive Function
At baseline, PLWH showed poorer global cognitive performance in neuropsychological tests, relative to HIV-negative controls (P < .001; Table 2), as previously reported in this cohort [14, 20, 33]. Differences were observed in the domains of attention (P < .001), information processing speed (P = .001), executive function (P = .02), and motor function (P < .001). Language (P = .15) and memory performance (P = .15) did not differ significantly between the groups.
Baseline Cross-sectional Analysis of Neuropsychological and Neuroimaging Measures
| Measure | Baseline | |||
|---|---|---|---|---|
| Group Mean (95% CI) | Parameter Estimate (95% CI) | P Value | ||
| PLWH, No. | HIV-Negative, No. | |||
| Neuropsychology | 131 | 79 | ||
| Attention | 49.68 (47.86–51.50) | 56.04 (53.64–58.43) | –0.13 (–.20, –.06) | <.001 |
| Executive function | 48.58 (47.14–50.02) | 51.25 (49.36–53.14) | –0.06 (–.11, –.01) | .02 |
| Language fluency | 51.81 (50.17–55.45) | 53.58 (51.44–55.73) | –0.04 (–.09, .01) | .15 |
| Memory | 55.49 (54.10–56.88) | 57.38 (55.55–59.21) | –0.03 (–.07, .01) | .16 |
| Motor function | 46.80 (45.34–48.27) | 50.56 (48.64–52.48) | –0.10 (–.15, –.04) | <.001 |
| Processing speed | 50.50 (49.15–51.85) | 54.18 (52.41–55.96) | –0.08 (–.12, –.03) | .001 |
| Global cognitive performance | 50.46 (49.38–51.54) | 53.81 (52.39–55.23) | –0.07 (–.11, –.03) | <.001 |
| Neuroimaging | ||||
| T1-weighted MRI | 134 | 78 | ||
| Gray matter volume, L | 0.66 (.65–.67) | 0.68 (.67–.69) | –0.01 (–.03, .00) | .035 |
| White matter volume, L | 0.48 (.47–.49) | 0.48 (.47–.50) | 0.00 (–.01, .01) | .46 |
| Cerebrospinal fluid volume, L | 0.36 (.34–.37) | 0.36 (.34–.38) | 0.01 (–.01, .03) | .26 |
| Cortical thickness, mm | 2.36 (2.35–2.38) | 2.38 (2.36–2.40) | –0.02 (–.05, .01) | .15 |
| Brain-PAD, y | 1.60 (.19–3.01) | –0.88 (–2.61, .85) | 3.04 (.75–5.32) | .01 |
| Diffusion MRI | 119 | 73 | ||
| Whole brain fractional anisotropy | 0.55 (.54–.55) | 0.55 (.55–.56) | –0.01 (–.01, .00) | .005 |
| Whole brain mean diffusivitya | 0.74 (.74–.75) | 0.73 (.72–.74) | 0.02 (.00–.03) | .012 |
| T2-weighted FLAIR | 132 | 71 | ||
| WMH loada, mm3 | 1126.20 (932.6–1360.1) | 823.6 (653.3–1038.4) | 0.38 (.08–.69) | .015 |
| Resting-state fMRI | 103 | 61 | ||
| Default mode network | 4.66 (4.35–4.97) | 5.09 (4.71–5.48) | –0.39 (–.88, .10) | .12 |
| Executive control network | 7.46 (7.04–7.88) | 7.56 (7.03–8.09) | –0.14 (–.79, .52) | .68 |
| Fronto-parietal network lefta | 4.99 (4.70–5.28) | 4.81 (4.44–5.17) | 0.04 (–.05, .12) | .39 |
| Fronto-parietal network right | 6.10 (5.78–6.43) | 6.11 (5.70–6.53) | –0.07 (–.61, .47) | .80 |
| Sensorimotor | 9.32 (8.72–9.91) | 8.67 (7.93–9.41) | 0.62 (–.25, 1.50) | .16 |
| Auditorya | 7.87 (7.33–8.41) | 7.61 (6.94–8.23) | 0.01 (–.08, .10) | .76 |
| Visual–medial | 12.23 (11.72–12.85) | 12.05 (11.35–12.75) | 0.31 (–.59, 1.21) | .50 |
| Visual–lateral | 6.36 (60.4–6.69) | 6.28 (5.87–6.68) | 0.06 (–.46, .58) | .81 |
| Visual–occipital | 6.92 (6.57–7.28) | 6.56 (6.12–7.00) | 0.33 (–.23, .90) | .25 |
| Cerebellar | 7.99 (7.40–8.58) | 8.33 (7.60–9.07) | –0.38 (–1.27, .50) | .39 |
| MRS, frontal white matter | 111 | 58 | ||
| N-acetyl aspartate | 1.39 (1.35–1.44) | 1.43 (1.37–1.49) | –0.03 (–.11, .04) | .37 |
| Myo-inositol | 0.64 (.6–.69) | 0.67 (.61–.73) | –0.03 (–.09, .03) | .26 |
| Choline | 0.36 (.35–.37) | 0.38 (.36–.39) | –0.02 (–.04, .00) | .09 |
| Glutamate/glutaminea | 1.02 (.92–1.12) | 1.07 (.94–1.20) | –0.03 (–.20, .14) | .72 |
| ASL | 128 | 71 | ||
| Gray matter perfusion, mL/100 g/min | 62.41 (60.00–64.83) | 62.39 (59.38–65.40) | 0.49 (–3.44, 4.42) | .81 |
Group means values are least square means (ie, adjusted for covariates) in the appropriate units. P values reported are derived from analyses of group factors on the outcome variables, using linear regression. Mean diffusivity values are reported in units of ×10-3 mm2/s-1. Resting-state fMRI values represents relative measures of within-network connectivity. MRS values are reported as a ratio of creatine. Neuropsychological tests are reported at T-scores, based on normative data adjusted for age, sex, and education.
Abbreviations: ASL, arterial spin labeling; brain-PAD, brain-predicted age difference; CI, confidence interval; FLAIR, fluid-attenuated inversion recovery; fMRI, fluid magnetic resonance imaging; HIV, human immunodeficiency virus; MRI, magnetic resonance imaging; MRS, magnetic resonance spectroscopy; PLWH, people living with human immunodeficiency virus; WMH, white matter hyperintensity.
aIndicates that the variable was log-transformed due to having a nonnormal distribution.
Abnormal Brain Structure Is Seen in PLWH
Baseline analysis indicated that PLWH had significantly lower gray matter volume (P = .04) and greater WMH load (P = .02), compared to HIV-negative controls (Table 2; Figure 1). PLWH had a significantly greater brain-PAD (P = .01). Measures of white matter microstructure were also significantly different between the groups, with PLWH showing lower fractional anisotropy (P = .01) and higher mean diffusivity (P = .01) in the whole-brain white matter “skeleton.” There were no group differences in cortical thickness, white matter volume, cerebrospinal fluid volume, cerebral perfusion, neural metabolite concentrations, or functional network connectivity (Table 2).
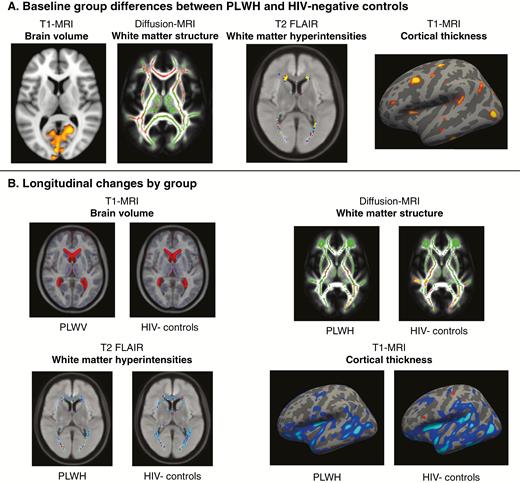
Summary of voxel-wise and vertex-wise neuroimaging results. A, Significant baseline differences between people living with human immunodeficiency virus (PLWH) and human immunodeficiency virus (HIV)–negative controls were seen in 4 neuroimaging modalities (displayed voxelwise or on the cortical surface). Highlighted regions indicate where PLWH showed lower brain volume (red-yellow areas), lower fractional anisotropy (red), higher white matter hyperintensities, and lower cortical thickness (red-yellow areas, left hemisphere displayed). B, Longitudinal data for these 4 neuroimaging modalities are displayed to illustrate significant changes between baseline and follow-up within each group. Longitudinal changes are seen for T1-weighted magnetic resonance imaging (MRI) with increased lateral ventricles volume (red areas) and reduced gray matter volume (blue areas). For diffusion MRI, reductions in fractional anisotropy (red-yellow) were observed, overlaid on the mean white matter “skeleton” (green) and an average fractional anisotropy image. For assessment of white-matter hyperintensities on T2-weighted fluid-attenuated inversion recovery (FLAIR), a moderate increase in average distribution was seen in both groups. For cortical thickness, changes are plotted on an inflated cortical surface (left hemisphere) for both groups.
Changes in Cognitive Function
Generally, both PLWH and HIV-negative controls showed similar changes in neuropsychological tests between baseline and follow-up (Table 3; Figure 2), except for attention and memory T-scores. For memory, significant improvements were observed across both groups (P < .001). For attention, there was a significant interaction between group and visit (P = .02), which was driven by a reduction in performance in the HIV-negative group.
Longitudinal Analysis of Neuropsychological and Neuroimaging Measures
| Measure | Rates of Longitudinal Change | |||
|---|---|---|---|---|
| Group Mean (95% CI) | Parameter Estimate (95% CI) | P Value | ||
| PLWH. No. | HIV-Negative, No. | |||
| Neuropsychology | 123 | 77 | ||
| Attention | 0.71 (–2.65, 4.07) | –2.19 (–6.48, 2.09) | 2.69 (.52– 4.87) | .02 |
| Executive function | 0.04 (–2.64, 2.72) | 0.94 (–2.48, 4.37) | –0.85 (–2.53, .83) | .33 |
| Language fluency | 0.25 (–2.78, 3.29) | 0.29 (–3.57, 4.16) | –0.18 (–1.89, 1.53) | .84 |
| Memory | 2.19 (–.41, 4.80) | 3.45 (.13–6.78) | –1.19 (–2.69, .31) | .12 |
| Motor function | 0.43 (–2.37, 3.24) | 0.39 (–3.19, 3.98) | 0.04 (–1.69, 1.77) | .97 |
| Processing speed | 0.84 (–1.66, 3.33) | 0.42 (–2.77, 3.60) | 0.45 (–.78, 1.68) | .48 |
| Global cognitive performance | 0.75 (–1.23, 2.72) | 0.55 (–1.98, 3.08) | 0.18 (–.59, .96) | .64 |
| Neuroimaging | ||||
| T1-weighted MRI | 120 | 74 | ||
| Gray matter volume, L | –0.01 (–.03, .01) | –0.01 (–.04, .01) | –0.001 (–.10, .01) | .70 |
| White matter volume, L | –0.01 (–.02, .01) | 0.00 (–.03, .02) | 0.00 (–.05, .03) | .78 |
| Cerebrospinal fluid volume, L | 0.01 (–.01, .04) | 0.01 (–.02, .05) | –0.001 (–.01, .10) | .85 |
| Cortical thickness, mm | –0.03 (–.06, .01) | –0.02 (–.06, .02) | –0.005 (–.07, .06) | .55 |
| Brain-PAD, y | –0.17 (–2.70, 2.36) | –0.47 (–3.69, 2.75) | 0.30 (–1.86, 8.79) | .70 |
| Diffusion MRI | 119 | 71 | ||
| Whole brain fractional anisotropy | –0.01 (–.02, .00) | –0.01 (–.02, .00) | –0.001 (–.01, .02) | .64 |
| Whole brain mean diffusivitya | 0.02 (.00–.03) | 0.01 (–.01, .03) | 0.007 (–.04, .02) | .15 |
| T2-weighted FLAIR | 119 | 74 | ||
| WMH loada, mm3 | 749.3 (–506.4, 2004.9) | 442.3 (–1184.7, 2069.4) | 0.10 (.04–1.52) | .12 |
| Resting-state fMRI | 104 | 57 | ||
| Default mode network | 0.37 (–.18, .92) | 0.46 (–.26, 1.19) | –0.01 (–1.14, .76) | .75 |
| Executive control network | 0.04 (–.77, .85) | 0.44 (–.63, 1.50) | –0.29 (–1.58, .98) | .49 |
| Fronto-parietal network lefta | 0.18 (–.34, .69) | 0.52 (–.16, 1.20) | 0.31 (–1.52, .37) | .24 |
| Fronto-parietal network right | 0.09 (–.50, .68) | 0.35 (–.42, 1.13) | –0.29 (–1.80, .29) | .34 |
| Sensorimotor | 0.66 (–.41, 1.73) | 1.66 (.25– 3.07) | –0.91 (–2.89, .70) | .13 |
| Auditorya | 0.56 (–.55, 1.67) | 1.74 (.28– 3.20) | –0.93 (–3.14, .01) | .22 |
| Visual–medial | –0.02 (–1.07, 1.02) | 0.32 (–1.06, 1.69) | –0.35 (–2.46, 1.33) | .45 |
| Visual–lateral | 0.12 (–.49, .73) | 0.41 (–.40, 1.21) | –0.23 (–1.93, .14) | .43 |
| Visual–occipital | 0.14 (–.54, .82) | 0.55 (–.35, 1.45) | –0.32 (–2.08, .19) | .32 |
| Cerebellar | 0.11 (–.99, 1.20) | 0.85 (–.60, 2.29) | –0.70 (–2.05, 1.66) | .21 |
| MRS, frontal white matter | 115 | 71 | ||
| N-acetyl aspartate | –0.03 (–.13, .06) | –0.08 (–.20, .04) | 0.04 (–.16, .11) | .44 |
| Myo-inositol | –0.06 (–.14, .01) | –0.03 (–.13, .07) | –0.03 (–.16, .08) | .54 |
| Choline | 0.00 (–.03, .02) | –0.02 (–.05, .01) | 0.02 (–.04, .04) | .16 |
| Glutamate/glutaminea | –0.01 (–.21, .18) | –0.04 (–.29, .22) | 0.02 (–.24, .34) | .89 |
| ASL | 92 | 60 | ||
| Gray matter perfusion, mL/100 g/min | –5.45 (–10.05, –.86) | –7.58 (–13.39, –1.76) | 1.32 (–6.49, 10.51) | .55 |
Group means values are least square means (ie, adjusted for covariates) in the appropriate units. Longitudinal group difference parameter estimates are from linear mixed effects models of group-by-visit interactions. P values reported are derived from analyses of group factors on the outcome variables, using linear mixed effects models (interaction group × time). No. is the number of participants included after quality control, for each modality. Mean diffusivity values are reported in units of ×10-3mm2/s-1. Resting-state fMRI values represents relative measures of within-network connectivity. MRS values are reported as a ratio of creatine. Neuropsychological tests are reported as T-scores, based on normative data adjusted for age, sex, and education.
Abbreviations: ASL, arterial spin labeling; brain-PAD, brain-predicted age difference; CI, confidence interval; FLAIR, fluid-attenuated inversion recovery; fMRI, fluid magnetic resonance imaging; HIV, human immunodeficiency virus; MRI, magnetic resonance imaging; MRS, magnetic resonance spectroscopy; PLWH, people living with human immunodeficiency virus; WMH, white matter hyperintensity.
aVariable was log-transformed due to having a nonnormal distribution.
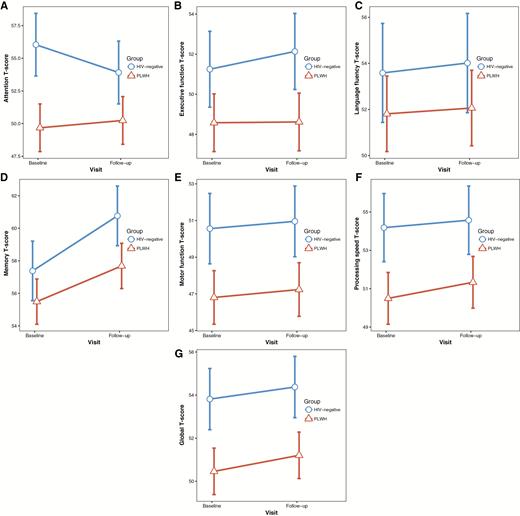
Longitudinal changes in neuropsychological tests. Within-group change between baseline and follow-up in cognitive domain summary T-scores for people living with human immunodeficiency virus (PLWH) and human immunodeficiency virus (HIV)–negative controls. Values plotted are the least-square means and associated 95% confidence intervals, adjusted for covariates. A, Attention. B, Executive function. C, Language fluency. D, Memory. E, Motor function. F, Processing speed. G, Global cognitive performance (average across the 6 domains).
Rates of Change in Brain Measures Are Similar in PLWH and Controls
Both PLWH and HIV-negative participants showed longitudinal reductions in brain volumes, altered white matter structure, increased WHM load, and reduced cerebral perfusion using univariate neuroimaging measures of brain structure (Table 3). However, group-by-visit interactions were not significant for any of the neuroimaging modalities and brain-PAD (all P > .1), indicating that the rates of change did not differ between groups (Figure 3). Within PLWH there were no significant relationships between longitudinal neuroimaging changes and current CD4 count, nadir CD4 count, time since HIV diagnosis, cART duration, or past AIDS diagnosis (all P > .1). Voxelwise analysis of changes in brain volumes, white matter microstructure, and cerebral perfusion showed no significant longitudinal differences between PLWH and HIV-negative controls.
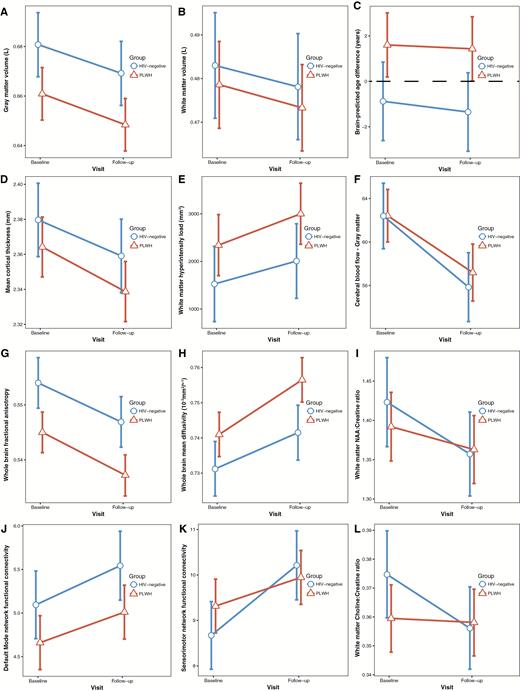
Longitudinal changes in neuroimaging measures. Within-group change between baseline and follow-up in neuroimaging measures for people living with human immunodeficiency virus (PLWH) and human immunodeficiency virus (HIV)–negative controls. Values plotted are the least-square means and associated 95% confidence intervals, adjusted for covariates. A, Gray matter volume. B, White matter volume. C, Brain-predicted age difference. D, Cortical thickness averaged across both hemispheres. E, White matter hyperintensity load. F, Cerebral blood flow averaged across cortical gray matter. G, Fractional anisotropy averaged across the whole brain white matter skeleton. H, Mean diffusivity averaged across the whole brain white matter skeleton. I, N-acetyl aspartate (NAA) concentration (as a ratio of creatine) in frontal white matter. J, Default mode within-network connectivity. K, Sensorimotor within-network connectivity. L, Choline concentration (as a ratio of creatine) in frontal white matter.
DISCUSSION
In PLWH with suppressed viremia on cART, we found no evidence for accelerated changes in brain structure, function, or brain-predicted age and no evidence for cognitive decline over 2 years. Cross-sectional abnormalities in brain structure, brain-predicted age, and cognitive function were apparent in our group of PLWH compared to controls. Importantly, these differences between the 2 groups remained stable over time. Overall, we observed longitudinal changes in neuroimaging measures, likely related to aging. Importantly, studies of other neurological or neurodegenerative conditions (eg, Alzheimer’s disease, traumatic brain injury) commonly report changes above and beyond expected aging-related declines over shorter timescales [36, 37]. Hence, our results indicate that in PLWH on suppressive cART, any progressive changes to the brain that occur are no greater than those seen in appropriately-matched HIV-negative controls.
Our comprehensive multimodality neuroimaging study clarifies previous reports that suggested progressive brain injury occurs in PLWH, perhaps due to key methodological differences. For example, Gongvatana and colleagues reported 2-year progressive changes in neural metabolites in PLWH, but this MRS study did not include an HIV-negative control group [25]. We also observed reductions in NAA over time, but these were similar in PLWH and HIV-negative controls and so are likely a consequence of aging or secondary factors other than HIV infection. Pfefferbaum and colleagues [26] reported greater reductions in regional brain volumes in PLWH. Their control group had more years of education, fewer depressive symptoms, higher socioeconomic status, higher IQ, and lower rates of smoking. These factors may have introduced bias as they are known to interact with age-related volume loss [30, 32]. Most recently, Clifford and colleagues [28] reported more rapid rates of brain volume loss in PLWH aged ≥60 years compared to healthy controls. The controls here had lower rates of current and past smoking, and showed very little change in brain volumes over time (eg, 0.16% annualized gray matter volume reduction, compared to 0.65% in PLWH). Studies in the general population report around 0.4% per year [38]. By contrast, the HIV-negative controls in the current study lost a mean 0.89% of gray matter volume per year. Potentially, Clifford and colleagues’ controls had particularly good brain health for their age, which may not be attributable solely to the absence of HIV. This highlights the importance of using appropriate controls, not only for HIV research, but for any studies considering brain health during aging. Limiting the impact of lifestyle and demographic factors is essential to disentangle the effects of aging, disease, and common comorbidities, particularly for such longitudinal studies.
The composition of the HIV-positive group can also strongly influence neuroimaging results. We restricted analysis to PLWH on cART with suppressed viremia and no history of CNS infections. This is broadly representative of PLWH in Europe and North America and allows us to address the natural history of chronic HIV infection when HIV viremia is adequately suppressed. This has not been possible in all previous longitudinal studies. For example, while Cardenas and colleagues [24] reported results in comparison with a control group, only 53% of PLWH were virally suppressed at both time points and people with a history of CNS opportunistic infections were included. Untreated HIV or a history of CNS infections likely leads to progressive neural deterioration. In our study of virologically suppressed PLWH, this progression was not observed.
We observed baseline differences in brain structure between PLWH and controls in several neuroimaging modalities. These included evidence of lower gray matter volume, higher WHM load, and extensive areas of white matter abnormalities, in line with previous reports [9, 13, 14]. Cross-sectional differences were not observed in measures of resting-state functional connectivity (fMRI), neural metabolite concentrations (MRS), or cerebral perfusion (ASL), contrary to previous reports during the cART era [11, 12, 15]. The discrepancy between our findings and these studies could be explained by differing samples or scanner-related and MRI-protocol differences. Additionally, these modalities may measure more dynamic aspects of HIV-associated brain injury that may improve with successful treatment compared with volumetric measures (eg, gray matter volume loss), which may be irreversible. An important contributing factor could be the noise levels in fMRI, MRS, and ASL, relative to diffusion MRI, T2-FLAIR, and, in particular, T1-weighted MRI. As our study pooled data from 3 scanners, scanner-related variability is also an issue. That structural MRI measures were sensitive to group differences in this multicenter study is important when considering future study design, particularly regarding longitudinal assessment and clinical trials.
PLWH had poorer cognitive performance at baseline, as previously observed [14, 20]. Longitudinally, performance was generally stable, though improvements were seen in memory, potentially reflecting practice effects. Interestingly, performance in measures of attention decreased in HIV-negative controls, but not in PLWH. The noticeably high baseline attention scores of HIV-negative participants suggests that this reduction could be a regression toward the “true” group mean. Overall, the cognitive performance of both groups was high, compared to the normative average T-score of 50. This may reflect a “research participant” effect; that nearly half had tertiary-level education illustrates the difficulties faced in recruiting truly representative study samples. To better understand trajectories of cognitive aging in PLWH, future studies would benefit from larger numbers, more frequent assessments, and run-in periods to mitigate practice effects.
Differences in longitudinal rates of changes in brain structure or brain function between the 2 groups were absent. This suggests that the cross-sectional neuroimaging and cognitive deficits observed are the result of historical pathological processes, such as the direct pathogenic effect of HIV on the CNS or the initial immune response to infection, rather than an ongoing pathological process. Further work to clarify the pathogenic processes leading to these abnormalities is warranted. Nevertheless, the presence of the cross-sectional differences in PLWH is important, as it could mean that PLWH reach a symptomatic threshold for age-related cognitive decline earlier than HIV-negative people, despite appearing to be on the same trajectory.
Some strengths and weakness of our study should be noted. Strengths include the large sample size for a longitudinal neuroimaging study, which gave sufficient statistical power to detect even small changes in brain structure over 2 years. The 2-year follow-up period limits extrapolation to longer-term changes; however, the consistently parallel nature of the group “slopes” of change suggests that brain changes in PLWH with suppressed viremia are not diverging from those seen in HIV-negative people. Our control group was similar to the PLWH group, ethnicity notwithstanding, potentially reducing confounding factors that may independently affect brain aging. Another strength is the use of 6 neuroimaging modalities, sensitive to many different neurobiological phenomena, allowing a comprehensive assessment of the brain. Weaknesses include the potential for recruitment bias whereby PLWH may be higher-functioning that the majority of the HIV population, reflected by a willingness to enter a longitudinal study. Also, we specifically recruited nondepressed PLWH to be able to interpret the cognitive findings. However, depression is commonly reported in PLWH [39], and brain aging may differ in subjects with depressive illnesses. The use of 3 different scanners, including a system upgrade during the baseline phase, may have influenced some neuroimaging measures. However, we explicitly controlled for this in our statistical analysis and, crucially, proportions of PLWH and HIV-negative controls scanned at each site were similar. The proportion of PLWH and HIV-negative controls affected by the upgrade (ie, different scanners at baseline and follow-up) was similar to the overall group proportions in the study, so are representative and did not introduce bias. To investigate scanner effects further, we analyzed data from London only (Supplementary Table 2). There were only minor differences in cross-sectional results and the longitudinal results were the same as the overall results, providing further reassurance that the combination of scanners did not influence our findings. Another potential limitation is survivor bias, whereby only unrepresentatively healthy individuals completed longitudinal assessment. However, we found no systematic differences between participants who dropped out and participants who completed both assessments (Supplementary Table 3) and, given the high retention rate (94.4%), any residual survivor bias is likely to be minimal.
In conclusion, our study finds no evidence of accelerated aging-related changes in brain structure, function, and brain-predicted age in well-treated PLWH. This provides reassurance that, with virological suppression, PLWH in middle age are not at increased risk of progressive cognitive decline and abnormal deterioration to brain health over 2 years.
Supplementary Data
Supplementary materials are available at Clinical Infectious Diseases online. Consisting of data provided by the authors to benefit the reader, the posted materials are not copyedited and are the sole responsibility of the authors, so questions or comments should be addressed to the corresponding author.
Notes
Acknowledgments. The authors acknowledge all the participants from the COBRA study as well as all the COBRA investigators who are not directly involved in this manuscript.
Financial support. This work was supported by the European Union Seventh Framework Program (grant number 305522 to COBRA collaboration. James Cole is funded by a Research Councils UK/UKRI Innovation/Rutherford Fund Fellowship.
Potential conflicts of interest. A. W. has received grants, personal fees (ie, speaker honoraria), and research grants from ViiV Healthcare, Gilead Sciences, BMS, Janssen, and MSD. All other authors report no potential conflicts. All authors have submitted the ICMJE Form for Disclosure of Potential Conflicts of Interest. Conflicts that the editors consider relevant to the content of the manuscript have been disclosed.

