


Abstract
There are limited data on the burden of disease posed by influenza in low- and middle-income countries. Furthermore, most estimates of influenza disease burden worldwide rely on passive sentinel surveillance at health clinics and hospitals that lack accurate population denominators.
We documented influenza incidence, seasonality, health-system utilization with influenza illness, and vaccination coverage through active community-based surveillance in 4 ecologically distinct regions of Peru over 6 years. Approximately 7200 people in 1500 randomly selected households were visited 3 times per week. Naso- and oropharyngeal swabs were collected from persons with influenza-like illness and tested for influenza virus by real-time reverse-transcription polymerase chain reaction.
We followed participants for 35353 person-years (PY). The overall incidence of influenza was 100 per 1000 PY (95% confidence interval [CI], 97–104) and was highest in children aged 2–4 years (256/1000 PY [95% CI, 236–277]). Seasonal incidence trends were similar across sites, with 61% of annual influenza cases occurring during the austral winter (May–September). Of all participants, 44 per 1000 PY (95% CI, 42–46) sought medical care, 0.7 per 1000 PY (95% CI, 0.4–1.0) were hospitalized, and 1 person died (2.8/100000 PY). Influenza vaccine coverage was 27% among children aged 6–23 months and 26% among persons aged ≥65 years.
Our results indicate that 1 in 10 persons develops influenza each year in Peru, with the highest incidence in young children. Active community-based surveillance allows for a better understanding of the true burden and seasonality of disease that is essential to plan the optimal target groups, timing, and cost of national influenza vaccination programs.
Although influenza is a major cause of morbidity and mortality in temperate countries [1, 2], data are limited on the burden of influenza disease in low- and middle-income countries (LMICs). Furthermore, throughout the world, most estimates of influenza disease burden are based upon data from passive surveillance conducted through medically attended visits [2–5], which may represent the minority of symptomatic cases. This is pertinent to estimating the disease burden in LMICs, where financial constraints often limit access to medical care [6]. For example, in Peru, a South American LMIC, 34% of the population does not have health insurance and a substantive proportion of individuals do not seek care because they perceive their illness to be manageable through self-medication (29%–31%) or lack the time (23%–24%) or money (10%–15%) to seek care [7]. Furthermore, extreme variability in socioeconomic and ecological conditions between regions within LMICs may call into question the applicability of national-level estimates of disease burden to a given region.
Active surveillance at the household level can provide more accurate estimates of influenza incidence by including persons who do not seek medical care [4]. Household-based studies of influenza in high-income countries dating back to the 1970s have contributed to a better understanding of the public health impact of influenza and informed influenza prevention, and control strategies [8, 9]. In particular, such studies help focus resources toward high-risk groups, especially influenza vaccination, which is recommended by the World Health Organization’s Strategic Advisory Group of Experts (WHO-SAGE) on Immunization for pregnant woman, children aged 6–59 months, the elderly, and those with high-risk conditions [10]. Similar active surveillance community-based studies are needed to assess the community impact of influenza and allocate resources in LMICs [4].
Influenza disease burden data are limited from South America [2, 11], a continent with diverse climactic and ecologic zones [12], and a wide range of influenza vaccination coverage (30%–90%) among risk groups [13]. Peru is a country with a wide range of ecosystems: desert, semiarid, highland valleys, and tropical rainforest [12]. Recent studies suggest that the economic burden caused by influenza in Peru is substantial among WHO-SAGE target groups [14]. Current policy in Peru recommends annual influenza vaccination of pregnant women, children aged 7–23 months, health workers, the elderly (≥65 years), and people with comorbidities [15]. Implementation of these guidelines is incomplete and varies by region [16, 17]. To gain a thorough understanding of the disease burden and the epidemiologic pattern of influenza in Peru, we established an active community-based household surveillance cohort in 4 ecologically and demographically distinct regions of Peru. Here we report 6 years of data describing the incidence, seasonality, health system utilization, and vaccination coverage for influenza in these regions.
METHODS
Study Sites
We chose study sites to represent diverse ecosystems of Peru, considering also various logistical factors (Figure 1 and Table 1): (1) Lima, Peru’s capital, located in a coastal dessert, with the study site in a periurban community 25 km from the city center; (2) Cuzco, located in the Andes mountain highlands, with the study site near the city center; (3) Tumbes, located in a dry tropical forest habitat on the border with Ecuador, with the study site comprised of semirural communities on the outskirts of the city; and (4) Puerto Maldonado, located in Peru’s southern Amazon Basin, with a warm tropical rainforest climate. This study site is comprised of small communities around the city. The study period was June 2009 through July 2015 for Lima, Cuzco, and Puerto Maldonado, and through July 2014 for Tumbes.
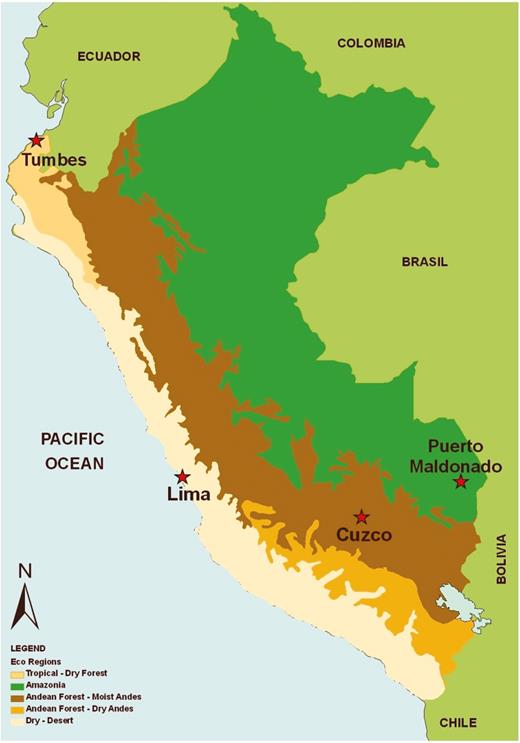
Map of Peru showing ecological regions and sites for the Peru Influenza Cohort Study, 2009–2015.
Characteristics of Study Population and Sites, Peru Influenza Cohort Study, 2009–2015a
| Characteristic | Study Site | |||||||||
|---|---|---|---|---|---|---|---|---|---|---|
| Lima | Cuzco | Tumbes | Puerto Maldonado | Total | ||||||
| No. of Participantsb | 3296 | 3565 | 2685 | 4504 | 14050 | |||||
| Sex, female | 1699 | (52) | 1830 | (51) | 1379 | (51) | 2395 | (53) | 7303 | (52) |
| Age group, y | ||||||||||
| <2 | 300 | (9) | 351 | (10) | 290 | (11) | 418 | (9) | 1359 | (10) |
| 2–4 | 220 | (7) | 232 | (6) | 170 | (6) | 376 | (8) | 998 | (7) |
| 5–11 | 401 | (12) | 447 | (13) | 327 | (12) | 713 | (16) | 1888 | (13) |
| 12–17 | 424 | (13) | 466 | (13) | 290 | (11) | 577 | (13) | 1757 | (13) |
| 18–49 | 1573 | (48) | 1637 | (46) | 1179 | (44) | 1930 | (43) | 6319 | (45) |
| 50–64 | 302 | (9) | 289 | (8) | 248 | (10) | 362 | (8) | 1201 | (9) |
| ≥65 | 76 | (2) | 143 | (4) | 181 | (7) | 128 | (3) | 528 | (4) |
| Age range, y | 0–115 | 0–106 | 0–98 | 0–92 | ||||||
| Geographic characteristic | ||||||||||
| Description of ecosystem | Coast desert | Andes mountain highlands | Dry tropical forest | Amazon rainforest | ||||||
| Study site | Pampas de San Juan de Miraflores | San Jeronimo | San Jacinto | Tambopata | ||||||
| Population | 57238 | 31687 | 7979 | 60214 | ||||||
| Latitude | 76°58′12.15″ | 71°53′00″ | 80º27′04″ | 77º32′ | ||||||
| Longitude | 12°9′5.2″ | 13°32′24″ | 03°38′35″ | 12°36′ | ||||||
| Altitude, m | 141 | 3244 | 36 | 139 | ||||||
| Average rainfall/y, mm | 15 | 800 | 250 | >1000 | ||||||
| Average temperature, C° (min–max) | 19 (17–23) | 13 (7–19) | 25 (17–36) | 28 (20–34) | ||||||
| Average relative humidity, % (min–max) | 82 (63–94) | 55 (31–82) | 80 (52–92) | 78 (55–99) | ||||||
Data are presented as No. (%) unless otherwise indicated.
aJune 2009 through July 2015 for Lima, Cuzco, and Puerto Maldonado and June 2009 through July 2014 for Tumbes.
bStudy population at enrollment.
Study Population and Design
We selected households randomly from publicly available census data for each community using computer-generated random numbers to arrive at an initial study target population of 1500 people per cohort site (approximately 375 households per site) in 2009 and 1800 the following years. An adult head of household as well as all household members were invited to participate in the study. A household member was defined as a person who had lived in the household for at least 2 weeks at the time of consideration of enrollment with no plans to move in the next 2 months. Persons joining the household after study initiation were also invited to participate. Household members who could not be located within 1 month of follow-up or who declined to participate were excluded. To maintain the target population, we randomly selected replacement households for each cohort site once per year.
Household Surveillance, Case Definitions, and Sample Collection
Study field workers (SFWs) visited each household 3 times per week year-round to assess for the presence of influenza-like illness (ILI) among participants. For persons aged ≥5 years, ILI was defined as oral temperature ≥38°C or a subjective history of fever plus cough or sore throat not already diagnosed as another condition [18] . For children aged <5 years, ILI definition also included rhinorrhea and/or nasal congestion. SFWs educated 2 adults in each household in the identification of ILI symptoms and use of a digital oral thermometer provided by the study.
When participants reported ILI, SFWs collected naso- and oropharyngeal swabs and placed both into a tube containing commercially universal viral transport medium. Specimens were refrigerated at approximately 4°C until the end of the day and were then stored at –80°C at the study center. SFWs sent samples biweekly on dry ice for influenza virus testing at the US Naval Medical Research Unit No. 6 (NAMRU-6) laboratory in Lima.
ILI cases were followed up for 15 days (3 times per week) from symptoms onset to collect data on healthcare utilization, hospitalization, and outcome. Since 2011 (Lima, Tumbes, and Cuzco) and 2012 (Puerto Maldonado), SFWs recorded influenza vaccination twice a month by checking participants’ immunization card and verifying influenza vaccination status by cross-referencing with health center records.
Laboratory Methods
We performed real-time reverse-transcription polymerase chain reaction (rRT-PCR) assay of combined nasal and oropharyngeal swabs to diagnose influenza [19]. Nucleic acid was extracted using the QIAamp Viral RNA Isolation Kit (Qiagen, Valencia, California), amplified by using the Access RT-PCR System (Promega, Madison, Wisconsin), and tested by rRT-PCR using primers and probes for influenza A and B viruses based on protocols from the US Centers for Disease Control and Prevention and the WHO.
Statistical Analyses
We determined total person-time accrued by participants, excluding time when participants were unavailable for follow-up. We estimated influenza incidence by dividing the number of influenza episodes by the total person-years or person-months of contribution. Episodes of ILI or influenza in the same individual were counted separately when they occurred at intervals of >15 days. We estimated the health system utilization as the percentage of total episodes of influenza that were medically attended.
To define the months of influenza epidemic activity, we calculated the monthly proportion of samples testing positive for influenza virus from January 2011 to July 2015 (except for Tumbes, where surveillance ended in July 2014) and applied these to a logistic regression model [20] where the proportion of samples testing for influenza was dependent on the month and time of the year. We considered proportion exceeding the annual median for ≥2 consecutive months as epidemic [5, 20]. The influenza vaccine coverage rate was estimated by dividing the number of participants with verified influenza vaccination during 2011–2014 by the total person-years (PY) of contribution. Participants were considered vaccinated when they had received 2 vaccine doses (children aged 6–23 months) or 1 or more vaccine doses (participants aged >23 months) in the current year [15]. Ninety-five percent confidence intervals (CIs) were calculated using a Poisson distribution. We stratified incidence by age group categories across sites, seasons, and influenza virus type/subtype. We used Stata version 13 software for statistical analyses.
Ethics Considerations
The NAMRU-6 Ethics Committee approved this study (NMRCD.2009.0005). Informed written consent was obtained from each adult participant or parent or guardian of a child at the time of enrollment.
RESULTS
Demographic Characteristics
SFWs approached 3483 households and enrolled 14050 participants in 2486 households (average of 4.7 persons/household) across 4 sites. A total of 7874 (56%) participants either were lost to follow-up because they moved out of the study area (64% [5046/7874]), voluntarily withdrew (29% [2318]) (usually when asked to participate for a second or third year), were excluded because an adult informant was unavailable to provide household information after 6 attempts to reach them (5% [382]), or died as a result of causes unrelated to influenza (2% [128]). The final analyses included data for participants totaling 35353 PY, with a weekly median of 6357 PY (interquartile range [IQR], 6034–6596). Fifty-two percent of participants were female, 45% were 18–49 years old, and 17% were aged <5 years (Table 1).
Influenza-like Illness Incidence
There were 13584 ILI episodes among 5745 participants for a rate of 384 ILIs/1000 PY (95% CI, 378–391) among all age groups (Table 2). The median age of ILI cases was 8 years (IQR, 3–23). Children aged <2 years had the highest ILI incidence (1697/1000 PY [95% CI, 1626–1771]) across sites and study years, with incidence subsequently steadily declining with increasing age (Table 3). ILI incidence was highest in Lima (404/1000 PY [95% CI, 392–417]) (Table 2).
Incidence of Influenza-like Illness and Laboratory-Confirmed Influenza Study Site and Year, Peru Influenza Cohort Study, 2009–2015a
| Incidence | Study Site | ||||
|---|---|---|---|---|---|
| Lima | Cuzco | Tumbes | Puerto Maldonado | Total | |
| Influenza-like illness per 1000 PY (95% CI) | |||||
| 2009 | 524 (478–575) | 194 (164–231) | 615 (561–674) | 294 (258–335) | 415 (393–439) |
| 2010 | 407 (378–440) | 353 (324–383) | 481 (449–516) | 387 (357–419) | 408 (392–424) |
| 2011 | 256 (232–282) | 281 (256–309) | 261 (237–287) | 238 (215–265) | 260 (247–273) |
| 2012 | 479 (447–514) | 332 (305–362) | 336 (310–365) | 396 (365–430) | 386 (371–401) |
| 2013 | 509 (475–544) | 498 (464–535) | 341 (314–370) | 510 (472–550) | 460 (443–477) |
| 2014 | 359 (331–390) | 437 (405–472) | 344 (308–383) | 478 (437–523) | 404 (387–422) |
| 2015 | 275 (241–314) | 411 (368–458) | … | 426 (373–486) | 363 (338–389) |
| 2009–2015a | 404 (392–417) | 369 (356–381) | 376 (363–389) | 387 (374–401) | 384 (378–391) |
| Influenza A and B per 1000 PY (95% CI) | |||||
| 2009 | 216 (187–250) | 30 (19–46) | 238 (205–276) | 109 (88–136) | 153 (140–168) |
| 2010 | 140 (123–159) | 114 (98–132) | 162 (143–183) | 124 (107–143) | 135 (126–145) |
| 2011 | 26 (19–36) | 65 (53–78) | 26 (19–35) | 59 (47–73) | 43 (39–49) |
| 2012 | 114 (99–131) | 63 (52–77) | 121 (106–139) | 122 (105–141) | 105 (97–113) |
| 2013 | 128 (112–147) | 91 (77–107) | 82 (70–97) | 84 (70–102) | 97 (90–105) |
| 2014 | 63 (49–82) | 73 (58–93) | 77 (61–97) | 99 (78–126) | 77 (68–86) |
| 2015 | 72 (55–93) | 116 (94–142) | … | 118 (92–152) | 99 (87–114) |
| 2009–2015a | 107 (101–114) | 83 (77–89) | 108 (101–115) | 104 (97–111) | 100 (97–104) |
| Medically attended influenza per 1000 PY (95% CI)b | 52 (48–57) | 29 (26–32) | 61 (56–66) | 34 (30–38) | 44 (42–46) |
| Influenza-associated hospitalizations per 1000 PY (95% CI) | 0.2 (.03–.7) | 0.9 (.4–1.6) | 0.4 (.1–1.0) | 1.4 (.7–2.4) | 0.7 (.4–1.0) |
| Health system utilization, % (95% CI)b | 49 (39–58) | 35 (26–46) | 56 (47–65) | 33 (25–43) | 44 (35–54) |
| Influenza vaccinations per 100 PY (95% CI)c | 10 (9·4–11) | 7 (6–8) | 16 (15–17) | 7 (6–8) | 10 (9.7–10.6) |
Person-years: All sites: (35353), 2009 (3020), 2010 (6352), 2011 (6243), 2012 (6394), 2013 (6217), 2014 (5045), 2015 (2082). Lima: 2009 (847), 2010 (1644), 2011 (1568), 2012 (1652), 2013 (1651), 2014 (1558), 2015 (796). Cuzco: 2009 (674), 2010 (1571), 2011 (1596), 2012 (1583), 2013 (1557), 2014 (1523), 2015 (770). Tumbes: 2009 (740), 2010 (1625), 2011 (1645), 2012 (1702), 2013 (1713), 2014 (949). Puerto Maldonado: 2009 (759), 2010 (1512), 2011 (1434), 2012 (1458), 2013 (1295), 2014 (1014), 2015 (517).
Abbreviations: CI, confidence interval; PY, person-years.
aJune 2009 through July 2015 for Lima, Cuzco, and Puerto Maldonado and June 2009 through July 2014 for Tumbes.
bHealth system utilization: ratio of the medically attended influenza episodes over total cases of influenza (B /A) × 100.
cComplete years from 2011 to 2014 for Lima and Cuzco, 2011 to 2013 for Tumbes, and 2012 to 2014 for Puerto Maldonado.
Incidence of Influenza-like Illness, Laboratory-Confirmed Influenza, Influenza-Associated Hospitalizations, and Influenza Vaccine Coverage by Age Category, Peru Influenza Cohort Study, 2009–2015, All Sites Combineda
| Age Group, y | Influenza-like Illness per 1000 PYa | Influenza A and B per 1000 PYa | Influenza Vaccination per 100 PYb | |||||||
|---|---|---|---|---|---|---|---|---|---|---|
| Overall | Overall | Medically Attended | Hospitalization | Overall | ||||||
| Incidence | (95% CI) | Incidence | (95% CI) | Incidence | (95% CI) | Incidence | (95% CI) | Rate | (95% CI) | |
| <2 | 1697 | (1626–1771) | 214 | (190–241) | 138 | (119–160) | 4.8 | (1.9–10) | 27 | (24–31) |
| 2–4 | 1225 | (1180–1271) | 256 | (236–277) | 131 | (117–146) | 2.2 | (.8–4.9) | 25 | (23–28) |
| 5–11 | 588 | (568–609) | 204 | (192–217) | 97 | (89–106) | 0.4 | (.1–1.2) | 9 | (8–10) |
| 12–17 | 318 | (302–335) | 112 | (103–123) | 34 | (29–40) | … | … | 5.5 | (4.7–6.5) |
| 18–49 | 186 | (180–193) | 51 | (48–55) | 19 | (17–21) | 0.4 | (.2–.8) | 6.4 | (6.0–6.9) |
| 50–64 | 190 | (177–204) | 51 | (45–59) | 21 | (17–26) | 0.8 | (.2–2.1) | 13 | (11–14) |
| ≥65 | 196 | (175–219) | 36 | (28–47) | 16 | (11–26) | 0.6 | (.03–3.1) | 26 | (23–29) |
| Overall | 384 | (378–391) | 100 | (97–104) | 44 | (42–46) | 0.7 | (.4–1.0) | 10.2 | (9.7–10.6) |
Person-years by age group: <2 years (1253), 2–4 years (2264), 5–11 years (5317), 12–17 years (4480), 18–49 years (16518), 50–64 years (3922), ≥65 years (1599).
Abbreviations: CI, confidence interval; PY, person-years.
aJune 2009 through July 2015 for Lima, Cuzco, and Puerto Maldonado and June 2009 through July 2014 for Tumbes.
bComplete years from 2011 to 2014 for Lima and Cuzco, 2011 to 2013 for Tumbes, and 2012 to 2014 for Puerto Maldonado.
Influenza Incidence and Seasonal Trends
A total of 12827 samples (94% of samples collected) were tested for influenza viral RNA by rRT-PCR, of which 3542 (28%) were positive, including 1361 (38%) influenza A(H3N2), 1092 (31%) influenza B, 1081 (31%) influenza A(H1N1)pdm09, 4 (0.1%) seasonal influenza A(H1N1), and 3 (0.1%) coinfections with A(H1N1)pdm09 and A(H3N2) viruses. The median age of influenza cases was 11 years (IQR, 5–24). The incidence of influenza was 100/1000 PY (95% CI, 97–104) among all age groups (Table 2). The incidence was lowest in Cuzco (83/1000 PY [95% CI, 77–89]) and similar among the other study sites (range, 104–108/1000 PY) (Table 2). Children had the highest influenza incidence, peaking at age 2–4 years (256/1000 PY [95% CI, 236–277]), with a sharp drop after age 11 and then progressively diminishing with increasing age (Table 3).
The annual incidence of influenza among all age groups and sites ranged from 43/1000 PY in 2011 to 153/1000 PY in 2009 during the influenza A(H1N1) 2009 pandemic (Tables 2 and 3). There was a clear predominance of influenza A(H1N1)pdm09 in 2009, influenza A(H3N2) in 2010 and 2011, influenza B in 2012, influenza A(H1N1)pdm09 in 2013, and influenza A(H3N2) in 2015 (Figure 2).
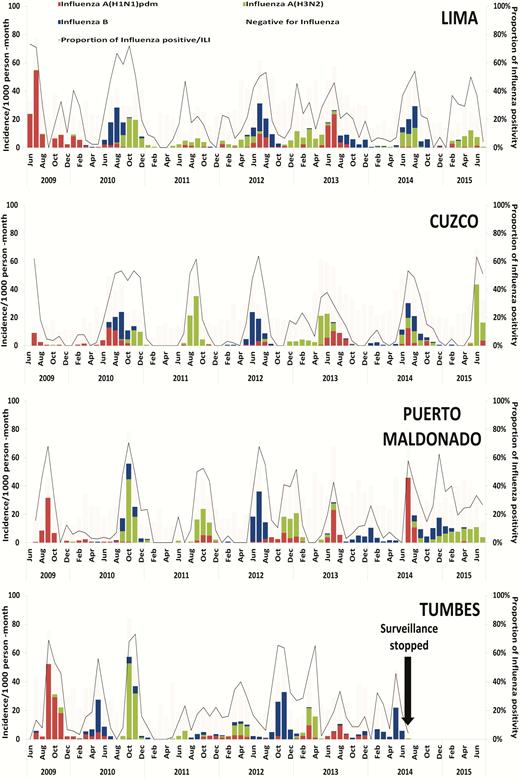
Laboratory-confirmed influenza incidence per 1000 person-months by virus type and subtype and percentage of positives for influenza A and B, Peru Influenza Cohort Study, 2009–2015. Abbreviation: ILI, influenza-like illness.
Although differences were observed between the 4 study sites, the timing of peak influenza incidence and seasonality of influenza virus circulation was generally similar (Figure 3). Influenza epidemics generally occurred each year during the austral winter (May–September), accounting for an average of 61% of the annual cases (Figure 3). However, temporal variation between sites was occasionally observed, most notably in Tumbes, where a bimodal pattern was seen, with a modest rise in influenza incidence during March through May (early austral winter) and a larger second peak during late winter (September through November). There was also occasional notable interseason circulation of specific viruses at specific sites, such as the spike of influenza A(H3N2) virus infection in Lima during the summer (December through May) of 2012–2013.
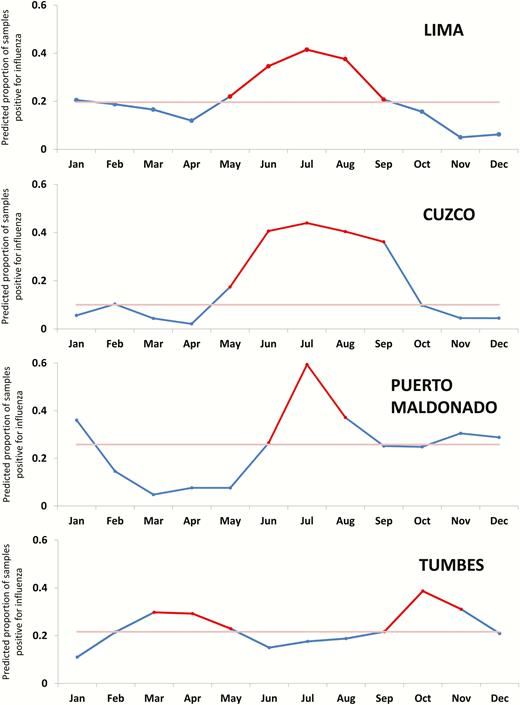
Predicted influenza activity in the Peru Influenza Cohorts. The red portion of each data line indicates the seasonal epidemic period; light red line is the median (June 2011 through July 2015 for Lima, Cuzco, and Puerto Maldonado and June 2011 through July 2014 for Tumbes).
Health System Utilization
Less than half (44% [95% CI, 35%–54%]) of participants with influenza sought medical care (either ambulatory or inpatient) (Table 2). The rate of at least 1 visit to a health center during a bout of influenza was 44/1000 PY (95% CI, 42–46). The highest rate of medically attended influenza was observed in children aged <2 years (138/1000 PY [95% CI, 119–160]) and the lowest was in older adults (16/1000 PY [95% CI, 11–26]) (Table 3). Health system utilization was higher in Tumbes (56% [95% CI, 47%–65%]) and Lima (49% [95% CI, 39%–58%]) than in Cuzco (35% [95% CI, 26%–46%]) and Puerto Maldonado (33% [95% CI, 25%–43%]) (Table 3).
Influenza-Associated Hospitalizations and Deaths
The overall incidence of influenza-associated hospitalization was 0.7/1000 PY and was highest among children aged <2 years (4.8/1000 PY) (Table 3). Overall incidence of influenza-associated hospitalizations among adults ranged from 0.4 to 0.8/1000 PY. We identified only 1 influenza-associated death—a 42-year-old man without preexisting medical conditions who died during the 2009 pandemic from complications of influenza A(H1N1)pdm09 virus infection.
Influenza Vaccination Rates
The overall vaccination rate was 10.2/100 PY (95% CI, 9.7–10.6) but varied among sites, being higher in Tumbes (16/100 PY [95% CI, 15–17]) and Lima (10/100 PY [95% CI, 9–11]) compared with Cuzco and Puerto Maldonado (both 7/100 PY [95% CI, 6–8]). Overall vaccination rates were similar in 2011 (11/100 PY [95% CI, 10–12]), 2012 (12/100 PY [95% CI, 11–13]), and 2013 (11/100 PY [95% CI, 10–12]) but lower in 2014 (3.5/100 PY [95% CI, 3–4]). Among all sites, influenza vaccination rates were similar among children aged <5 years (26/100 PY [95% CI, 24–28]) and the elderly (26/100 PY [95% CI, 23–29]) (Table 3).
DISCUSSION
Extrapolating the 6 years of our active household surveillance study to the general population, we estimate that influenza virus infection caused approximately 1 in 10 persons to become ill each year in Peru. The incidence was especially high among children aged <5 years, ranging across study sites from 214 to 256/1000 PY, for whom influenza accounted for approximately 16% of all episodes of ILI. The observed influenza incidence in Peru was higher than estimates from Kenya (all ages: 7–9/1000 PY; children aged <5 years: 22–30/1000 PY) [21], China (all ages: 4–19/1000 PY; <5 years: 34–95/1000 PY) [22], and the United States (all ages: 10/1000 PY; <5 years: 4–13/1000 PY) [23]. The observed difference between Peru and other sites is likely explainable, in part, by the active surveillance strategy of our study; less than half (44%) of episodes of influenza resulted in medical care seeking, and would thus have been missed through routine passive surveillance health center–based approaches.
Comparable studies conducted using community-based active surveillance approaches such as ours are scarce. Estimates from studies in children aged <3 years in Bangladesh, Nicaragua, and the highlands of Peru show a similar annual influenza incidence (150–205/1000 PY) as we estimated in Peru [11, 24, 25]. However, to compare these estimates to the ones in our study, we should note that our study was designed to capture ILI episodes rather than acute respiratory illnesses and thus may have underestimated influenza illnesses that did not meet the ILI case definition. Our study is similar in scope and design to one conducted in the Amazon Basin of Peru from 2008 to 2009 that reported annual influenza incidence of 16/1000 PY among the general population and 37/1000 PY among children aged <5 years [26]. The higher overall influenza illness rates observed in our study may be due to our use of rRT-PCR rather than cell culture to diagnose influenza.
The finding of peak influenza incidence during the austral winter is consistent with previous reports [3, 5, 20]. Whether the distinct seasonal patterns noted in Tumbes, and the aberration in incidence of influenza A(H1N1)pdm09 virus infection in Cuzco in 2009, relate to climatic, behavioral, or vaccination coverage or timing remains to be determined. Cuzco is one of Peru’s top tourist destinations, which would make it particularly vulnerable to pandemic spread. The lower observed incidence there may simply reflect having missed the wave of earlier influenza A(H1N1)pdm09 virus introduction and associated disease before the study surveillance began in June 2009. Phylogenetic analysis of influenza A(H3N2) virus samples from this study demonstrated interseasonal extinction of Peruvian lineages, with extensive mixing with global clades, especially in Lima and Puerto Maldonado [27].
Despite similar influenza incidence between study sites, there were notable differences in the rates of health system utilization and influenza vaccination coverage. In Tumbes and Lima, approximately half of the influenza cases sought medical care compared to 35% or less in Cuzco and Puerto Maldonado. Lower health system utilization in Cuzco and Puerto Maldonado may have impacted influenza vaccination coverage, which was also lower in these 2 sites. These differences may be related to cultural practices, socioeconomic status, and access to healthcare—all factors that may be important to consider when public health officials estimate the burden of respiratory viruses from medically attended visits alone [28]. The burden of disease may be especially underestimated in countries where healthcare utilization is particularly low. For example, reported ambulatory healthcare utilization for ILI in Bangladesh in 2008–2010 was only 20% [29]. Influenza vaccination coverage was generally low for all age groups, but similar to that observed in other countries in Latin America [13]. Further studies to identify potential barriers and facilitators to healthcare utilization and influenza vaccination should be considered [30].
One percent of influenza episodes resulted in hospitalization in our study, with the highest rates among young children, although only 1 influenza-related death was noted. Similar hospitalization rates for influenza were reported from modeling estimations from Central American countries during 2009–2012 (0.2–3.6/1000 PY in children aged <5 years and 0.2–1.1/1000 PY in persons aged ≥65 years) [31]. Hospitalization rates among older adults in our study, however, were lower than in high-income countries (0.6/1000 PY vs 6–42/1000 PY) [32, 33]. We speculate these differences might be due to lower healthcare seeking among older adults in Peru compared with those in high-income settings. Despite these overall low rates of influenza-associated hospitalization and death, the high morbidity in children and resultant associated economic costs [14] nevertheless strongly support the WHO-SAGE recommendation for targeting young children for annual influenza vaccination [10]. Peru might also explore the potential value of expanding influenza vaccination to school-aged children (eg, 5–11 years) in hopes of an overall reduction of influenza-associated illness among all ages by indirect protection [34, 35]. Our seasonal incidence data suggest that the impact of influenza vaccine would be maximized by timing vaccination to just before the primary epidemic period in Peru’s austral winter, which is immediately preceded by Vaccination Week of the Americas, a Pan American Health Organization–led event that occurs every April [13].
Our study had limitations that likely resulted in an underestimation of the incidence of symptomatic influenza. We used an ILI case definition based on the presence of fever and, therefore, missed cases in which fever was not present, which frequently occurs in very young or old persons with influenza [36]. We also likely underestimated the burden of influenza because we did not collect respiratory specimens for laboratory testing from mildly ill or well household members for rRT-PCR or serum for influenza serological testing, and therefore did not assess subclinical and asymptomatic influenza virus infections as noted in other studies [37, 38]. Last, our study provides conservative estimates of influenza-associated hospitalizations and deaths, as it was designed to estimate the incidence of influenza-associated ILI.
Our study provides valuable estimates of the burden of influenza from a multisite, community-based active surveillance cohort reflecting different ecological niches in South America. Such estimates allow for a better understanding of the true burden and seasonality of influenza disease in the region that is essential to inform influenza prevention and control in priority groups (eg, young children and elderly) and to optimize resource allocation when designing similar studies, as well as the timing and economic benefit of national influenza vaccination programs [10]. The burden of influenza in Peru is comparable to that of countries that annually invest in influenza vaccination among WHO-SAGE target groups. The feasibility of similar approaches to improve influenza vaccine coverage in Peru should be explored.
Notes
Author contributions. J. M. M., T. M. U., H. R. R., and Y. O. T. contributed to the conception and design of the study; Y. O. T. did the data analysis and wrote the first draft of the report. J. M. M., D. G. B., E. A.-B., T. M. U., and M. R. K. were involved in the revision of the manuscript for clarity and content. C. R., M. P. S., M. E. S., G. M. S., M.-A. W., and R. H. G. did critical revision of manuscript. All authors contributed to the interpretation of the results of the analysis and to the revision and final preparation of the report for submission.
Acknowledgments. The authors acknowledge the influenza staff from each of the sites in Lima, Cuzco, Tumbes, and Puerto Maldonado; and the community members of San Juan de Miraflores, San Jacinto, San Jeronimo, and Puerto Maldonado districts.
Disclaimer. The views expressed in this article are those of the authors and do not necessarily reflect the official policy or position of the US Department of Defense, the US Centers for Disease Control and Prevention (CDC), or the US government. The study protocol was approved by the NAMRU-6 Institutional Review Board (protocol NMRCD.2009.005) in compliance with all applicable federal regulations governing the protection of human subjects.
Financial support. This work was supported by the NAMRU-6 Interagency agreement with the Centers for Disease Control and Prevention (CDC) ; the National Institutes of Health, Fogarty International Center (5D43TW007393-03 to Y. O. T.); and the US Department of Defense Global Emerging Infections System (I0082_09_LI).
Potential conflicts of interest. All authors: No reported conflicts of interest. All authors have submitted the ICMJE Form for Disclosure of Potential Conflicts of Interest. Conflicts that the editors consider relevant to the content of the manuscript have been disclosed.
References
Peru Influenza Cohorts Working Group
Ernesto Ortiz, Carolina Guevara, Claudia Guezala, Carlos Figueroa, Sebastian Loli, Alberto Laguna, Eric Halsey, Erik Reaves, Maya Williams, Christopher Mores, Wesley Campbell, Hugo H. García, Armando E. González.
Author notes
D. G. B. and J. M. M. contributed equally to this work.
Members of the Peru Influenza Cohorts Working Group are listed after the References.

