


Abstract
Low and deficient levels of vitamin A are common in low- and middle-income countries where tuberculosis burden is high. We assessed the impact of baseline levels of vitamin A and carotenoids on tuberculosis disease risk.
We conducted a case-control study nested within a longitudinal cohort of household contacts (HHCs) of pulmonary tuberculosis case patients in Lima, Peru. We defined case patients as human immunodeficiency virus (HIV)–negative HHCs with blood samples in whom tuberculosis disease developed ≥15 days after enrollment of the index patient. For each case patient, we randomly selected 4 controls from among contacts in whom tuberculosis disease did not develop, matching for sex and year of age. We used conditional logistic regression to estimate odds ratios for incident tuberculosis disease by vitamin A and carotenoids levels, controlling for other nutritional and socioeconomic factors.
Among 6751 HIV-negative HHCs with baseline blood samples, 192 had secondary tuberculosis disease during follow-up. We analyzed 180 case patients with viable samples and 709 matched controls. After controlling for possible confounders, we found that baseline vitamin A deficiency was associated with a 10-fold increase in risk of tuberculosis disease among HHCs (adjusted odds ratio, 10.53; 95% confidence interval, 3.73–29.70; P < .001). This association was dose dependent, with stepwise increases in tuberculosis disease risk with each decreasing quartile of vitamin A level.
Vitamin A deficiency strongly predicted the risk of incident tuberculosis disease among HHCs of patients with tuberculosis. Vitamin A supplementation among individuals at high risk of tuberculosis may provide an effective means of preventing tuberculosis disease.
Although tuberculosis incidence and mortality have fallen steadily over the past 150 years in Europe and North America, tuberculosis remains one of the top global causes of death from infectious disease. The World Health Organization reported 10.4 million incident tuberculosis cases and 1.8 million associated deaths in 2015, the vast majority occurring in low- and middle-income countries [1]. In high-income countries, tuberculosis declined before the availability of either BCG vaccine or effective chemotherapy, a trend attributed to improvements in socioeconomic status [2]. Country-level data also show an inverse linear association between per capita gross domestic product and tuberculosis incidence [3] and show that a nation’s human development index strongly predicts changes in tuberculosis incidence over time [4].
Multiple lines of evidence suggest that the association between socioeconomic status and tuberculosis may be mediated through nutritional status. Studies in both humans and animals demonstrate a link between undernutrition and tuberculosis [5]. In vitro studies also provide insight into specific antimycobacterial mechanisms mediated by micronutrients [6, 7]. Although multiple studies document micronutrient deficiencies in persons with tuberculosis disease [8–10], few prospective studies have assessed preexisting nutritional status as a determinant of progression from tuberculosis infection to disease [11–15]. Notably, studies of vitamin A and tuberculosis have generally been conducted in populations at low risk for both nutritional deficits and tuberculosis, and their results have been inconclusive [14, 15].
Despite the lack of data on tuberculosis risk, multiple previous studies support the role of vitamin A in immune responses to infection. Based on studies conducted in both animals and humans, Green, Mellanby, and colleagues [16–18] first proposed in the 1920s that vitamin A is an “anti-infective” agent. Subsequently, in one of the earliest reported clinical trials, Ellison [19] showed that vitamin A supplementation reduced mortality in children with measles by 58%. Current evidence demonstrates that vitamin A deficiency (VAD) contributes to deaths from diarrheal diseases and measles, accounting for 1.7% of all deaths in children <5 years old in low- and middle-income countries [20]. In the current study, we assessed the association between baseline levels of vitamin A and carotenoids and the risk of tuberculosis disease among household contacts (HHCs) of patients with pulmonary tuberculosis in Lima, Peru.
METHODS
The study was approved by the Institutional Review Board of Harvard School of Public Health and the Research Ethics Committee of the National Institute of Health of Peru. All participants or guardians provided written informed consent.
Setting and Study Design
We conducted a case-control study nested within a prospective longitudinal cohort of HHCs of tuberculosis case patients in Lima, Peru. The study area includes approximately 3.3 million residents in urban areas and periurban, informal shantytown settlements. Between September 2009 and August 2012, we identified index patients aged ≥15 years with a diagnosis of pulmonary tuberculosis at 106 participating health centers. Within 2 weeks of enrolling an index patient, we enrolled his or her HHCs and screened them for tuberculosis disease. HHCs with symptoms were referred for sputum smear microscopy and mycobacteriology culture and treatment, according to Peru’s national guidelines [21]. HHCs aged ≤19 years and individuals with specified comorbid conditions were offered isoniazid preventive therapy (IPT).
On enrollment of HHCs, we collected the following data: age, sex, height, weight, BCG vaccination scars, IPT use, alcohol and tobacco use, self-reported diabetes mellitus, comorbid conditions (heart disease, high blood pressure, asthma, kidney disease, use of steroids or chemotherapy or immunosuppressant, and any other self-reported chronic illness), tuberculosis disease history, and housing asset information. In HHCs without prior history of tuberculosis infection or disease, we performed a tuberculin skin test (TST). We offered human immunodeficiency virus (HIV) testing and invited all HHCs to provide a venous blood sample; 60% of those ≥10 years old provided this sample.
All HHCs were evaluated for signs and symptoms of pulmonary and extrapulmonary tuberculosis disease at 2, 6, and 12 months after enrollment. We considered HHCs to have incident secondary tuberculosis disease if the diagnosis was confirmed by a health center physician >14 days after enrollment of the index patient and to have coprevalent disease if the diagnosis was earlier. We defined secondary tuberculosis disease in HHCs <18 years old according to consensus guidelines for diagnosis of tuberculosis disease in children [22].
We defined case patients as HIV-negative HHCs in whom incident secondary tuberculosis disease developed during 1 year of follow-up. We randomly selected 4 controls for each case patients from among HHCs in whom tuberculosis disease did not develop within 1 year, matching for sex and age by year.
Laboratory Methods
We stored serum samples at –80oC after collection until analysis at end of study follow-up. Laboratory personnel were unaware of the specimens’ case-control status. All samples were handled identically and assayed randomly. Levels of retinol and carotenoids (lutein + zeaxanthin, β-cryptoxanthin, total lycopene, α-carotene, and total β-carotene) were measured using high- performance liquid chromatography [23]. The interassay coefficients of variation for retinol and carotenoids were <5%. We measured levels of total 25-hydroxyvitamin D with a commercial competitive enzyme immunoassay kit (Immunodiagnostic Systems). The coefficient of variation at different levels of 25-hydroxyvitamin D ranged from 4.6% to 8.7%.
Statistical Analysis
We defined VAD as a serum retinol level <200 µg/L (<0.70 µmol/L) [24] and vitamin D deficiency, insufficiency, and sufficiency as serum 25-hydroxyvitamin D levels of <50, 50–75, and >75 nmol/L, respectively [11, 25]. We calculated body mass index (BMI) as weight in kilograms divided by square of height in meters. For children and adolescent HHCs (<20 years old), we used World Health Organization age- and sex-specific BMI z-score tables to classify those with BMI z scores below –2 as underweight and those with z score above 2 as overweight [26]. For adults (≥20 years old), we classified nutritional status as: underweight (BMI, <18.5 kg/m2), normal (18.5 to <25 kg/m2), or overweight (≥25 kg/m2). We classified HHCs as heavy drinkers if they drank ≥40 g or ≥3 alcoholic drinks daily. We derived a socioeconomic status score using principal components analysis of housing asset weighted by household size [27]. We considered HHCs to be infected with tuberculosis at baseline if they reported previous tuberculosis disease or a positive TST or had a TST result ≥10 mm at enrollment.
We constructed conditional logistic regression models to evaluate the association between quartiles of vitamin A and carotenoids levels and risk of tuberculosis disease. We performed tests for linear trend across quartiles. Multivariable-adjusted models included baseline covariates identified a priori as potential confounders and predictors of tuberculosis disease (BMI, socioeconomic status, alcohol and tobacco use, receipt of IPT, tuberculosis disease history, comorbid disease, self-reported diabetes mellitus, index patient smear status, and presence of >1 case patient in household). We also assessed the impact of VAD on incident tuberculosis disease and examined the interaction between VAD and vitamin D deficiency on tuberculosis disease risk. We stratified the final adjusted models by age. Under our method of control selection, odds ratios (ORs) approximate risk ratios because secondary tuberculosis disease was rare in this cohort [28].
In sensitivity analyses, we stratified by baseline tuberculosis infection status and separately restricted the analysis to case patients (and their matched controls) with diagnosis ≥90 days after index patient enrollment. Finally, we repeated our analyses for case patients (and their matched controls) with microbiologically confirmed tuberculosis.
RESULTS
Among 6751 HIV-negative HHCs with blood samples, tuberculosis disease developed in 258; disease was coprevalent in 66 and secondary in 192. Pulmonary disease accounted for 236 cases (91.5%), and extrapulmonary for 16 (6.2%). Of 180 secondary tuberculosis cases with viable blood samples, 147 (81.7%) were microbiologically confirmed (Figure 1). Table 1 shows baseline characteristics of case patients and controls. Case patients had lower baseline median levels of vitamin A and carotenoids than controls (Table 2). Although the pro–vitamin A carotenoids, β-cryptoxanthin, α-carotene, and β-carotene contribute to retinol levels, we found that they were not correlated with measured retinol levels (R = 0.04–0.10).
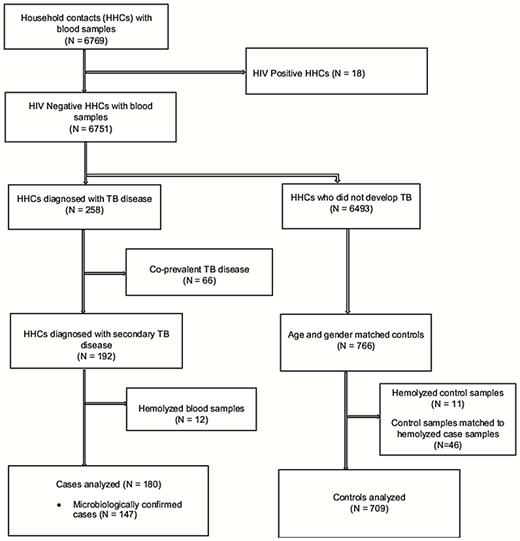
Flow diagram for nested case-control study. Abbreviations: HHCs, household contacts; HIV, human immunodeficiency virus; TB, tuberculosis.
Baseline Characteristics of Case Patients With Incident Tuberculosis and Matched Controls
| Characteristic | No. (%) | |
|---|---|---|
| Case Patients (n = 180)a | Controls (n = 709)b | |
| Age category | ||
| <10 y | 4 (2.2) | 16 (2.3) |
| 10–19 y | 50 (27.8) | 200 (28.2) |
| ≥20 y | 126 (70.0) | 493 (69.5) |
| Male sex | 94 (52.2) | 366 (51.6) |
| BMI category | (n = 179) | (n = 706) |
| Underweight | 8 (4.5) | 6 (0.9) |
| Overweight | 45 (25.1) | 299 (42.4) |
| Normal | 126 (70.4) | 401 (56.8) |
| Socioeconomic status | (n = 171) | (n = 698) |
| Low | 77 (45.0) | 228 (32.7) |
| Middle | 66 (38.6) | 326 (46.7) |
| High | 28 (16.4) | 144 (20.6) |
| Heavy alcohol use | 14 (8.1) (n = 174) | 64 (9.3) (n = 692) |
| Current smoking | 13 (7.4) (n = 176) | 78 (11.2) (n = 699) |
| Self-reported diabetes | 6 (3.4) (n = 179) | 11 (1.6) (n = 701) |
| Comorbid disease | 37 (20.6) | 175 (24.7) |
| Isoniazid preventive therapy | 7 (3.9) | 108 (15.2) |
| BCG vaccine scar | 159 (88.3) | 628 (88.6) |
| History of tuberculosis | 34 (18.9) | 55 (7.8) (n = 708) |
| Tuberculosis infection at baseline | 145 (82.4) (n = 176) | 281 (41.1) (n = 683) |
| Smear positive | 156 (86.7) | 486 (68.7) (n = 707) |
| Cavitary disease | 54 (30.2) (n = 179) | 175 (25.1) (n = 697) |
Abbreviation: BMI, body mass index; BCG, Bacillus Calmette-Guerin.
aData available in 180 case patients except where noted otherwise.
bData available in 709 controls except where noted otherwise.
Baseline Levels of Micronutrients Among Case Patients and Controls
| Micronutrient | Median Level (IQR)a | P Valueb | |
|---|---|---|---|
| Case Patients (n = 180) | Controls (n = 709) | ||
| Vitamin A, µg/L | 316.5 (250.5–381.4) | 373.6 (310.4–460.2) | <.001 |
| Vitamin A deficient (<200 µg/L), No. (%) | 24 (13.3) | 16 (2.3) | <.001 |
| 25-hydroxyvitamin vitamin D, nmol/L | 53.9 (42.7–64.0) | 54.7 (44.5–67.1) | >.99 |
| Vitamin D category, No. (%) | |||
| Deficient (<50 nmol/L) | 76 (42.2) | 259 (36.5) | .13 |
| Insufficient (50–75 nmol/L) | 84 (46.7) | 348 (49.1) | .45 |
| Sufficient (>75 nmol/L) | 20 (11.1) | 102 (14.4) | Reference |
| Lutein + zeaxanthin, µg/L | 150.5 (111.1–186.1) | 153.6 (121.5–201.8) | .02 |
| β-cryptoxanthin, µg/L | 107.3 (68.2–196.7) | 142.3 (85.5–240.5) | .04 |
| Total lycopene, µg/L | 99.7 (64.9–147.3) | 112.9 (77.6–164.5) | .03 |
| α-Carotene, µg/L | 65.3 (44.2–97.1) | 75.8 (52.6–110.0) | .04 |
| Total β-carotene, µg/L | 123.2 (67.9–192.4) | 138.0 (86.3–216.4) | .07 |
Abbreviation: IQR, interquartile range.
aData represent median level (IQR) unless otherwise specified as No. (%).
bUnivariate P values adjusted for matching factors (age and sex).
Table 3 demonstrates significant univariate associations between incident tuberculosis disease and baseline quartiles of vitamin A, lutein + zeaxanthin, β-cryptoxanthin, total lycopene, and α-carotene levels. After multivariable adjustment for matching factors and confounders, HHCs in the lowest quartile of vitamin A levels had 6 times the risk of tuberculosis disease of those in the highest quartile (OR, 6.38; 95% confidence interval [CI], 2.82–14.46; P for trend < .001) [Table 3]. Lower levels of β-cryptoxanthin (OR for lowest vs highest quartile, 2.75; 95% CI, 1.42–5.33; P for trend = .003) were also associated with increased risk of tuberculosis disease.
Micronutrient Levels by Quartile and the Risk of Tuberculosis Disease among Household Contacts of Index Tuberculosis Case Patients (n = 889)
| Micronutrient | Quartiles of Micronutrient Level | P Value for Trend | |||
|---|---|---|---|---|---|
| Quartile 1 (Lowest) | Quartile 2 | Quartile 3 | Quartile 4 (Highest) | ||
| Vitamin A | |||||
| Case patients/controls, No. | 76/146 | 45/177 | 41/182 | 18/204 | … |
| Median level (range), µg/L | 258.0 (53.1–296.2) | 332.1 (297.5–363.8) | 396.5 (363.8–441.7) | 510.4 (441.7–929.9) | … |
| Univariate OR (95% CI) | 9.34 (4.98–17.51) | 4.22 (2.24–7.96) | 3.02 (1.65–5.53) | 1.00 | <.001 |
| Multivariate ORa (95% CI) | 6.38 (2.82–14.46) | 3.57 (1.60–7.96) | 2.95 (1.34–6.51) | 1.00 | <.001 |
| Lutein + zeaxanthin | |||||
| Case patients/controls, No. | 56/166 | 40/182 | 52/171 | 32/190 | … |
| Median level (range), µg/L | 98.0 (25.8–119.2) | 135.5 (119.3–153.1) | 174.5 (153.2–196.2) | 243.2 (196.7–529.9) | … |
| Univariate OR (95% CI) | 2.03 (1.25–3.29) | 1.33 (.80–2.23) | 1.84 (1.13–3.01) | 1.00 | .01 |
| Multivariate ORa (95% CI) | 1.99 (1.08–3.66) | 0.85 (.44–1.66) | 2.06 (1.10–3.87) | 1.00 | .14 |
| β-Cryptoxanthin | |||||
| Case patients/controls, No. | 61/161 | 48/174 | 37/186 | 34/188 | … |
| Median level (range), µg/L | 60.8 (3.9–81.2) | 103.9 (81.6–132.6) | 171.8 (132.6–228.2) | 339.7 (228.5–1778.4) | … |
| Univariate OR (95% CI) | 2.17 (1.33–3.53) | 1.57 (.94–2.62) | 1.14 (.68–1.91) | 1.00 | .002 |
| Multivariate ORa (95% CI) | 2.75 (1.42–5.33) | 1.96 (1.02–3.77) | 1.63 (.82–3.22) | 1.00 | .003 |
| Total lycopene | |||||
| Median level (range), µg/L | 55.8 (5.4–75.0) | 89.4 (75.0–108.7) | 133.0 (108.8–160.7) | 209.4 (162.0–724.5) | … |
| Case patients/controls, No. | 56/166 | 47/175 | 39/184 | 38/184 | … |
| Univariate OR (95% CI) | 1.64 (1.04–2.60) | 1.30 (.81–2.09) | 1.03 (.63–1.68) | 1.00 | .03 |
| Multivariate ORa (95% CI) | 1.47 (.83–2.61) | 1.27 (.71–2.27) | 0.97 (.53–1.80) | 1.00 | .17 |
| α-Carotene | |||||
| Median level (range), µg/L | 39.1 (4.2–51.7) | 62.3 (51.7–73.3) | 89.1 (73.3–107.7) | 144.6 (108.1–1282.8) | … |
| Case patients/controls, No. | 53/169 | 53/169 | 38/185 | 36/186 | … |
| Univariate OR (95% CI) | 1.65 (1.02–2.65) | 1.64 (1.01–2.64) | 1.06 (.64–1.76) | 1.00 | .02 |
| Multivariate ORa (95% CI) | 1.58 (.86–2.91) | 1.70 (.93–3.10) | 1.06 (.55–2.03) | 1.00 | .06 |
| Total β-carotene | |||||
| Median level (range), µg/L | 56.4 (4.8–84.7) | 108.2 (84.8–136.4) | 162.1 (136.5–212.1) | 305.9 (212.4–1452.1) | … |
| Case patients/controls, No. | 54/168 | 42/180 | 44/179 | 40/182 | … |
| Univariate OR (95% CI) | 1.51 (.94–2.44) | 1.07 (.66–1.75) | 1.15 (.71–1.85) | 1.00 | .16 |
| Multivariate ORa (95% CI) | 1.59 (.86–2.93) | 1.28 (.70–2.34) | 1.21 (.65–2.26) | 1.00 | .15 |
Abbreviations: CI, confidence interval; OR, odds ratio.
aAdjusted for matching factors (age and sex), body mass index categories, socioeconomic status, heavy alcohol consumption, tobacco use, isoniazid preventive therapy, tuberculosis history, comorbid disease, self-reported diabetes mellitus, index patient smear status, and presence of >1 tuberculosis case in household.
Table 4 provides univariate and adjusted ORs for VAD. HHCs with baseline VAD had 10.53-fold increased risk of incident tuberculosis disease (95% CI, 3.73–29.70; P < .001). Results of a statistical test for interaction between vitamins A and D deficiencies were not significant (P for interaction = .24; Table 5).
Association between Baseline Characteristics and Risk of Tuberculosis Disease
| Characteristic | Univariate OR (95% CI) (n = 889) | P Value | Multivariate ORb (95% CI) (n = 822) | P Value |
|---|---|---|---|---|
| BMI categories (n = 885)a | ||||
| Underweight | 4.14 (1.32–12.94) | .01 | 2.37 (.30–18.48) | .41 |
| Overweight | 0.39 (.26–.60) | <.001 | 0.37 (.22–.62) | <.001 |
| Normal | 1.00 | 1.00 | ||
| Socioeconomic status (n = 869) | ||||
| Low | 1.69 (1.16–2.47) | .01 | 1.61 (.98–2.64) | .06 |
| Middle | 1.00 | 1.00 | ||
| High | 0.95 (.59–1.55) | .85 | 1.13 (.62–2.07) | .68 |
| Heavy alcohol use (n = 866) | 0.83 (.45–1.45) | .55 | 0.76 (.31–1.88) | .56 |
| Current smoking (n = 875) | 0.62 (.33–1.15) | .13 | 0.77 (.35–1.70) | .52 |
| Isoniazid preventive therapy | 0.16 (.07–.39) | <.001 | 0.14 (.05–.42) | .001 |
| History of tuberculosis (n = 888) | 2.89 (1.78–4.70) | <.001 | 2.11 (1.07–4.18) | .03 |
| Comorbid disease | 0.78 (.51–1.18) | .23 | 0.93 (.54–1.59) | .79 |
| Self-reported diabetes mellitus (n = 880) | 2.38 (.83–6.84) | .11 | 3.13 (.80–12.17) | .10 |
| Index patient smear positive (n = 887) | 2.96 (1.87–4.69) | <.001 | 2.98 (1.66–5.37) | <.001 |
| VAD (level <200 µg/L) | 7.65 (3.72–15.71) | <.001 | 10.53 (3.73–29.70) | <.001 |
Abbreviations: BMI, body mass index; CI, confidence interval; OR, odds ratio; VAD, vitamin A deficiency.
aSample sizes represent total number of subjects with data for corresponding variable, otherwise sample size is 889.
bAdjusted for matching factors (age and sex), vitamin D levels, BMI categories, socioeconomic status, heavy alcohol consumption, tobacco use, isoniazid preventive therapy, tuberculosis history, comorbid disease, self-reported diabetes mellitus, index patient smear status, and presence of >1 tuberculosis case in household.
Interaction Between Vitamin A and Vitamin D Levels for Risk of Tuberculosis Disease
| Vitamin A and D Levels | Case Patients, No./Controls, No. | Multivariate OR (95% CI)a | P Value b |
|---|---|---|---|
| Both VAD and VDD | 12/9 | 6.38 (1.77–22.97)c | .005 |
| VAD without VDD | 12/7 | 24.04 (3.96–145.90)d | <.001 |
| No VAD or VDD | 92/443 | 1.00 | … |
| Vitamin A and D Levels | Case Patients, No./Controls, No. | Multivariate OR (95% CI)a | P Value b |
|---|---|---|---|
| Both VAD and VDD | 12/9 | 6.38 (1.77–22.97)c | .005 |
| VAD without VDD | 12/7 | 24.04 (3.96–145.90)d | <.001 |
| No VAD or VDD | 92/443 | 1.00 | … |
Abbreviations: CI, confidence interval; OR, odds ratio; VAD, vitamin A deficiency; VDD, vitamin D deficiency.
aAdjusted for matching factors (age and sex), body mass index categories, socioeconomic status, heavy alcohol consumption, tobacco use, isoniazid preventive therapy, tuberculosis history, comorbid disease, self-reported diabetes mellitus, index patient smear status, and presence of >1 tuberculosis case in household.
bP value for interaction = .24
cOR for VAD among household contacts with VDD.
dOR for VAD among household contacts without VDD.
Stratification by age showed that VAD increased the risk of tuberculosis disease nearly 20-fold in 10–19-year-olds (adjusted OR, 18.58; 95% CI, 3.54–97.60; P = .001) and 10-fold in those aged ≥20 years (10.21; 2.43–42.91; P = .002) [Table 6]. Adolescents (aged 10–19 years) in the lowest quartile of carotenoid levels were at higher risk for tuberculosis disease, but there was no effect in older HHCs.
Micronutrient Levels and Risk of Tuberculosis Disease Stratified by Age Category
| Micronutrient Levels by Quartilea | Age 10–19 y | Age ≥ 20 y | ||
|---|---|---|---|---|
| Multivariate ORb (95% CI) (n = 237) | P Value | Multivariate ORb (95% CI) (n = 565) | P Value | |
| Vitamin A <200 µg/L | 18.58 (3.54–97.60) | .001 | 10.21 (2.43–42.91) | .002 |
| Vitamin A level | ||||
| Quartile 1 | 7.72 (2.06–28.91) | .002 | 4.43 (1.83–10.73) | .001 |
| Quartile 2 | 4.83 (1.23–18.92) | .02 | 3.50 (1.46–8.40) | .005 |
| Quartile 3 | 1.00 | 1.65 (.70–3.88) | .25 | |
| Quartile 4 | NAc | 1.00 | ||
| P value for trend | … | .003 | … | <.001 |
| Lutein + zeaxanthin | ||||
| Quartile 1 | 1.68 (.59–4.76) | .33 | 1.61 (.78–3.31) | .19 |
| Quartile 2 | 1.09 (.37–3.20) | .88 | 1.41 (.67–2.96) | .37 |
| Quartile 3 | 0.33 (.08–1.33) | .12 | 2.05 (1.01–4.17) | .05 |
| Quartile 4 | 1.00 | 1.00 | ||
| P value for trend | … | .12 | … | .24 |
| β-Cryptoxanthin | ||||
| Quartile 1 | 4.39 (1.33–14.46) | .01 | 2.00 (.95–4.25) | .07 |
| Quartile 2 | 1.57 (.46–5.34) | .47 | 2.02 (1.00–4.08) | .05 |
| Quartile 3 | 0.97 (.27–3.44) | .96 | 1.64 (.77–3.50) | .20 |
| Quartile 4 | 1.00 | 1.00 | ||
| P value for trend | … | .02 | … | .03 |
| Total lycopene | ||||
| Quartile 1 | 3.56 (1.16–10.92) | .03 | 0.95 (.50–1.82) | .88 |
| Quartile 2 | 1.99 (.65–6.13) | .23 | 0.90 (.46–1.76) | .76 |
| Quartile 3 | 2.41 (.71–8.20) | .16 | 0.66 (.33–1.32) | .24 |
| Quartile 4 | 1.00 | 1.00 | ||
| P value for trend | … | .04 | … | .88 |
| α-Carotene | ||||
| Quartile 1 | 4.54 (1.26–16.32) | .02 | 1.00 (.49–2.03) | 1.00 |
| Quartile 2 | 1.83 (.53–6.30) | .34 | 1.60 (.81–3.15) | .17 |
| Quartile 3 | 1.93 (.55–6.75) | .31 | 0.80 (.38–1.68) | .55 |
| Quartile 4 | 1.00 | … | 1.00 | … |
| P value for trend | … | .03 | … | .55 |
| Total β-carotene | ||||
| Quartile 1 | 2.58 (.82–8.07) | .10 | 1.18 (.58–2.39) | .66 |
| Quartile 2 | 2.51 (.76–8.32) | .13 | 0.97 (.48–1.95) | .92 |
| Quartile 3 | 0.98 (.27–3.48) | .97 | 1.14 (.59–2.24) | .69 |
| Quartile 4 | 1.00 | 1.00 | ||
| P value for trend | … | .05 | … | .77 |
Abbreviations: CI, confidence interval; NA, not applicable; OR, odds ratio.
aQuartile 1 is the lowest, and quartile 4 the highest. All levels were measured in micrograms per liter.
bAdjusted for matching factors (age and sex), body mass index categories, socioeconomic status, heavy alcohol consumption, tobacco use, isoniazid preventive therapy, tuberculosis history, comorbid disease, self-reported diabetes mellitus, and index patient smear status.
cCategorized into tertiles because there were ≤5 case patients in the highest quartile.
To rule out the possibility that VAD in case patients may have resulted from metabolic derangements due to early active tuberculosis disease that was not clinically apparent, we stratified by baseline infection status and found that vitamin A levels remained strongly associated with tuberculosis disease in both groups (Table 7). In a second sensitivity analysis excluding case patients (and their matched controls) with disease diagnosed within 90 days of index patient enrollment, multivariable analysis also showed a strong inverse association between quartiles of vitamin A and tuberculosis disease, although the association with VAD was no longer statistically significant (Table 7).
Vitamin A Levels and Risk of Tuberculosis Disease Stratified by Baseline Infection Status and for Tuberculosis Diagnosed ≥90 Days After Enrollment of Index Case Patients
| Vitamin A Levels by Tuberculosis Status | Case Patients, No./Controls, No. | Multivariate ORb (95% CI) | P Value |
|---|---|---|---|
| Negative for tuberculosis infection at baseline | |||
| Vitamin A | |||
| Quartile 1 | 12/106 | 4.38 (1.24–15.47) | .02 |
| Quartile 2 | 13/144 | 3.71 (1.12–12.33) | .03 |
| Quartile 3 | 6/152 | 1.00 | … |
| Quartile 4 | NAc | … | … |
| P value for trend | … | … | .02 |
| VAD (level <200 µg/L) | 3/8 | 20.32 (2.91–141.70) | .002 |
| Positive for tuberculosis infection at baseline | |||
| Vitamin A | |||
| Quartile 1 | 80/90 | 2.56 (1.17–5.58) | .02 |
| Quartile 2 | 40/89 | 1.83 (.85–3.92) | .12 |
| Quartile 3 | 25/102 | 1.00 | … |
| Quartile 4 | NA | … | … |
| P value for trend | … | … | .02 |
| VAD (level <200 µg/L) | 21/8 | 5.31 (1.63–17.25) | .01 |
| Tuberculosis diagnosed ≥90 d after enrollment of index case patients | |||
| Vitamin A | |||
| Quartile 1 | 27/70 | 4.21 (1.20–14.74) | 0.02 |
| Quartile 2 | 24/73 | 5.25 (1.44–19.10) | 0.01 |
| Quartile 3 | 19/79 | 2.91 (.87–9.77) | 0.08 |
| Quartile 4 | 8/89 | 1.00 | … |
| P value for trend | … | … | .02 |
| VAD (level <200 µg/L) | 3/8 | 2.15 (.33–13.80) | .42 |
Abbreviations: CI, confidence interval; NA, not applicable; OR, odds ratio; VAD, vitamin A deficiency.
aQuartile 1 is the lowest, and quartile 4 the highest. All levels were measured in micrograms per liter.
bAdjusted for matching factors (age and sex), body mass index categories, socioeconomic status, heavy alcohol consumption, tobacco use, isoniazid preventive therapy, tuberculosis history, comorbid disease, self-reported diabetes mellitus, and index patient smear status.
cCategorized into tertiles because there were ≤5 case patients in the highest quartile.
Restricting the analysis to microbiologically confirmed cases further strengthened the association between vitamin A levels and tuberculosis disease (Table 8). We were unable to stratify by IPT use because few HHCs had received IPT.
Vitamin A Levels and Risk of Microbiologically Confirmed Tuberculosis Disease
| Vitamin A Levelsa | All Participants | Age 10–19 y | Age ≥20 y | |||
|---|---|---|---|---|---|---|
| Multivariate ORb (95% CI) (n = 666) | P Value | Multivariate ORb (95% CI) (n = 178) | P Value | Multivariate ORb (95% CI) (n = 487) | P Value | |
| Quartile 1 | 7.51 (2.75–20.54) | <.001 | 8.30 (1.82–37.86) | .01 | 6.95 (2.44–19.79) | <.001 |
| Quartile 2 | 5.71 (2.22–14.67) | <.001 | 2.56 (.49–13.52) | .27 | 4.97 (1.89–13.07) | .001 |
| Quartile 3 | 3.58 (1.40–9.19) | 0.01 | 1.00 | … | 1.60 (.59–4.29) | .35 |
| Quartile 4 | 1.00 | … | NAc | … | 1.00 | … |
| P value for trend | … | <.001 | … | .002 | … | <.001 |
| VAD (level <200 µg/L) | 16.65 (5.36–51.77) | <.001 | 21.41 (3.71–123.48) | .001 | 16.23 (3.12–84.44) | <.001 |
Abbreviations: CI, confidence interval; NA, not applicable; OR, odds ratio; VAD, vitamin A deficiency.
aQuartile 1 is the lowest, and quartile 4 the highest. Vitamin A levels were measured in micrograms per liter.
bAdjusted for matching factors (age and sex), body mass index categories, socioeconomic status, heavy alcohol consumption, tobacco use, isoniazid preventive therapy, tuberculosis history, comorbid disease, self-reported diabetes mellitus, and index patient smear status.
cCategorized into tertiles because there were ≤5 case patients in the highest quartile.
DISCUSSION
In the current study, we found that vitamin A levels strongly predict progression to tuberculosis disease in a cohort of Peruvians with household exposure to an index patient with tuberculosis. This relationship remained strong after adjustment for socioeconomic status, BMI, and other comorbid conditions that might be associated with increased tuberculosis disease risk and lower vitamin A levels. Although the association is most extreme at levels consistent with a diagnosis of VAD, we observed a dose-response relationship with significantly increased risk of tuberculosis disease, even at vitamin A levels usually classified as normal. Carotenoids were also inversely associated with risk of tuberculosis progression among adolescents, although the effect of individual carotenoids was less extreme than for vitamin A.
Although multiple previous studies have documented low vitamin A levels among patients with an active tuberculosis diagnosis [8, 9, 29, 30], the causal direction of this association has been difficult to determine. Active tuberculosis disease can lead to profound weight loss and metabolic disturbances, and the micronutrient deficiencies observed in patients often improve or resolve with successful tuberculosis treatment [30]. To date, to our knowledge, no published studies have reported on the impact of vitamin A supplementation on incident tuberculosis disease, and clinical trials have demonstrated little impact of supplementation on tuberculosis treatment outcomes [30].
In contrast to the plethora of work on micronutrients and tuberculosis treatment outcomes [30], few studies have prospectively investigated the role of preexisting vitamin A status in the development of tuberculosis disease. Cegielski et al [14] observed that <2% of the US-based National Health and Nutrition Examination Survey 1 cohort had baseline vitamin A levels <300 µg/L (<1.05 µmol/L), and tuberculosis disease developed in only 61 persons during 20 years of follow-up. Although tuberculosis incidence was nearly 3-fold higher among those with low vitamin A levels, CIs for the hazard ratio ranged from .70 to 11.4. These results are consistent with findings from a study conducted in Philadelphia between 1942 and 1949, in which African American men with low baseline vitamin A levels were 3 times more likely to develop tuberculosis disease than those with higher levels [15]. Interestingly, the mean vitamin A level was 300 µg/L (1.05 µmol/L), suggesting that the comparison was between men with low and very low levels, rather than among persons with the spectrum of levels we observed in Lima.
This study also found a very strong effect of vitamin C deficiency; all in whom tuberculosis disease developed had baseline vitamin C levels <6 mg/L (<34.07 µmol/L). Our findings are also consistent with those of a recent study that evaluated role of vitamin A in tuberculosis disease progression among HIV-infected patients. In a cohort of HIV-infected patients from low- and middle-income countries, Tenforde et al [31] found that VAD, before initiation of antiretroviral therapy, conferred a 5-fold increase in the risk of incident tuberculosis disease.
Multiple other lines of evidence suggest an association between vitamin A levels and tuberculosis risk. In vitro studies have demonstrated that vitamin A and its metabolites cause dose-dependent inhibition of Mycobacterium tuberculosis growth in culture [32, 33]. Experimental studies in animal and cell models of tuberculosis infection also provide support for the protective role of retinol. Although early studies in various models gave conflicting results [34–36], more recent studies in mice [37], rats [38], THP-1 cells [39], and cultured human macrophages [40] have shown reduced M. tuberculosis bacillary loads after treatment with retinoic acid. Interestingly, the dose of retinoic acid required to produce a protective effect in human macrophages is lower when it was added before infection than when it was added afterward [40].
Vitamin A also affects the immune system in various ways relevant to the pathogenesis of tuberculosis [41–43]. Most of its effects are exerted by retinoic acid, which binds to the nuclear receptors RAR and RXR to control transcriptional expression of numerous target genes. Among its recently recognized effects on immunity, retinol modulates the maturation, antigen presentation, migration, and T-cell priming functions of dendritic cells [44–46], as well as the generation of T-regulatory cells and suppression of T-helper 17 cells [47]. Retinoic acid has also been shown to be crucial to the maintenance of the T-helper 1 lineage [48], an essential component of an effective immune response to tuberculosis.
In addition to its impact on acquired immunity, vitamin A may also play a role in innate immune responses to M. tuberculosis. Wheelwright et al [6] found that all-trans-retinoic acid exerts an antimicrobial effect on M. tuberculosis in human monocytes through its effect on cellular cholesterol efflux mediated through the NPC2 gene. Stimulation of primary human monocytes with all-trans-retinoic acid increased expression of NPC2 and reduced cellular cholesterol through a mechanism distinct from the antimicrobial activity of 1,25-dihydroxyvitamin D3 [7]. M. tuberculosis has been shown to use host lipids as a nutrient source, and host cholesterol mediates M. tuberculosis persistence and survival within macrophages [49]. Taken together, these findings suggest that low vitamin A levels may impair the host’s ability to control tuberculosis infection after exposure.
Carotenoids are naturally occurring pigments in fruits and vegetables, and 2 studies previously reported decreased tuberculosis risk among children and adult smokers with high intake of fruits and vegetables [50, 51]. To our knowledge, only 1 prior study has evaluated the association between carotenoid levels and incident tuberculosis; in that study, baseline total carotenoid levels in HIV-positive patients receiving antiretroviral therapy were not associated with an increased risk of tuberculosis disease [31].
Our study had notable limitations. Participants were followed up for 1 year, a relatively short period of time, given the slow pathogenesis of tuberculosis. Because we had relatively few blood samples from children aged <10 years, we were unable to assess the impact of VAD in that age group. Almost all our study participants had been vaccinated with BCG, so we are unable to distinguish between the possibilities that vitamin A enhanced BCG-induced adaptive immunity or provided direct protection against tuberculosis progression. Although we found no evidence of an interaction between vitamin A and vitamin D on tuberculosis disease risk, our study may not have been powered to detect such an interaction.
Prior studies have found that acute infections, such as pneumonia and rotavirus, temporarily reduce serum vitamin A levels [52, 53]. It is possible that HHCs recently infected with tuberculosis also experienced a reduction in retinol levels, and that process may explain our findings. A reduction in serum retinol levels during tuberculosis infection has not been observed in human studies to date, but this may be because it is challenging to determine exactly when individuals become infected with tuberculosis and to measure physiological changes occurring with that process.
Despite our efforts to ensure that nutritional assessments occurred before the development of tuberculosis disease, we could not rule out the possibility that participants had unrecognized tuberculosis disease at baseline, which may have led to the low retinol levels we observed. We addressed this issue by conducting 2 sensitivity analyses, the first stratified on baseline infection status and the second excluded cases diagnosed within 90 days of index patient enrollment. In both analyses, the risk of tuberculosis disease remained inversely associated with vitamin A quartiles regardless of baseline tuberculosis infection status or timing of diagnosis. Because active tuberculosis may remain clinically undetected for months, especially in children, there is no way to rule out reverse causality without conducting a clinical trial of vitamin A supplementation in persons at high risk for tuberculosis.
In conclusion, we find that vitamin A levels among persons exposed at home to a patient with tuberculosis strongly predicted incident tuberculosis disease within 12 months of follow-up, in a dose-dependent manner. Our data raise the possibility that screening for vitamin A levels among persons at high risk for tuberculosis could help identify those in whom disease is likely to develop in the near future so they could be targeted for early intervention. In the event that the association between VAD and tuberculosis progression proves to be causal, routine vitamin A supplementation among persons at high risk for tuberculosis disease (eg, HHCs of tuberculosis case patients or individuals in congregate settings, such as prisons) may provide an inexpensive, safe, and effective means of preventing progression from tuberculosis infection to tuberculosis disease.
Notes
Financial support. This work was supported by the National Institute of Allergy and Infectious Diseases (grants U19 AI076217 to M. B. M and U01 AI057786 to M. C. B); the National Institutes of Health (training grant T32DA013911 to O. A), and the National Institute of Mental Health–The Brown Initiative in HIV and AIDS Clinical Research for Minority Communities (grant 5R25MH083620 to O. A).
Potential conflicts of interest. All authors: No reported conflicts of interest. All authors have submitted the ICMJE Form for Disclosure of Potential Conflicts of Interest. Conflicts that the editors consider relevant to the content of the manuscript have been disclosed.
References

