


Abstract
Emerging evidence suggests that helminth infections are associated with lower insulin resistance (IR). Current deworming programs might remove this helminth-associated protective effect. Therefore, we evaluated the anthelmintic treatment effect on changes in IR.
We conducted a double-blind, household-cluster-randomized, placebo-controlled clinical trial on Flores island, Indonesia, an area endemic for soil-transmitted helminths (STHs). All subjects received 4 rounds of albendazole or matching placebo with 3-month intervals, for 3 consecutive days. The primary outcome was the change in homeostatic model assessment of IR in those aged >16 years. An intention-to-treat analysis was performed involving all subjects and ad hoc in the helminth-infected subjects.
We examined 797 (in 329 households) and 872 (in 353 households) subjects, who were assigned randomly into the albendazole and placebo arms, respectively. Albendazole was associated with a significant reduction in STH prevalence, total immunoglobulin E (IgE), and eosinophil count. Whereas albendazole had no effect on IR (estimated treatment effect, 0.006 [95% confidence interval, –.010 to .021]; P = .48) at the community level, it was associated with a significant increase in IR (estimated treatment effect, 0.031 [95% confidence interval, .004 to .059]; P = .04) (P value for interaction = .01) among helminth-infected subjects as detected by microscopy. Pathway analysis suggested that this might in part be due to an increased body mass index or a reduced eosinophil count.
Anthelmintic treatment reduces STH prevalence, total IgE, and eosinophil count but has no effect on IR at the community level. In helminth-infected subjects, treatment significantly increases IR, highlighting the need for metabolic health monitoring with ongoing deworming programs.
ISRCTN 75636394.
The increasing prevalence of type 2 diabetes mellitus (DM2) is a major health concern worldwide, in particular in low- and middle-income countries [1]. Rapid socioeconomic development in these countries has led to a shift in dietary habits and infrastructure that promotes overnutrition and decreased physical activity [2], ultimately increasing the risk for DM2. DM2 is characterized by increased insulin resistance (IR). Although the pathophysiology of DM2 is complex and involves several defects [3], there is evidence that in addition to an altered energy balance, chronic low-grade systemic inflammation plays a key role, linking the immune system and the impairment in metabolic homeostasis [4].
Helminth infections, which are still endemic in many low- and middle-income countries [5], are associated with skewed immune responses toward type 2 and regulatory immune responses [6]. This may lead to a decreased systemic inflammation and consequently increased whole-body and tissue-specific insulin sensitivity [7]. In addition, helminths are associated with a lower body mass index (BMI) [8], which may be beneficial in terms of IR. Helminths may therefore improve insulin sensitivity via immunological and nonimmunological pathways [6, 9, 10].
Interleukin 4 [11] and interleukin 10 [12], key cytokines in helminth infections, have been shown to regulate peripheral nutrient metabolism and insulin sensitivity [11]. Recent studies in animal models of diet-induced obesity [13–17] have also shown that helminth infections [13, 15–17] and helminth- derived molecules [14, 16–18] can increase insulin sensitivity through direct and indirect control of metabolic pathways [18]. Furthermore, several population-based studies have reported a lower DM2 risk in subjects with previous [19, 20] or current [21, 22] chronic helminth infections. In a previous study on Flores island in Indonesia, we reported that chronic soil- transmitted helminth (STH) infections were associated with lower whole-body IR, independent of BMI [8].
However, all human studies performed so far have been cross-sectional, preventing any insight on a causal relation between helminth infections and IR. Therefore, we performed a cluster-randomized controlled trial of anthelmintic treatment in an area endemic for STHs, studying the hypothesis that a reduction of helminth infections will lead to a higher degree of IR.
METHODS
Study Overview
We conducted a household-based, cluster-randomized, double-blind trial in 3 villages in Nangapanda, Ende, Flores island, Indonesia. The trial was approved by the ethics committee of Faculty of Medicine, Universitas Indonesia (FKUI), filed by the ethics committee of Leiden University Medical Center (LUMC), and registered as a clinical trial (http://www.isrctn.com/ISRCTN75636394). The protocol was published previously [23].
Participants
All subjects in the study area, except children <2 years of age and pregnant women, were included in the trial to avoid cross-contamination between household members. Subjects aged ≥16 years underwent clinical and laboratory examination, excluding subjects with active treatment for diabetes mellitus and serious concomitant diseases.
Study Design and Treatments
After obtaining written informed consent, the population was randomized by household blocks using random allocation software for assignment to treatment. Both study investigators and participants were blinded for the treatment code. After randomization, all study subjects received a tablet of albendazole (400 mg) or matching placebo (both manufactured by PT Indofarma Pharmaceutical, Bandung, Indonesia) for 3 consecutive days with direct supervision. This treatment regimen was given 4 times with 3-month intervals (weeks 9–10, 21–22, 33–34, and 45–46). Clinical measurements, as well as blood and stool sample collection, were performed during the first 8 weeks before the start of the drug administration (baseline or t = 0) and 6 weeks after the last drug administration (follow-up or t = 52 weeks) (Supplementary Figure 1). After completion of the study, the whole study population was treated with a tablet of albendazole (400 mg) for 3 consecutive days.
Study Procedures and Outcomes
All clinical measurements and blood sample collections were performed after an overnight fast. Detailed information on study procedures are available in the Supplementary Appendix. In brief, body weight, height, waist circumference, and hip circumference were measured, from which BMI and waist-to-hip ratio were calculated. Fasting blood glucose was determined in capillary blood. All sera, plasma, whole blood, and stool samples were frozen at −20°C and subsequently stored at −80°C. Insulin, hemoglobin A1c (HbA1c), total cholesterol, high-density lipoprotein cholesterol (HDL-C), triglycerides, and high-sensitivity C-reactive protein (hs-CRP) were measured pairwise (baseline and follow-up) in the same analytical runs at the LUMC. A Giemsa-stained peripheral thin blood smear was read at FKUI to assess the differential white blood cell count, resulting in a relative percentage of basophils, eosinophils, neutrophils, lymphocytes, and monocytes. Total immunoglobulin E (IgE) was measured at LUMC as described previously [24].
Fresh stool samples were examined by microscopy using the Kato-Katz method to detect STHs (hookworm, Ascaris lumbricoides, and Trichuris trichiura). Multiplex real-time polymerase chain reaction (PCR) was performed to simultaneously detect the presence of hookworm (Ancylostoma duodenale, Necator americanus), A. lumbricoides, T. trichiura, and Strongyloides stercoralis. Stool samples were considered positive by PCR when cycle threshold (Ct) values were <50, and further grouped into 3 categories: Ct <30, 30 to <35, and ≥35, representing a high, moderate, and low DNA load, respectively [25].
Primary outcome was IR, assessed using the homeostatic model assessment of IR (HOMA-IR), a well-validated measure of whole-body IR in humans (HOMA-IR = fasting serum insulin × fasting glucose / 22.5) [26]. Secondary outcomes included BMI, waist circumference, fasting blood glucose, HbA1c, lipid levels, total IgE, eosinophil count, hs-CRP, and prevalence of STHs as assessed by microscopy and stool PCR. Adverse events reported by subjects or observed by the investigators were monitored during the trial.
Statistical Analysis
The sample size was calculated according to intention-to-treat analysis. Based on our previous study [27], we assumed that the average household size is 4 and that around 20% of participants would be lost to follow-up after 1 year. We used a significance level of 5% and a power of 80%. Correlations within households were taken into account by using the correction factor 1+(m – 1) ICC, with m being the household size and ICC the intraclass correlation. The sample size was calculated to aim at a difference in mean HOMA-IR between the 2 treatment groups of 0.18 and an ICC of 0.1, indicating 1580 subjects in total.
For continuous variables, normally distributed data were summarized as mean and standard deviation (SD), whereas nonnormally distributed data (HOMA-IR, insulin, hs-CRP, total IgE, and eosinophil count) were summarized as geometric mean and 95% confidence interval (CI), and log-transformed for analyses. HOMA-IR and hs-CRP were log-transformed as log10(1 + [value]). Categorical data were expressed as proportions.
The effect of anthelmintic treatment on HOMA-IR was assessed at the community level using an intention-to-treat approach, using mixed models to account for the correlation within households. As an ad hoc analysis, we stratified by infection status by including helminth infection status (no infection, any infection) at baseline and its interaction with treatment into the model. We also stratified by the number of helminth species a subject was infected with, by including the number of helminth species (no infection, single infection, multiple infection) at baseline and its interaction with treatment into the model. Two random effects were used: To model clustering within households, a random household specific intercept was used, and to model correlation within subjects, random subject-specific intercept was used. Parameter estimates for treatment effect and 95% CIs were reported. The reported P values were obtained using a likelihood ratio test comparing the model with and without the treatment effect. We used the same model for secondary outcomes. For the binary outcome (helminth infection status), a logistic model was used with random household effects and random subject effects. All models were fitted using the lme4 package (R software).
RESULTS
Between 1 April 2014 and 3 June 2014, we initially included 752 households with 3566 subjects in the trial. Randomization resulted in 1825 subjects assigned to placebo and 1741 subjects to albendazole (377 and 375 households, respectively). The overall trial profile is shown in Figure 1, with a total of 1669 subjects aged ≥16 years who were examined at baseline (872 subjects [353 households] and 797 subjects [329 households] in the placebo and the albendazole groups, respectively). Baseline characteristics were similar between both treatment arms (Table 1).
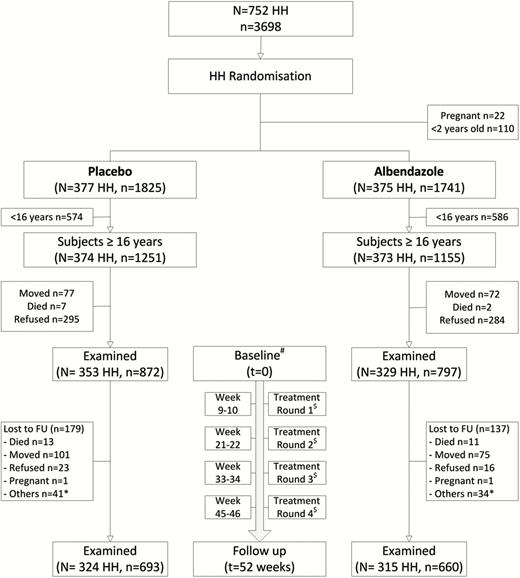
Trial profile. #Baseline data (t = 0) were collected during the first 8 weeks before the start of the drug administration. $Single dose of albendazole or matching placebo was given for 3 consecutive days to all household members, except children <2 years of age and pregnant women. *Other reasons for loss to follow-up were harvesting crops, working on funeral ceremonies, severely ill, hospitalized, and nursing mother. Abbreviations: HH, households; FU, follow-up.
Baseline Characteristics of Study Population
| Characteristic | No. | Placebo | No. | Albendazole |
|---|---|---|---|---|
| Age, y, mean (SD) | 872 | 42.5 (15.7) | 797 | 42.5 (15.7) |
| Sex, female, No. (%) | 872 | 534 (61.2) | 797 | 478 (60.0) |
| Body mass index, kg/m2, mean (SD) | 860 | 22.4 (4.2) | 790 | 22.4 (4.0) |
| Waist circumference, cm, mean (SD) | ||||
| Female | 532 | 76.5 (12.6) | 476 | 77.0 (12.6) |
| Male | 333 | 76.5 (11.6) | 317 | 76.6 (11.3) |
| Waist-to-hip ratio, mean (SD) | ||||
| Female | 507 | 0.88 (0.07) | 473 | 0.89 (0.08) |
| Male | 317 | 0.94 (0.07) | 315 | 0.94 (0.07) |
| Systolic BP, mm Hg, mean (SD) | 871 | 129.3 (23.4) | 765 | 129.5 (23.8) |
| Diastolic BP, mm Hg, mean (SD) | 871 | 76.4 (12.1) | 765 | 76.5 (12.1) |
| Total cholesterol, mmol/L, mean (SD) | 836 | 4.9 (1.1) | 764 | 4.9 (1.1) |
| HDL cholesterol, mmol/L, mean (SD) | ||||
| Female | 517 | 1.3 (0.4) | 457 | 1.3 (0.4) |
| Male | 319 | 1.1 (0.3) | 307 | 1.1 (0.3) |
| LDL cholesterol, mmol/L, mean (SD) | 836 | 3.0 (0.9) | 763 | 3.0 (0.9) |
| Triglycerides, mmol/L, mean (SD) | 836 | 1.4 (0.7) | 764 | 1.5 (0.7) |
| HbA1ca, mmol/mol, mean (SD) | 715 | 32.5 (9.0) | 683 | 32.3 (8.5) |
| Fasting blood glucose, mmol, mean (SD) | 836 | 5.5 (1.6) | 768 | 5.5 (1.6) |
| Fasting insulin, mU/L, GM (95% CI) | 836 | 3.5 (3.2 to 3.7) | 768 | 3.5 (3.3 to 3.8) |
| HOMA-IR, GM (95% CI) | 836 | 1.09 (1.02 to 1.15) | 768 | 1.08 (1.01 to 1.14) |
| hs-CRP, mg/L, GM (95% CI) | 836 | 1.26 (1.16 to 1.36) | 764 | 1.26 (1.16 to 1.37) |
| Total IgE, IU/mL, GM (95% CI) | 835 | 557.2(498.1 to 623.3) | 766 | 601.6(534.8 to 676.7) |
| Eosinophil count, %, GM (95% CI) | 829 | 5.9 (5.6 to 6.1) | 763 | 6.1 (5.8 to 6.4) |
| Helminth infection by microscopy, No. (%) | 655 | 283 (43.2) | 602 | 251 (41.7) |
| Single | 185 (28.2) | 160 (26.6) | ||
| Multiple | 98 (15.0) | 91 (15.1) | ||
| Helminth infection by PCR, No. (%) | 783 | 425 (54.3) | 710 | 393 (55.4) |
| Single | 256 (32.7) | 252 (35.5) | ||
| Multiple | 169 (21.6) | 141 (19.9) |
Abbreviations: BP, blood pressure; CI, confidence interval; GM, geometric mean; HDL, high-density lipoprotein; HbA1c, hemoglobin A1c; HOMA-IR, homeostasis model assessment for insulin resistance; hs-CRP, high-sensitivity C-reactive protein; IgE, immunoglobulin E; LDL, low-density lipoprotein; PCR, polymerase chain reaction; SD, standard deviation.
aAfter excluding subjects with unidentified hemoglobinopathy on the Tosoh G8 high-performance liquid chromatography analyzer (13.9% [116/831] in the placebo group and 10.5% [80/763] in the albendazole group).
The overall loss to follow-up, from baseline to 52 weeks, was 18.9%. The main reason for loss to follow-up was permanent or temporary movement out of the village for employment or study. Those who moved out and refused to come for follow-up were younger in comparison to the whole population. There were no significant differences between both treatment arms in terms of loss to follow-up (Supplementary Table 1). With respect to compliance, 87.9% (1189/1353) of the subjects took the maximum of 12 tablets (87.0% [574/660] vs 88.7% [615/693] in the albendazole and the placebo groups, respectively). We collected stool samples from 92.0% (1535/1669) of the subjects at baseline and 89.9% (1217/1353) of the subjects at follow-up. Data to calculate HOMA-IR were available for 1604 subjects at baseline, and for 1272 subjects at follow-up. Sixteen subjects who were receiving active treatment for DM2 were excluded from analysis.
Effect of Treatment at the Community Level
Albendazole treatment reduced the percentage of subjects with any helminth infection as assessed by either microscopy (from 41.7% [251/602] to 5.6% [27/486] in the albendazole arm vs 43.2% [283/655] to 34.4% [181/526] in the placebo arm; P < .0001) or PCR (from 55.4% [393/710] to 11.3% [62/550] in the albendazole arm vs 54.3% [425/783] to 46.8% [278/594] in the placebo arm; P < .0001). The highest reduction was seen for hookworm, followed by A. lumbricoides and T. trichiura infection (Figure 2). When assessing the infection intensity in categories based on PCR, albendazole treatment resulted in a reduction in intensity across these 3 helminth species with the least effect on T. trichiura infection (Figure 2B). Strongyloides stercoralis prevalence, which was already low, was eliminated in the albendazole group (Supplementary Table 2).
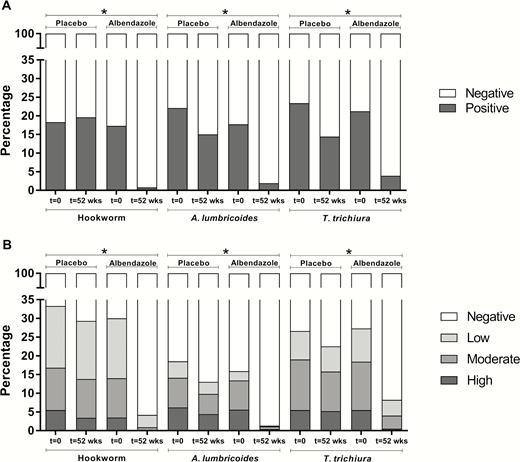
The effect of albendazole treatment on the prevalence and intensity of soil-transmitted helminths. Percentage of hookworm-, Ascaris lumbricoides–, and Trichuris trichiura–infected subjects at baseline (t = 0) and following treatment (t = 52 weeks), in the placebo and albendazole treatment arms, as detected by microscopy (n = 1011; A) and polymerase chain reaction (n = 1144; B). Albendazole treatment was associated with a significant reduction of hookworm, A. lumbricoides, and T. trichiura. P values were calculated using a logistic model with random household effects and random subject effects. *P < .0001.
At the community level, neither HOMA-IR nor BMI, waist circumference, fasting blood glucose, HbA1c, total cholesterol, HDL-C, LDL-C, triglycerides, or hs-CRP were found to be affected by albendazole treatment (Table 2). However, the significant reduction of infection prevalence and intensity by albendazole treatment was accompanied by a significant decrease in total IgE level (estimated treatment effect, –0.066 [95% CI, –.094 to –.037]; P < .0001) and eosinophil count (–0.057 [95% CI, –.086 to –.028]; P = .0001) (Table 2).
Effect of Albendazole Treatment on Primary and Secondary Outcomes at the Community Level
| Outcome | Parameter | Placebo | Albendazole | Treatment Effect (95% CI) | P Value | ||
|---|---|---|---|---|---|---|---|
| Baseline | Follow-up | Baseline | Follow-up | ||||
| Insulin resistance | HOMA-IR | 1.09 (1.02–1.15) n = 836 | 1.16 (1.09–1.24) n = 659 | 1.08 (1.01–1.14) n = 768 | 1.17 (1.13–1.25) n = 635 | 0.006 (–.010 to .021) | .48 |
| Glucose-related | Fasting blood glucose (mmol) | 5.49 (1.61) n = 836 | 5.47 (1.09) n = 650 | 5.45 (1.58) n = 768 | 5.52 (1.49) n = 634 | 0.018 (–.105 to .142) | .77 |
| Fasting insulin (mU/L) | 3.5 (3.2–3.7) n = 836 | 3.8 (3.5–4.1) n = 646 | 3.5 (3.3–3.8) n = 768 | 3.9 (3.6–4.2) n = 628 | 0.006 (–.032 to .043) | .77 | |
| HbA1c (mmol/mol) | 32.5 (9.0) n = 715 | 32.7 (7.4) n = 564 | 32.3 (8.5) n = 683 | 32.7 (8.4) n = 556 | 0.051 (–.350 to .452) | .80 | |
| Adiposity-related | Body mass index (kg/m2) | 22.4 (4.2) n = 860 | 22.8 (4.2) n = 690 | 22.4 (4.0) n = 790 | 22.9 (4.1) n = 659 | 0.104 (–.011 to .220) | .08 |
| Waist circumference (cm) | 76.5 (12.2) n = 865 | 77.2 (11.5) n = 692 | 76.8 (12.1) n = 793 | 77.4 (11.1) n = 657 | –0.229 (–.855 to .397) | .47 | |
| Lipid-related | Total cholesterol (mmol/L) | 4.9 (1.0) n = 836 | 5.0 (1.1) n = 659 | 4.9 (1.1) n = 764 | 5.0 (1.1) n = 632 | –0.031 (–.098 to .035) | .35 |
| HDL-C (mmol/L) | 1.2 (0.3) n = 836 | 1.3 (0.3) n = 659 | 1.2 (0.3) n = 764 | 1.3 (0.4) n = 632 | –0.008 (–.031 to .016) | .52 | |
| LDL-C (mmol/L) | 3.0 (0.9) n = 836 | 3.1 (0.9) n = 658 | 3.0 (0.9) n = 763 | 3.1 (1.0) n = 631 | –0.032 (–.089 to .024) | .26 | |
| Triglycerides (mmol/L) | 1.4 (0.7) n = 836 | 1.5 (0.7) n = 659 | 1.5 (0.7) n = 764 | 1.5 (0.7) n = 632 | –0.003 (–.023 to .090) | .25 | |
| Immune-related | Total IgE (IU/mL) | 557.2 (498.1–623.3) n = 835 | 441.8 (386.7–504.7) n = 651 | 601.6 (534.8–676.7) n = 766 | 399.0 (347.9–457.7) n = 628 | –0.066 (–.094 to –.037) | <.0001 |
| Eosinophil count (%) | 5.9 (5.6–6.1) n = 829 | 5.9 (5.6–6.1) n = 641 | 6.1 (5.8–6.4) n = 763 | 5.2 (5.0–5.5) n = 619 | –0.057 (–.086 to –.028) | .0001 | |
| hs-CRP (mg/L) | 1.26 (1.16–1.36) n = 836 | 1.30 (1.19–1.42) n = 659 | 1.26 (1.16–1.37) n = 764 | 1.34 (1.23–1.46) n = 632 | 0.010 (–.017 to –.038) | .46 | |
The estimated treatment effect after 12 months of follow-up for HOMA-IR and other glucose-related parameters, adiposity, lipid, and immunological parameters at community level is displayed with corresponding 95% CI. The estimated treatment effects were obtained by mixed models and P values are indicated. HOMA-IR, fasting insulin, total IgE, eosinophil count, and hs-CRP were log-transformed.
Abbreviations: CI, confidence interval; HbA1c, hemoglobin A1c; HDL-C, high-density lipoprotein cholesterol; HOMA-IR, homeostasis model assessment for insulin resistance; hs-CRP, high-sensitivity C-reactive protein; IgE, immunoglobulin E; LDL-C, low-density lipoprotein cholesterol.
Effect of Treatment in STH-Infected Subjects
Next, the effect of treatment was assessed only in those who were infected with helminths at baseline, as detected by microscopy. Albendazole treatment resulted in a significant increase in HOMA-IR (0.031 [95% CI, .004 to .059]; P = .04) (Figure 3A). This effect was greater in comparison to subjects without helminth infections at baseline (P = .01 for the interaction between helminth infection status at baseline and treatment). Moreover, with an increasing number of helminth species infecting a subject at baseline, there was a gradual increase in HOMA-IR after treatment. Thus, whereas we saw no significant effect of treatment among those with no infection (–0.013 [95% CI, –.035 to .010]; P = .28) or those infected with single species (0.017 [95% CI, –.017 to .050]; P = .34), treatment in those infected with multiple helminth species resulted in a significantly higher HOMA-IR (0.061 [95% CI, .015 to .106]; P = .02; P value for interaction = .005) (Figure 3A). These effects were also reflected for BMI (Figure 3B), eosinophil count (Figure 3C), and total IgE level (Figure 3D), but not for HbA1c, total cholesterol, HDL-C, LDL-C, triglycerides, or hs-CRP level. Pathway analysis showed that adjustment for BMI and eosinophil count, but not total IgE level, attenuated the treatment effect on HOMA-IR among helminth-infected subjects (Supplementary Table 3).

Effect of albendazole treatment on homeostatic model assessment for insulin resistance (HOMA-IR), body mass index (BMI), total immunoglobulin E (IgE), and eosinophil count, stratified by the number of helminth species carried by infected subjects at baseline as detected by microscopy. Effect of albendazole treatment on HOMA-IR (n = 1211; A), BMI (n = 1233; B), total IgE (n = 1209; C), and eosinophil count (n = 1200; D), stratified by the number of helminth species infecting subjects at baseline, as detected by microscopy. The estimated treatment effects are displayed with the corresponding 95% confidence interval. Circle, infected with at least 1 helminth species; square, no infection; triangle, infected with 1 helminth species; inverse triangle, infected with >1 helminth species.
When using PCR to detect STH infection, a significant increase of HOMA-IR was observed only among subjects who were infected with multiple helminth species at baseline (Supplementary Figure 2A). A significant increase of BMI was also observed in these subjects (Supplementary Figure 2B).The group of subjects infected with multiple helminth species had a significantly higher infection intensity in comparison to the group of subjects infected with single helminth species (Supplementary Table 4).
Adverse Events
Adverse events were reported in 3.9% (31/797) and 2.6% (23/872) of subjects in the albendazole and placebo groups, respectively. Abdominal pain was the most commonly reported complaint (35% [11/31] vs 13% [3/23] in the albendazole and the placebo groups, respectively). Other commonly reported complaints were diarrhea and nausea, which were similar in both treatment arms.
DISCUSSION
Here, we report the first cluster-randomized trial in humans investigating the causal relationship between helminth infections and whole-body IR in an area endemic for STHs. We found that after 12 months of follow-up, 4 rounds of anthelmintic treatment with 3-month intervals did not lead to an increase in IR or other parameters such as BMI, waist circumference, fasting blood glucose, HbA1c, serum lipid levels, and hs-CRP at the community level, when all participants irrespective of their helminth status were included in the analysis—this despite the fact that the prevalence and infection intensity of STHs, as well as their associated type 2 immune responses, measured by total IgE and eosinophil count, were significantly reduced in albendazole-treated subjects.
When considering helminth-infected subjects, we observed that albendazole treatment resulted in a significant increase of IR among helminth-infected subjects when infection was detected by microscopy. Moreover, the effect of treatment on IR was stronger in those infected with multiple STH species at baseline compared to those with a single STH infection. We observed a similar pattern of the treatment effect on BMI. Even though significant, it is important to note that the magnitude of the effect of 1 year of deworming on IR was modest. The effect of deworming in increasing IR seemed to be partly mediated through an increase in BMI, as adjustment for BMI, a strong predictor of IR [28], attenuated the treatment effect on IR. Similar to BMI, eosinophil count and total IgE were significantly decreased in helminth-infected subjects, and this was stronger in those with multiple helminth infections. The possible importance of eosinophils in IR, shown in animal models [13, 14, 16, 17] and in 1 epidemiological study [29], is also seen in our study as correction for eosinophil count reduced the treatment effect on IR.
When infection was assessed by PCR, which, in comparison to the Kato-Katz method, has a better ability to detect low-intensity infections that may be clinically less relevant [25], we only observed a significant increase in IR in the group of subjects who were infected with multiple helminth species at baseline. The infection intensity (DNA load) in this group of subjects was significantly higher than in those infected with a single STH species. Albendazole treatment led to a strong reduction of infection intensity in those infected with multiple STH species, which might explain the significant increase in IR following albendazole treatment.
The observed modest increase of IR after treatment among helminth-infected subjects, as detected by microscopy, could also contribute to the lack of a significant effect of albendazole treatment on IR at the community level. Two recent meta-analyses on deworming in children support this notion as they show that although a mass deworming approach, thus irrespective of helminth infection status, resulted in no change in weight gain, targeted anthelmintic treatment of infected children resulted in a significant weight gain [30, 31].
However, several other explanations for the absence of a treatment effect on IR at the community level need to be considered. Although our study design was successful in lowering STH infection prevalence and its associated Th2 responses, it is possible that longer treatment and follow-up would show stronger effects. It is also possible that both immune and non-immune-related effects of helminths on IR are not only associated with current helminth infections [8] but also with exposure to helminth infections in the past and therefore sustained [13, 19]. The causal relationship between helminth infection and IR, as found in the subgroup of infected subjects, might have a relatively small contribution to the multifactorial pathogenesis of IR [28]. Therefore, longer follow-up studies involving assessment of other more established factors, such as diet and physical activity [28], will be needed to investigate this.
The use of PCR in our study, in addition to microscopy for detection of helminths, has helped us realize that the burden of infections, in terms of the number of helminth species as well as the infection intensity (DNA load), might influence the effect of anthelmintic treatment on IR. Deworming in subjects with increasing burden of infections resulted in an increasing change in IR. In addition, treatment of uninfected subjects, as assessed by either microscopy or PCR, did not influence IR, which suggests that an undetectable or a low level of helminth infection might be irrelevant for IR. The question whether a high burden of helminth infection causes different modulating effects on the immune system or energy balance remains to be answered.
In conclusion, intensive anthelmintic treatment in an STH-endemic area significantly reduces both the STH infection prevalence and intensity, as well as its related type 2 immune responses. This treatment does not lead to an increase of whole-body IR at the community level, but it does increase IR among those with a microscopy-detected STH infection. Studies are needed to determine the long term metabolic consequences of anthelmintic treatment in communities where STHs are highly prevalent. However, in terms of policy, countries implementing helminth control programs need to be aware that this may exacerbate or accelerate the deterioration in metabolic health, and that education and prevention strategies for noncommunicable diseases such as DM2 need to go hand in hand with infectious disease control measures.
Supplementary Data
Supplementary materials are available at Clinical Infectious Diseases online. Consisting of data provided by the authors to benefit the reader, the posted materials are not copyedited and are the sole responsibility of the authors, so questions or comments should be addressed to the corresponding author.
Notes
Author contributions. D. L. T. was in charge of the field study and was involved in setting up the study, supervising gathering of data, treatment, clinical care, follow-up of the study population, analyzing the data, and writing of the manuscript. K. R. was in charge of the field study and was involved in setting up the laboratory in the study area, performing the immunological analysis, supervising the data cleaning, follow-up of the study population, and writing of the manuscript. I. M. developed methods to analyze the complex data generated during the lifetime of the project and was involved in the randomization and data analysis. L. v. L. was involved in the performance and analysis of diagnostic assays for the detection of helminths in stool samples. E. A. T. B. developed, optimized, and performed multiplex real-time PCR for detection of helminth infection. C. M. C. advised on the type, quality, and metrological traceability of medical tests and was responsible for the measurements of the metabolic parameters at the Department of Clinical Chemistry and Laboratory Medicine at LUMC. P. S. advised on the metabolic aspects of the study. Y. D. was involved in coordinating the study and advises on the immunological and parasitological aspects of the study. A. E. W. was involved in clinical care and setting up the database. J. J. H.-D. developed the study and was involved in supervising sample size calculation, randomization, and statistical analysis. E. S. was involved in coordinating the study, advised on parasitological and immunological aspects of the study, and supervised the writing of the manuscript. J. W. A. S. developed the study, supervised the writing of the manuscript, and is the Dutch coordinator of the SUGARSPIN program. M. Y. developed the study, supervised the writing of the manuscript, and is the scientific coordinator of the SUGARSPIN program. T. S. developed the study and is the Indonesian coordinator of the SUGARSPIN program. All authors read and approved the final manuscript. The senior authors (T. S., M. Y., and J. W. A. S.) had final responsibility for the decision to submit for publication.
Acknowledgments. The authors thank all study participants in Nangapanda, Ende, and Flores, Indonesia; all local government and health officers in Nangapanda who supported this project; all field workers from Universitas Indonesia and Nangapanda; Alison Elliott and Bruno Guigas for reading the manuscript critically; Yvonne Kruize, Angga M. Fuady, and all colleagues at the Department of Parasitology, LUMC, for their technical support; and the Indonesian Directorate General of Higher Education for providing scholarships to 2 PhD candidates involved in this project.
Disclaimer. The funder of the study had no role in study design, data collection, data analysis, data interpretation, or writing of the report.
Financial support. This work was supported by The Royal Netherlands Academy of Arts and Science (Reference 57-SPIN3-JRP) and Universitas Indonesia (research grant BOPTN 2742/H2.R12/HKP.05.00/2013).
Potential conflicts of interest. All authors: No reported conflicts of interest. All authors have submitted the ICMJE Form for Disclosure of Potential Conflicts of Interest. Conflicts that the editors consider relevant to the content of the manuscript have been disclosed.
References
Author notes
D. L. T. and K. R. contributed equally to this work.
J. W. A. S., M. Y., and T. S. contributed equally to this work.

