


Abstract
The efficacy of antimicrobial central venous catheters (CVCs) remains questionable. In this network meta-analysis, we aimed to assess the comparative efficacy of antimicrobial CVC impregnations in reducing catheter-related infections in adults.
We searched 4 electronic databases (Medline, the Cochrane Central Register of Controlled Trials, Embase, CINAHL) and internet sources for randomized controlled trials, ongoing clinical trials, and unpublished studies up to August 2016. Studies that assessed CVCs with antimicrobial impregnation with nonimpregnated catheters or catheters with another impregnation were included. Primary outcomes were clinically diagnosed sepsis, catheter-related bloodstream infection (CRBSI), and all-cause mortality. We performed a network meta-analysis to estimate risk ratio (RR) with 95% confidence interval (CI).
Sixty studies with 17255 catheters were included. The effects of 14 impregnations were investigated. Both CRBSI and catheter colonization were the most commonly evaluated outcomes. Silver-impregnated CVCs significantly reduced clinically diagnosed sepsis compared with silver-impregnated cuffs (RR, 0.54 [95% CI, .29–.99]). When compared to no impregnation, significant CRBSI reduction was associated with minocycline-rifampicin (RR, 0.29 [95% CI, .16–.52]) and silver (RR, 0.57 [95% CI, .38–.86]) impregnations. No impregnations significantly reduced all-cause mortality. For catheter colonization, significant decreases were shown by miconazole-rifampicin (RR, 0.14 [95% CI, .05–.36]), 5-fluorouracil (RR, 0.34 [95% CI, .14–.82]), and chlorhexidine-silver sulfadiazine (RR, 0.60 [95% CI, .50–.72]) impregnations compared with no impregnation. None of the studies evaluated antibiotic/antiseptic resistance as the outcome.
Current evidence suggests that the minocycline-rifampicin—impregnated CVC appears to be the most effective in preventing CRBSI. However, its overall benefits in reducing clinical sepsis and mortality remain uncertain. Surveillance for antibiotic resistance attributed to the routine use of antimicrobial-impregnated CVCs should be emphasized in future trials.
The central venous catheter (CVC) is an essential device for intensive care, cancer patients, or patients who require parenteral nutrition. However, catheter-related bloodstream infection (CRBSI) is a major complication of CVCs, with its associated mortality, morbidities, and costs [1–5]. In the United States, the annual cases of CRBSI were estimated at 11000 in 2010 [6] and at 14400 in 4 European countries (France, Germany, Italy, and the United Kingdom) with associated annual costs of between €35.9 and €163.9 million [4]. CRBSI remains an important patient safety problem in high-, middle-, and low-income countries [5, 7–11].
Several measures are in use to prevent CRBSI, including maximal sterile barriers [12], CVC site disinfection, and avoidance of the femoral site for catheter insertion [1, 13–15]. Since 1980s, catheter impregnation with antiseptic or antibiotics has been developed [2]. Among them, chlorhexidine-silver sulfadiazine (CSS) and minocycline-rifampicin (MNR) impregnations are the most commonly studied to date [16, 17]. Other compounds such as silver (SIL), platinum, carbon, and heparin (HEP) have also been evaluated as CVC-impregnation materials [18–20]. It is proposed that antimicrobial impregnation of the CVCs inhibits the colonization of microorganisms on the catheter surface and prevents their spread into the bloodstream [2]. In vitro and animal studies revealed the efficacy of these impregnated catheters against certain common colonizing microorganisms [21, 22]. Although these new catheter-based technologies are promising, progressive discovery of bacterial adaptation and resistance has posed a continuing challenge to their efficacy [23–26]. In this network meta-analysis (NMA), we aimed to assess the comparative efficacy of antimicrobial CVC impregnations in reducing catheter-related infections in adults.
METHODS
This is an abridged version of a Cochrane systematic review [27] with the search updated to August 2016. This study is registered with PROSPERO, number CRD42015026037 (http://www.crd.york.ac.uk/PROSPERO/display_record.asp?ID=CRD42015026037).
Search Strategy and Selection Criteria
A search was performed up to August 2016 in Medline, the Cochrane Central Register of Controlled Trials (CENTRAL), Embase, and the Cumulative Index to Nursing and Allied Health Literature (CINAHL) for published clinical trials, and 5 internet sources for ongoing or unpublished clinical trials (www.controlled-trials.com, www.update-software.com, www.clinicaltrialresults.org, www.centerwatch.com, and www.clinicaltrials.gov). The search strategies are described in a related Cochrane review [27]. We searched for additional studies in the bibliographies of relevant Cochrane and non-Cochrane systematic reviews.
We included randomized controlled trials (RCTs) comparing antimicrobial-impregnated CVCs with nonimpregnated CVCs (NO-I-CVC) or catheters with another impregnation for the prevention of CRBSI and other clinically important outcomes. The study participants were adults in any inpatient hospital setting with a CVC in place. Studies evaluating CVCs for hemodialysis were excluded.
Procedures
Two authors independently included studies using predefined criteria. Study characteristics and outcomes data for each study were extracted by one author (N. M. L.) and cross-checked by other authors. Disagreements were resolved by discussion leading to a consensus.
Risk of bias was evaluated using the Cochrane Risk of Bias Scale [28] by 3 reviewers independently using the following criteria: (1) random sequence generation, (2) allocation concealment, (3) incomplete outcome data, (4) blinding of participants and personnel, and (5) other issues. For each criterion, studies were categorized as low, high, or unclear risk of bias with justification.
Outcomes
Primary outcomes were number of participants or catheter with (1) clinically diagnosed sepsis, (2) CRBSI, including CRBSI per 1000 catheter-days, and (3) all-cause mortality. Secondary outcomes were number of participants or catheter with (1) catheter-related local infections, (2) catheter colonization, including catheter colonization per 1000 catheter-days, (3) skin or site colonization, (4) mortality from CRBSI, (5) adverse effects, and (6) catheter or premature catheter removal. The detailed definition of each outcome is described elsewhere [27].
Data Analysis
Direct Treatment Comparisons
Pairwise meta-analyses were performed using fixed- or random-effects models in Review Manager 5 (RevMan 5.3) [29], depending on the degree of heterogeneity. Effect size was estimated as pooled risk ratios (RR) with 95% confidence intervals (CIs), unless stated otherwise.
Indirect and Mixed Comparisons
An NMA using the Frequentist random-effects model was employed [30] to estimate the comparative efficacy of any 2 treatments. This approach assumes “consistency” of treatment effects across all included trials, where the treatment effects from direct and indirect evidence are equivalent. Within a Bayesian framework, the relative ranking probabilities of each intervention were estimated using rankograms, the surface under the cumulative ranking curve (SUCRA), and mean ranks [30, 31]. All analyses were conducted with Stata software version 13.0 (StataCorp, College Station, Texas).
Evidence of inconsistency was assessed using several methods. The global Wald test statistic was employed to evaluate whether a network as a whole demonstrated inconsistency [32]. At the loop levels, inconsistency factor with 95% CI was calculated to identify disagreement between direct and indirect estimates within a closed loop [33]. Direct and indirect evidence on a particular comparison (node) were compared using the node-splitting technique [34, 35]. If inconsistency was detected, study characteristics were evaluated for potential causes of inconsistency. If none was identified, the inconsistency model was employed instead [36]. Comparison-adjusted funnel plots were used to identify the presence of small-study effects and validate the reliability of the results [37].
Subgroup Analyses
Subgroup analyses on CRBSI and catheter colonization were performed according to the baseline risks (using the median event rate in the control group as cutoff) [27] and participant type. Detailed methods are described in Supplementary Appendix 6.
Quality of Evidence
The quality of evidence in direct, indirect, and NMA estimates for primary outcomes was appraised using the Grading of Recommendations Assessment, Development and Evaluation (GRADE) approach [38]. The quality of evidence was categorized to 4 levels—high, moderate, low, and very low.
In this approach, the direct evidence from RCTs started at high quality and was rated down based on the following principles: risk of bias, inconsistency (or heterogeneity), indirectness, imprecision, and publication bias [38]. For indirect evidence, the quality of evidence was assessed from first-order loop following the aforementioned principles, in addition to transitivity. The initial rating of the indirect evidence was determined by the lower rating of the 2 direct comparisons in the first-order loop. This can be rated down further for imprecision or intransitivity. Finally, the highest rating among contributing direct and indirect evidence was assigned to the quality of NMA estimates [38].
RESULTS
Study Selection
The search strategy yielded 2188 articles, of which 630 duplicates were removed. In addition, 8 further studies were identified from the reference list of a relevant review [39]. Of the remaining 1566 articles, 70 were potentially eligible. During the full-text screening, 10 articles were excluded due to inappropriate study design and/or intervention, leaving 60 articles to be included in this review. The study flow diagram is shown in Supplementary Appendix 1.
Study Characteristics
Among 60 included RCTs, 36 are single-center and 24 are multicenter studies. The initial sample sizes of these studies range from 20 [40] to 960 participants [41]. In 27 studies, the minimum age for the participants was clearly stated. Thirteen studies only stated that their participants were “adults.” In 2 studies [42, 43], participants were predominantly adult men (73%–95%), while all other studies included participants of both sexes in significant proportions.
Among 60 studies, 30 were conducted in intensive care units (ICUs); 10 were conducted in hematology/oncology units; 10 enrolled a mixture of participants from ICUs, general medical or surgical units, trauma, and those receiving total parenteral nutrition (TPN); 5 were conducted in surgical units; 4 were conducted in participants receiving TPN; and 1 [44] had no description of the study setting or participant type.
Of these studies, 51 trials compared antimicrobial impregnation and no impregnation, 5 trials [41, 45–48] compared 2 different antimicrobial impregnations, and 4 trials [49–52] employed 3-arm comparison between different impregnations with or without a nonimpregnated group. A summary of study characteristics in all included studies is shown in Supplementary Appendix 2.
Methodological Quality of Included Studies
Overall, there were low or unclear risks of bias for most criteria, except blinding. In relation to performance bias, the majority of included studies (n = 47) had an unclear or high risk of bias for blinding of participants and personnel. In contrast, more than half of included studies (n = 34) had a low risk of bias in selective reporting. The summary related to risk of bias in all studies is presented in Supplementary Appendix 3.
Overall Network Meta-analysis
Apart from no impregnation, a total of 13 antimicrobial impregnations were assessed, including CSS, MNR, miconazole-rifampicin (MCR), vancomycin, teicoplanin, cefazolin, silver-platinum-carbon (SPC), SIL, silver-impregnated cuff (SIC), HEP, benzalkonium, chlorhexidine (CHX), and 5-fluorouracil (5FU). Data of 17255 catheters from 60 studies were included in the NMA. Network plots are presented in Figure 1 (primary outcomes) and Supplementary Appendix 4 (secondary outcomes). The most commonly evaluated outcomes were catheter colonization (n = 50) and CRBSI (n = 50).
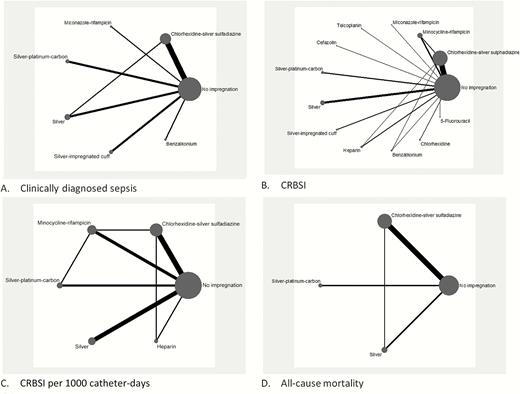
A–D, Network meta-analysis plot for primary outcomes of central venous catheters with or without impregnation. Abbreviation: CRBSI, catheter-related bloodstream infection.
For the majority of outcomes measured, no evidence of statistical heterogeneity in direct pairwise comparison and inconsistency between direct and indirect evidence were detected, except for the outcomes of catheter colonization (absolute rate and rate per 1000 catheter-days).
Primary Outcomes
Clinically Diagnosed Sepsis
Based on data from 12 studies [49, 52–62] (3686 catheters), significant reduction in clinically diagnosed sepsis was found between SIL-impregnated CVCs (SIL-I-CVC) and SIC (RR, 0.54; 95% CI, .29–.99) (Table 1).
Risk Ratios of the Effect of Central Venous Catheters With or Without Impregnation on Clinically Diagnosed Sepsis
| BZK | … | … | 0.19 (.01–3.81) | … | … | … |
| 0.62 (.01–49.52) | MCR | … | 0.30 (.01–7.21) | … | … | … |
| 0.23 (.01–4.80) | 0.37 (.01–9.08) | SIL | 0.77 (.59–1.00) | … | 0.84 (.62–1.15) | … |
| 0.19 (.01–3.82) | 0.30 (.01–7.23) | 0.81 (.61–1.06) | NO | 0.99 (.63–1.56) | 0.97 (.84–1.12) | 0.68 (.40–2.49) |
| 0.18 (.01–3.87) | 0.29 (.01–7.31) | 0.79 (.45–1.36) | 0.98 (.61–1.57) | SPC | … | … |
| 0.18 (.01–3.70) | 0.29 (.01–7.01) | 0.78 (.58–1.04) | 0.97 (.82–1.13) | 0.99 (.60–1.63) | CSS | … |
| 0.12 (.01–2.68) | 0.20 (.01–5.06) | 0.54 (.29–.99) | 0.67 (.39–1.15) | 0.69 (.33–1.41) | 0.69 (.39–1.22) | SIC |
| 82.4 | 71.3 | 68.4 | 42.7 | 40.1 | 35.2 | 9.8 |
Impregnations are ordered according to surface under the cumulative ranking curve (SUCRA). Estimates are presented as risk ratio (95% confidence interval). Results of direct comparisons were listed in the upper triangle where the estimation was calculated as the column-defining treatment compared with the row-defining treatment. Network estimates were listed in the lower triangle where the estimation was calculated as the row-defining treatment compared with the column-defining treatment. The SUCRA values are presented in the bottom row of the table. The larger the SUCRA value, the better the treatment. Significant results are shown in bold.
Abbreviations: BZK, benzalkonium; CSS, chlorhexidine-silver sulfadiazine; MCR, miconazole-rifampicin; NO, no impregnation; SIC, silver-impregnated cuff; SIL, silver SPC, silver-platinum-carbon.
Catheter-Related Bloodstream Infection
Based on data from 50 studies [18, 40–43, 45–51, 53–56, 58, 60, 62–93] (13953 catheters), MNR-impregnated CVCs (MNR-I-CVC) were associated with a significantly lower CRBSI rate compared with 5FU-impregnated CVCs (5FU-I-CVC; RR, 0.42 [95% CI, .19–.92]), CSS-impregnated CVCs (CSS-I-CVC; RR, 0.38 [95% CI, .21–.71]), CHX-impregnated CVCs (CHX-I-CVC; RR, 0.12 [95% CI, .03–.55]), and NO-I-CVC (RR, 0.29 [95% CI, .16–.52]). Similarly, this was detected in SIL-I-CVC vs CHX-I-CVC (RR, 0.25 [95% CI, .07–.87]), and vs NO-I-CVC (RR, 0.57 [95% CI, .38–.86]) (Table 2). The SUCRA results revealed that MNR-I-CVC was the most effective CVC in the prevention of CRBSI.
Risk Ratios of the Effect of Central Venous Catheters With or Without Impregnation on Catheter-Related Bloodstream Infection
| MNR | … | … | … | … | … | … | … | … | 0.26 (.11–.65) | … | 0.25 (.14–.48) | … |
| 0.71 (.23–2.14) | HEP | … | … | … | … | … | … | … | 1.29 (.30–5.66) | … | 0.23 (.07–.72) | … |
| 0.50 (.24–1.04) | 0.71 (.25–1.99) | SIL | … | … | … | … | … | … | … | … | 0.56 (.39–.81) | … |
| 0.47 (.16–1.37) | 0.66 (.18–2.42) | 0.93 (.34–2.54) | BZK | … | … | … | … | … | 0.78 (.33–1.81) | … | … | … |
| 0.51 (.01–27.00) | 0.73 (.01–40.80) | 1.02 (.02–52.42) | 1.10 (.02–61.15) | CFZ | … | … | … | … | … | … | … | … |
| 0.42 (.19–.92) | 0.59 (.20–1.74) | 0.84 (.41–1.69) | 0.90 (.33–2.46) | 0.82 (.02–42.75) | 5FU | … | … | … | 0.92 (.67–1.25) | … | … | … |
| 0.42 (.13–1.31) | 0.59 (.15–2.30) | 0.83 (.29–2.41) | 0.89 (.24–3.40) | 0.82 (.01–46.16) | 1.00 (.32–3.07) | SIC | … | … | … | … | 0.62 (.25–1.55) | … |
| 0.38 (.09–1.56) | 0.54 (.11–2.63) | 0.76 (.20–2.89) | 0.8 (.17–3.90) | 0.7 (.01–45.62) | 0.91 (.23–3.66) | 0.91 (.18–4.53) | TEC | … | … | … | 0.75 (.22–2.52) | … |
| 0.32 (.01–17.12) | 0.45 (.01–25.87) | 0.64 (.01–33.25) | 0.69 (.01–38.77) | 0.63 (.00–160.57) | 0.77 (.01–40.60) | 0.77 (.01–44.00) | 0.84 (.01–52.36) | MCR | … | … | … | … |
| 0.38 (.21–.71) | 0.54 (.21–1.41) | 0.77 (.46–1.27) | 0.82 (.34–1.98) | 0.75 (.01–37.96) | 0.92 (.56–1.50) | 0.92 (.33–2.52) | 1.01 (.27–3.71) | 1.20 (.02–61.50) | CSS | … | 0.73 (.57–.94) | … |
| 0.37 (.14–1.00) | 0.53 (.16–1.79) | 0.74 (.31–1.77) | 0.79 (.24–2.64) | 0.72 (.01–39.24) | 0.89 (.34–2.33) | 0.89 (.25–3.10) | 0.98 (.22–4.32) | 1.16 (.02–63.56) | 0.97 (.42–2.23) | SPC | 0.79 (.40–1.56) | … |
| 0.29 (.16–.52) | 0.41 (.16–1.04) | 0.57 (.38–.86) | 0.61 (.24–1.53) | 0.56 (.01–27.98) | 0.68 (.39–1.21) | 0.68 (.26–1.82) | 0.75 (.21–2.67) | 0.89 (.02–45.33) | 0.74 (.56–1.00) | 0.77 (.35–1.67) | NO | 0.43 (.13–1.37) |
| 0.12 (.03–0.47) | 0.17 (.04–.80) | 0.25 (.07–.87) | 0.26 (.06–1.19) | 0.24 (.00–14.43) | 0.29 (.08–1.11) | 0.29 (.06–1.38) | 0.32 (.06–1.86) | 0.38 (.01–23.36) | 0.32 (.09–1.10) | 0.33 (.08–1.38) | 0.43 (.13–1.43) | CHX |
| 89.7 | 74.9 | 62.4 | 56.8 | 53.3 | 50.8 | 50.3 | 45.8 | 45.4 | 44.3 | 44.0 | 24.0 | 8.4 |
Impregnations are ordered according to surface under the cumulative ranking curve (SUCRA). Estimates were presented as risk ratio (95% confidence interval). Results of direct comparisons were listed in the upper triangle where the estimation was calculated as the column-defining treatment compared with the row-defining treatment. Network estimates were listed in the lower triangle where the estimation was calculated as the row-defining treatment compared with the column-defining treatment. The SUCRA values are presented in the bottom row of the table. The larger the SUCRA value, the better the treatment. Significant results are shown in bold.
Abbreviations: BZK, benzalkonium; CFZ, cefazolin; CHX, chlorhexidine; CSS, chlorhexidine-silver sulfadiazine; 5FU, 5-fluorouracil; HEP, heparin; MCR, miconazole-rifampicin; MNR, minocycline-rifampicin; NO, no impregnation; SIC, silver-impregnated cuff; SIL, silver; SPC, silver-platinum-carbon; TEC, teicoplanin.
Catheter-Related Bloodstream Infection per 1000 Catheter-Days
Suitable data from 18 studies [18, 45–47, 49, 58, 64, 65, 70, 72, 75, 82, 83, 86, 87, 89, 90, 92] (6279 catheters) contributed to this NMA. It revealed that significant reduction in the rate of CRBSI per 1000 catheter-days was associated with MNR-I-CVC compared with CSS-I-CVC (rate ratio, 0.28 [95% CI, .09–.87]) and NO-I-CVC (rate ratio, 0.28 [95% CI, .11–.74]) (Table 3). Consistently, based on SUCRA findings, MNR-I-CVC impregnation was the most effective CVC in the prevention of CRBSI per 1000 catheter-days.
Rate Ratios of the Effect of Central Venous Catheters With or Without Impregnation on Catheter-Related Bloodstream Infection per 1000 Catheter-Days
| MNR | … | … | 0.85 (.23–3.13) | 0.07 (.01–0.56) | 0.35 (.11–1.12) |
| 0.54 (.10–2.74) | HEP | … | … | 1.25 (.28–5.57) | 0.26 (.03–2.59) |
| 0.47 (.14–1.67) | 0.89 (.18–4.25) | SIL | … | … | 0.61 (.35–1.05) |
| 0.49 (.13–1.86) | 0.92 (.14–5.90) | 1.03 (.22–4.83) | SPC | … | 0.79 (.17–3.55) |
| 0.28 (.09–.87) | 0.53 (.14–2.02) | 0.59 (.20–1.73) | 0.57 (.13–2.46) | CSS | 1.20 (.70–2.06) |
| 0.28 (.11–.74) | 0.53 (.14–2.02) | 0.60 (.26–1.35) | 0.58 (.16–2.14) | 1.01 (.51–2.01) | NO |
| 81.1 | 80.9 | 55.8 | 32.9 | 25.9 | 23.4 |
Impregnations are ordered according to surface under the cumulative ranking curve (SUCRA). Estimates were presented as rate ratio (95% confidence interval). Results of direct comparisons were listed in the upper triangle where the estimation was calculated as the column-defining treatment compared with the row-defining treatment. Network estimates were listed in the lower triangle where the estimation was calculated as the row-defining treatment compared with the column-defining treatment. The SUCRA values are presented in the bottom row of the table. The larger the SUCRA value, the better the treatment. Estimates that show statistically significant difference are shown in bold.
Abbreviations: CSS, chlorhexidine-silver sulfadiazine; HEP, heparin; MNR, minocycline-rifampicin; NO, no impregnation; SIL, silver; SPC, silver-platinum-carbon.
All-Cause Mortality
Based on 10 studies [49, 52, 53, 56, 72, 75, 80, 82, 94, 95] (2643 catheters), there was no evidence of significant reduction in all-cause mortality among all 4 competing interventions (Table 4).
Risk Ratios of the Effect of Central Venous Catheters With or Without Impregnation on All-Cause Mortality
| SPC | … | 0.81 (.59–1.12) | … |
| 0.94 (.64–1.37) | CSS | 0.88 (.71–1.08) | 1.36 (.72–2.58) |
| 0.81 (.59–1.13) | 0.87 (.71–1.07) | NO | 0.90 (.70–1.15) |
| 0.73 (.49–1.09) | 0.78 (.58–1.05) | 0.89 (.71–1.13) | SIL |
| 82.3 | 74.2 | 34.0 | 9.6 |
| SPC | … | 0.81 (.59–1.12) | … |
| 0.94 (.64–1.37) | CSS | 0.88 (.71–1.08) | 1.36 (.72–2.58) |
| 0.81 (.59–1.13) | 0.87 (.71–1.07) | NO | 0.90 (.70–1.15) |
| 0.73 (.49–1.09) | 0.78 (.58–1.05) | 0.89 (.71–1.13) | SIL |
| 82.3 | 74.2 | 34.0 | 9.6 |
Impregnations are ordered according to surface under the cumulative ranking curve (SUCRA). Estimates were presented as risk ratio (95% confidence interval). Results of direct comparisons were listed in the upper triangle where the estimation was calculated as the column-defining treatment compared with the row-defining treatment. Network estimates were listed in the lower triangle where the estimation was calculated as the row-defining treatment compared with the column-defining treatment. The SUCRA values are presented in the bottom of the table. The larger the SUCRA value, the better the treatment.
Abbreviations: CSS, chlorhexidine-silver sulfadiazine; NO, no impregnation; SIL, silver; SPC, silver-platinum-carbon.
Secondary Outcomes
Catheter-Related Local Infections
Thirteen studies [41, 53, 56, 59, 62, 66, 73, 74, 76–78, 89, 91] (3648 catheters) were included. It revealed that MCR-impregnated CVCs (MCR-I-CVC) significantly reduced the rate of catheter-related local infection compared with CSS-I-CVC (RR, 0.26 [95% CI, .09–.70]), MNR-I-CVC (RR, 0.21 [95% CI, .05–.97]), 5FU-I-CVC (RR, 0.16 [95% CI, .03–.89]), and NO-I-CVC (RR, 0.25 [95% CI, .01–.64]) (Supplementary Appendix 5). Based on SUCRA results, MCR-I-CVC was the most effective CVC in preventing catheter-related local infections.
Catheter Colonization
Fifty studies [41–43, 45–49, 51–53, 55–73, 75–77, 79–84, 86, 87, 89–92, 94–98] (9094 catheters) were included. Evidence of significant inconsistency was detected at the loop of NO-CSS-MNR (inconsistency factor 0.9), specifically at the CSS-MNR node. Despite our attempts to identify the potential source of inconsistency based on study characteristics and conducting subgroup analyses based on baseline risk, the heterogeneity and inconsistency remained substantial [27]. Consequently, the inconsistency model was performed to estimate the treatment effect.
The NMA revealed that MCR-I-CVC significantly decreased the rate of catheter colonization compared with CSS-I-CVC (RR, 0.23 [95% CI, .09–.62]), benzalkonium-impregnated CVC (RR, 0.24 [95% CI, .08–.72]), SIC (RR, 0.23 [95% CI, .08–.73]), vancomycin-coated CVC (RR, 0.18 [95% CI, .06–.54]), silver-platinum-carbon–impregnated CVCs (RR, 0.15 [95% CI, .06–.42]), SIL-I-CVC (RR, 0.10 [95% CI, .03–.33]), and NO-I-CVC (RR, 0.14 [95% CI, .05–.36]). We also found significant reduction of catheter colonization rate in 5FU-I-CVC (RR, 0.34 [95% CI, .14–.82]) compared with NO-I-CVC (Supplementary Appendix 5). Based on SUCRA results, MCR-I-CVC was the most effective CVC in the prevention of catheter colonization.
Catheter Colonization per 1000 Catheter-days
Fourteen studies [45, 47, 49, 52, 57, 64, 70, 72, 75, 83, 86, 87, 89, 94] (4662 catheters) were included. Evidence of significant inconsistency was detected at the NO-CSS-SIL loop (inconsistency factor 1.3), specifically at NO-CSS and CSS-SIL nodes. Similar efforts were undertaken as in the network of catheter colonization; however, the inconsistency remained unexplainable. Hence, the inconsistency model was performed.
It is important to note that MCR-I-CVC was not included in this NMA. Therefore, this NMA revealed that CSS-I-CVC significantly decreased the rate of catheter colonization per 1000 catheter-days when compared with NO-I-CVC (rate ratio, 0.49 [95% CI, .28–.88]) (Supplementary Appendix 5). Based on the SUCRA results, CSS-I-CVC was the most effective CVC in the prevention of catheter colonization per 1000 catheter-days.
Other Secondary Outcomes
For the remaining 4 secondary outcomes, their respective NMAs showed no significant reduction on the rate of these outcomes among all competing interventions included (Supplementary Appendix 5).
Subgroup Analyses
Regardless of patients’ baseline risk and participant types, MNR-I-CVC significantly reduced CRBSI compared with NO-I-CVC. For catheter colonization, inconsistency model was employed in the NMA of higher risk groups and ICU due to the presence of inconsistency. Compared to NO-I-CVC, a significant reduction in catheter colonization rate was associated with MCR-I-CVC, 5FU-I-CVC, and CSS-I-CVC in the higher risk groups, whereas it was MNR-I-CVC and CSS-I-CVC in the lower risk groups. Findings from subgroup analyses are presented in Supplementary Appendix 6.
Assessment of Publication Bias
Based on the visual inspection of comparison-adjusted funnel plots, there was no evidence of publication bias as indicated by the symmetrical distribution around the vertical line (x = 0) for majority of the outcomes (Supplementary Appendix 7). However, an asymmetrical distribution was noted in clinically diagnosed sepsis. This is suggestive of possible publication bias attributed by the absence of small studies that demonstrated increased risk in the impregnated group, particularly between CSS and NO.
GRADE Quality Assessment
Given the substantial number of comparisons in the primary outcomes, the quality of evidence was appraised for major pairwise comparisons. Therefore, 10 significant pairwise comparisons were assessed: 7 from CRBSI, 2 from CRBSI per 1000 catheter-days, and 1 from clinically diagnosed sepsis. Across these comparisons, quality of evidence varied greatly from very low to high. Of NMA evidence, 2 comparisons (20%) were found to be of high quality, 3 (30%) of moderate quality, 3 (30%) of low quality, and 2 (20%) of very low quality (Table 5). Imprecision and risk of bias were 2 main factors leading to down-rating of the quality.
Quality of Evidence for Statistically Significant Pairwise Comparisons of Central Venous Catheters for Primary Outcomes
| Treatment Comparison | Direct Evidence | Indirect Evidence | Network Evidence | |||
|---|---|---|---|---|---|---|
| RR (95% CI) | Quality of Evidence | RR (95% CI) | Quality of Evidence | RR (95% CI) | Quality of Evidence | |
| Clinically diagnosed sepsis | ||||||
| SIL vs SIC | NA | NA | 0.54 (.29–.99) | Very lowa | 0.54 (.29–.99) | Very low |
| SIL vs NOb | 0.77 (.59–1.00) | Very lowa,c,d | NA | NA | NA | NA |
| SIC vs NOb | 1.47 (.40–2.50) | Very lowa,c,d | NA | NA | NA | NA |
| CRBSI | ||||||
| MNR vs 5FU | NA | NA | 0.42 (.19–.93) | Very lowa | 0.42 (.19–.93) | Very low |
| MNR vs CSS | 0.41 (.14–1.19) | Lowa,c | 0.37 (.18–.79) | Low | 0.38 (.21–.71) | Low |
| MNR vs NO | 0.28 (.14–.55) | High | 0.31 (.10–.99) | Very lowa | 0.29 (.16–.52) | High |
| MNR vs CHX | NA | NA | 0.12 (.03–.55) | Moderate | 0.12 (.03–.55) | Moderate |
| HEP vs CHX | NA | NA | 0.17 (.03–.92) | Lowa | 0.17 (.03–.92) | Low |
| SIL vs CHX | NA | NA | 0.25 (.07–.87) | Lowc | 0.25 (.07–.87) | Low |
| SIL vs NO | 0.56 (.39–.81) | Moderatec | Not estimablee | NA | 0.57 (.38–.86) | Moderate |
| 5FU vs CSSb | 0.92 (.67–1.25) | Lowa,c | NA | NA | NA | NA |
| CSS vs NOb | 0.73 (.57–.94) | Lowa,c | NA | NA | NA | NA |
| CHX vs NOb | 2.37 (.63–8.96) | Moderatea | NA | NA | NA | NA |
| HEP vs NOb | 0.23 (.07–.72) | High | NA | NA | NA | NA |
| CRBSI per 1000 catheter-days | ||||||
| MNR vs CSS | 0.07 (.01–.75)f | High | 0.42 (.12–1.42)f | Very lowa | 0.28 (.09–.87)f | High |
| MNR vs NO | 0.31 (.10–.98)f | Moderatea | 0.23 (.04–1.35)f | Very lowa | 0.28 (.11–.74)f | Moderate |
| CSS vs NOb | 1.20 (.70–2.06)f | Lowa,c | NA | NA | NA | NA |
Abbreviations: CHX, chlorhexidine; CI, confidence interval; CRBSI, catheter-related bloodstream infection; CSS, chlorhexidine-silver sulfadiazine; 5FU, 5-fluorouracil; HEP, heparin; MNR, minocycline-rifampicin; NA, not applicable; NO, no impregnation; RR, risk ratio; SIC, silver-impregnated cuff; SIL, silver.
aImprecision (wide 95% CI, include or are close to null effect).
bPairwise comparison of a first-order loop where quality of evidence for direct estimate was assessed to determine the initial rating for specific indirect evidence.
cRisk of bias (blinding).
dPublication bias.
eCannot be estimated because the intervention was not connected in a loop in the evidence network.
fRate ratio.
DISCUSSION
In this NMA, MNR-I-CVC appeared to be the most effective in reducing CRBSI among impregnated CVCs. Despite varying quality of evidence for significant pairwise comparisons in the primary outcomes, moderate- to high-quality evidence was found in most outcomes between MNR and no impregnations. Significant reduction in the risk of clinically diagnosed sepsis was associated with SIL-I-CVC compared with SIC, but found to be very low in quality. However, no significant difference among interventions was demonstrated with respect to all-cause mortality.
Based on the largest evidence base on catheter colonization, our findings suggested that MCR-I-CVC was the most effective in preventing catheter colonization. The results were consistent irrespective of the patients’ baseline risks in subgroup analyses. Consequently, dual-antimicrobial-impregnated CVCs seemed to be the most effective for preventing catheter-specific outcomes. This was likely due to the broad spectrum of inhibitory activity against many gram-positive and—negative bacteria contributed by the combination of minocycline/miconazole and rifampicin. Furthermore, this might be due to the intraluminal and extraluminal coating of MNR- or MCR-I-CVC [46] that was found to be superior to those coated only externally [99, 100].
Considering that catheter colonization is a good surrogate endpoint for CRBSI [101], inconsistent findings were noted in our review. When compared to no impregnation, significant reduction in the rate of catheter colonization was demonstrated by MCR-I-CVC, but this was not accompanied with significant reduction in CRBSI. Despite the broader antimicrobial spectrum by MCR in which it also inhibits Candida albicans, Pseudomonas aeruginosa, Enterobacter species, and Escherichia coli [102], the limited evidence in the prevention of CRBSI by MCR-I-CVC [62] undermines its potential efficacy. This warrants further exploration of its use in preventing CRBSI.
Remarkably, our findings were at odds with that of a previous NMA by Wang et al [39]. First, Wang et al [39] showed that when compared to no impregnation, HEP-I-CVC significantly lowered the CRBSI rate, whereas our review showed a significant decrease in CRBSI with SIL-I-CVC. For catheter colonization, Wang et al [39] found that MNR-I-CVC significantly reduced its rate compared with no impregnation [39], whereas our review showed otherwise. We believe that sources of these discrepancies are 2-fold, mainly due to the more comprehensive body of evidence consisting of 60 trials with 17255 CVCs contributing to our NMA, as opposed to only 48 trials with 12828 CVCs in Wang et al [39], resulting in an additional 11 studies [40, 41, 44, 49, 50, 61, 70, 82, 91, 97, 98] in our study. Given differences in inclusion criteria applied, 3 studies [103–105] in Wang et al [39] were excluded in our review as hemodialysis patients or children were involved. Therefore, these may have contributed to differences in our findings. However, our review showed similar superiority of MNR-I-CVC in CBRSI and MCR-I-CVC in catheter colonization.
Our study has several limitations. First, due to nonblinding in majority of the included studies, benefits of impregnated CVCs may have been overestimated. However, blinding was impossible as impregnated and nonimpregnated CVCs differed in appearance. Second, none of the subgroup analyses conducted could explain the significant heterogeneity and inconsistency arising from catheter colonization. However, for the other outcomes, the low statistical heterogeneity and absence of inconsistency between direct and indirect comparisons support the validity of our findings. Third, even though we included clinically important outcomes such as sepsis and mortality in our review, the body of evidence is still insufficient to enable a meaningful ranking among the types of impregnated CVCs. Finally, the lack of head-to-head trials hindered an accurate estimate among antimicrobial-impregnated CVCs.
The Infectious Diseases Society of America (IDSA) recommends either CSS-I-CVC or MNR-I-CVC as the CVC of choice in preventing CRBSI when in situ long-term catheterization is expected (≥5 days) and the risk of CRBSI exceeds 3.3 per 1000 catheter-days despite implementing bundled standard procedures [1]. Our review showed a clear superiority of MNR- I-CVC over CSS-I-CVC in reducing CRBSI (RR, 0.38 [95% CI, .21–.71]). However, there remain uncertainties on the benefits of MNR-I-CVCs on other clinically important outcomes that affect overall patient morbidity and mortality. Another important concern is the possible development of antibiotic resistance, although data showed no increased risk of multidrug-resistant organisms isolated from blood cultures attributed to MNR- I-CVC in 5 included studies [46, 87, 90, 97, 106]. Among related in vitro and clinical studies [24, 107–113], there is scarcity of evidence demonstrating the emergence of multidrug-resistant organisms toward minocycline and rifampicin following their use [19, 24, 107, 109]. Nonetheless, future head-to-head trials comparing the benefits and safety of different impregnated catheters should incorporate key outcomes that include the risk of antibiotic resistance.
In summary, this review provided robust evidence supporting MNR-I-CVC as potentially the most effective strategy for the prevention of CRBSI. In view of the scanty evidence related to clinically important outcomes, its overall benefit remains uncertain, and caution is needed in the overall clinical decision making and guideline development. Surveillance for antibiotic resistance attributed to the routine use of MNR-I-CVC should be emphasized in future trials.
Notes
Author contributions. N. C. and N. M. L. designed the review. N. M. L., N. C., and H. Y. C. identified relevant studies and extracted data. H. Y C. analyzed and interpreted data. All other authors (N. M. L., A. A., and N. C.) contributed to data interpretation. H. Y. C. and N. M. L. wrote the first draft of the article. All authors critically revised the article and approved the final version.
Acknowledgments. We thank the support of the Cochrane Review Group in publishing the Cochrane Review.
Supplement sponsorship. This article appears as part of the supplement “Infection Prevention in Asia Pacific,” sponsored by the Infectious Diseases Association of Thailand (IDAT).
Financial support. This study was not funded.
Potential conflicts of interest. All authors: No potential conflicts. All authors have submitted the ICMJE Form for Disclosure of Potential Conflicts of Interest. Conflicts that the editors consider relevant to the content of the manuscript have been disclosed.
References
Author notes
Correspondence: N. Chaiyakunapruk, School of Pharmacy, Monash University Malaysia, Jalan Lagoon Selatan, 46150 Bandar Sunway, Selangor, Malaysia ([email protected]).

