


Abstract
Optimal use of mass/targeted screen-and-treat or mass or focal drug administration as malaria elimination strategies remains unclear. We therefore studied spatial distribution of Plasmodium falciparum infections to compare simulated effects of these strategies on reducing the parasite reservoir in a pre-elimination setting.
P. falciparum rapid diagnostic tests (RDTs) and molecular (polymerase chain reaction [PCR]) and serological (enzyme-linked immunosorbent assay) analyses were performed on finger-prick blood samples from a population-based survey in 3 adjacent communities.
Among 5278 persons screened, 13 (0.2%) were positive by RDT and 123 (2.3%) by PCR. PCR-positive individuals were scattered over the study area, but logistic regression analysis suggested a propensity of these infections to cluster around RDT-positive individuals. The odds ratios for being PCR positive was 7.4 (95% confidence interval, 2.8–19.9) for those living in the household of an RDT-positive individual and 1.64 (1.0–2.8; P = .06) for those living within <300 m, compared with >1000 m. Treating everyone within households of RDT-positive individuals (1% population) would target 13% of those who are PCR positive. Treating all living within a radius of <300 or <1000 m (14% or 58% population) would target 30% or 66% of infections, respectively. Among 4431 serologically screened individuals, 26% were seropositive. Treating everyone within seropositive households (63% population) would target 77% of PCR-positive individuals.
Presumptive malaria treatment seemed justified within RDT-positive households and potentially worth considering within, for example, a radius of <300 m. Serology was not discriminative enough in identifying ongoing infections for improving focal interventions in this setting but may rather be useful to detect larger transmission foci.
Malaria infections may become more focal as transmission intensity decreases. In Zanzibar, a pre-elimination setting in sub-Saharan Africa, foci of residual P. falciparum transmission are primarily identified through passive detection and reporting of malaria-confirmed patients presenting at public health facilities. In such foci, or simply in proximity to parasitologically confirmed malaria cases, targeted interventions may be considered to reduce the reservoir of asymptomatic and low-density infections [1–4]. These infections pose a risk for onward transmission [5–7] and therefore constitute a potential barrier for malaria elimination [8]. Mass or focal screening and treatment (MSAT or FSAT) and mass or focal drug administration (MDA or FDA) represent important options for such targeted strategies. In Zanzibar, a reactive FSAT strategy has been in place since 2012. Its aim is to identify and treat asymptomatic parasite carriers, and it involves performing rapid diagnostic tests (RDTs) in all household members of patients with parasitologically confirmed malaria diagnoses at public health facilities. This intervention could potentially also include households surrounding the index house.
The efficiency of FSAT will largely depend on the existence and characteristics of spatial clustering of malaria infections, but data on spatial distribution of infections with especially low parasite density in the context of malaria elimination are scarce. In 1 high-endemicity area in Tanzania, low-density infections tended to accumulate within a hot-spot area and within infected households [9]. In lower-endemicity areas, findings of a study in Cambodia suggested some clustering of low-density infections along the main river [10], and 2 studies from Zambia and Kenya have suggested some clustering within infected households [11, 12]. The effectiveness of FSAT will also depend on the sensitivity of the malaria diagnostic tool, and in Zanzibar as elsewhere, RDTs will miss a large proportion of low-density infections [13, 14].
Molecular diagnostic tools such as polymerase chain reaction (PCR) have much higher sensitivities than RDT or microscopy [7, 15, 16] but require high-quality laboratory conditions and expensive equipment and are not suitable for point-of-contact diagnosis. More field-friendly alternatives, such as loop-mediated isothermal amplification, may overcome some of these issues [17–21] but remain more expensive than RDTs and are not yet applicable to routine community malaria testing.
An alternative screening approach is using serological indices, which measure Plasmodium-specific antibodies that develop after exposure to infection. Serology could potentially be used to identify individuals or households at increased risk of infection [22, 23] and thus possible targets for presumptive treatment, that is, FDA.
In 2012, an MSAT campaign using P. falciparum–specific RDT took place in a malaria hot-spot area in Zanzibar [13]. A postcampaign molecular screening of the same survey samples identified a large proportion of low-density P. falciparum infections that were not detected by RDT. In the present study, we assessed the spatial distribution of these PCR-determined infections in relation to the RDT-detected infections. We also investigated the implications this distribution may have for different FSAT and FDA approaches, and we assessed the usefulness of serological analyses as a screening tool to detect and identify individuals or households at risk of exposure to infection.
METHODS
Study Area and Sample Collection
Zanzibar is a semiautonomous archipelago located approximately 35 km from the coast of mainland Tanzania. It is a malaria pre-elimination setting with temporally and spatially clustered transmission. This study is based on a subset of data from 2 rounds of MSAT undertaken in May and June 2012. The MSAT and results have been described elsewhere [13]. Briefly, the MSAT was undertaken in malaria hot spots identified through passive health facility–based surveillance systems. Screening took place in 5 shehias (administrative units). To allow for detailed spatial analyses, the present study is based on the data from the 3 geographically adjacent shehias (Bungi, Tunguu, and Jumbi; 2012 census population, 10015 persons) in Central district, Unguja island (Figure 1). The screening teams recorded 6459 persons from 1625 households. The location of each house was recorded using hand-held global positioning system devices (Garmin).
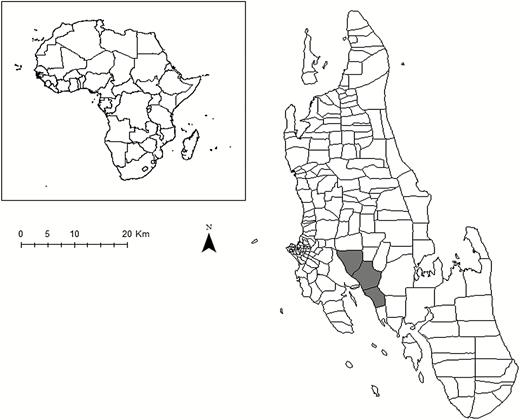
Location of study sites in Unguja island, Zanzibar.
All household members present and consenting at the time of study visit were screened using a P. falciparum–specific RDT (Paracheck Pf; Orchid Biomedical Systems) and treated with artesunate-amodiaquine if results were positive. Significant ongoing clinical symptoms were recorded, including fever. Finger-prick blood samples were also collected on filter paper for subsequent PCR (both rounds) and serological (first round only) analyses. Filter papers were stored in individually sealed bags with desiccant at 4°C until use.
Laboratory Methods
PCR Analyses
PCR analyses took place in Sweden, as described elsewhere [13]. Briefly, the Chelex boiling method [24] was used to extract DNA from a 3-mm-diameter dry blood spot punch corresponding to 3–5 µL of blood. Cytb-qPCR with the SYBR Green real-time PCR assay, targeting the Plasmodium cytochrome b gene [25] was used for infection detection. An 18S quantitative PCR method was used thereafter for parasite density quantification in all PCR-positive samples [26]. Because the RDT used was P. falciparum specific, the results in this study focus only on P. falciparum.
Serological Analysis
Antibodies to P. falciparum AMA-1 and MSP-119 were measured using enzyme-linked immunosorbent assay [27]. A threshold for seropositivity to each antigen was determined using mixture model methods [28]. The enzyme-linked immunosorbent assay output was converted into an age-adjusted antibody response [29]. Briefly, LOESS lines were assessed to determine the age at which the relationship between log antibody titer (for each antigen separately) and age became nonlinear. Individual responses were then assigned residuals from linear regression of log antibody titer and age for their age category. Assuming a homogenous distribution of risk, residuals <0 represent individuals with lower-than-average antibody titers for their age, and residuals >0 represent those whose responses were higher than average. Serological analyses were undertaken for the first round of MSAT only.
Data Analyses
Clustering of PCR-Positive Around RDT-Positive Individuals
Because matched samples were not obtained for all residents during the 2 rounds of screening, the data were merged so that each individual had a single RDT and PCR result. For individuals with data from both rounds, the result from the first survey was used. This ensured that every individual had an equal probability of being positive by PCR or RDT. In this merged data set, 2 of the RDT-positive individuals were negative by PCR [13]. They were left in the analyses, however, to simulate field programmatic conditions and also because they may represent circulating antigen from a recent infection [30] and may be indicative of clustering.
To assess distance associations of PCR-positive around RDT-positive individuals, the straight-line distance to the nearest RDT-positive individual in kilometers was calculated for each person and included as a term in a logistic regression model, with PCR result (positive or negative) as the outcome. A household-level random effect was included to account for correlation between individuals within the same house. A linear fit of distance was compared with a quadratic fit. Distance from RDT-positive individuals was also investigated as a categorical variable (within household or within a radius from households of 100, 100–300, 300–1000, or >1000 m).
Clustering of Serological Responses Around RDT-Positive Individuals
Antibodies to malaria antigens indicate previous exposure to infection. To assess whether such exposed individuals were clustered around RDT-positive individuals, we examined the relationship between seroprevalence and age-adjusted antibody titer of AMA-1 and MSP-119 markers with distance to the RDT-positive individual. A high antibody response is more likely to represent a current or recent infection. Only those who had experienced historic transmission (ie, were without active infection and PCR negative) were included in this analysis. Distance to RDT-positive individuals was explored as a linear, quadratic, and binary (inside or outside household of an RDT-positive individual) term. As for the PCR-positive clustering analysis, a household-level random effect was included.
Simulating Different Antimalarial Treatment Strategies
Two treatment strategies were simulated and compared in terms of the proportion of overall infections that would be treated: (1) presumptive treatment of all individuals living within a given radius of RDT-positive individuals and (2) presumptive treatment of seropositive individuals or all individuals within their households. The potential impact of these strategies on transmission was estimated by simulating the proportion of mosquitoes that would become infected after implementation of the different treatment strategies. Data on infectivity rates were taken from 2 previous studies in which the estimated infectivity rates of patent infections were increased 4.0-fold [7] and 10.2-fold [31] relative to subpatent infections. We assumed that the RDT in our study had parasite density limit of detection comparable to that of high-quality microscopy in the previous studies. RDT- and PCR-positive infections were thus classified as patent, whereas RDT-negative and PCR-positive infections were classified as subpatent. The impact on transmission was then assessed in terms of the proportion of infections in mosquitoes that would be avoided with different treatment strategies.
Ethical Considerations
Informed consent was obtained from the head of household and from each individual household member. The study was considered part of the Ministry of Health malaria surveillance strategy and did not require ethical approval within Zanzibar. The laboratory analyses received ethical approval through the Regional Ethics Review Board, Stockholm (2013/836-32).
RESULTS
Study Population
A total of 5278 persons from 1625 households with valid global positioning system data were screened at least once during the 2 rounds of MSAT intervention in the 3 shehias. More female than male subjects were tested (61% vs 39%) and this imbalance was most pronounced in those aged 15–50 years, of whom two-thirds of those tested were female.
RDT- and PCR-Detectable P. falciparum Infections
A total of 13 individuals (0.2%) from 11 households (0.7%) were RDT positive, and 123 individuals (2.3%) from 114 households (7.0%) were PCR positive, all recorded as asymptomatic. Eleven of the 13 RDT-positive individuals were confirmed positive by PCR. The estimated P. falciparum densities of the PCR-positive infections are presented in Table 1. The median parasite densities were 262/µL (range, 12–1108/µL) and 2.9/µL (range <0.1 to 16130/µL) for the RDT-positive and RDT-negative infections, respectively.
Plasmodium falciparum Parasite Densities in 121 PCR- Positive individuals as Determined With Real-Time PCR in RDT-Positive and RDT-Negative Individuals
| Parasite Density, Parasites/µL | RDT Positive | RDT Negative |
|---|---|---|
| Nonquantifiable | 0 | 20 |
| 0.1–0.9 | 0 | 22 |
| 1.0–9.9 | 0 | 35 |
| 10–99 | 4 | 24 |
| 100–999 | 5 | 7 |
| 1000–9999 | 2 | 1 |
| ≥ 10 000 | 0 | 1 |
| Parasite Density, Parasites/µL | RDT Positive | RDT Negative |
|---|---|---|
| Nonquantifiable | 0 | 20 |
| 0.1–0.9 | 0 | 22 |
| 1.0–9.9 | 0 | 35 |
| 10–99 | 4 | 24 |
| 100–999 | 5 | 7 |
| 1000–9999 | 2 | 1 |
| ≥ 10 000 | 0 | 1 |
Abbreviations: PCR, polymerase chain reaction; RDT, rapid diagnostic test.
The spatial distributions of RDT- and PCR-positive individuals are shown in Figure 2. Both the RDT-positive and PCR-positive individuals were scattered throughout the study area. The risk of being PCR positive, however, was negatively linearly associated with distance in kilometers to households with RDT-positive individuals (odds ratio [OR], 0.57; P = .001), although no association was found when distance was included as a quadratic term. When distance to an RDT-positive individual was included as a categorical variable, living within the household of an RDT-positive represented the highest risk (Table 2), with an OR of 7.4 (95% confidence interval [CI], 2.8–19.9) compared with living >1000 m from an RDT-positive household. The corresponding OR of living <300 m from an RDT-positive household was 1.64 (95% CI, 1.0–2.8; P = .06). A likelihood ratio test suggested that including distance to the nearest RDT-positive household provided a better fit when included as categorical variable rather than a linear term. Figure 3 shows the proportions of individuals screened and infections found as a function of distance to RDT-positive households.
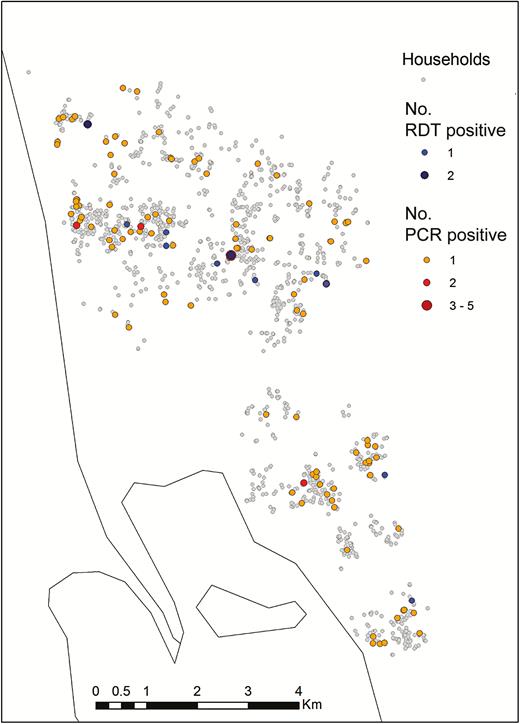
Spatial distribution of households with rapid diagnostic test (RDT)– and/or polymerase chain reaction (PCR)–positive household members.
Risk of being Plasmodium falciparum Infected (PCR Positive) by Proximity to an Identified RDT-Positive Individual or by Serostatus
| Residence or Serostatus | PCR Positive (95% CI), % | OR (95% CI)a |
|---|---|---|
| Proximity of residence to RDT-positive individual | ||
| Same household | 11.5 (4.2–25.5) | 7.4 (2.8–19.9) |
| <100-m radius | 2.2 (0.7–5.8) | 1.2 (0.4–3.3) |
| 100–300 m | 3.4 (2.1–5.4) | 1.8 (1.0–3.2) |
| 300–1000 m | 1.9 (1.4–2.6) | 1.0 (0.7–1.6) |
| >1000 m | 1.9 (1.4–2.5) | 1.0 (baseline) |
| Serostatus | ||
| Seropositiveb | 5.0 (3.9–6.5) | 3.5 (2.2–5.5) |
| Seronegative in seropositive household | 1.3 (0.8–2.0) | 0.9 (0.5–1.6) |
| Living in seronegative household | 1.5 (1.0–2.2) | 1.0 (baseline) |
Abbreviations: CI, confidence interval; OR, odds ratio; PCR, polymerase chain reaction; RDT, rapid diagnostic test.
aUnivariate logistic regression for likelihood of being PCR positive.
bSeropositive to AMA-1 and/or MSP-119.
![Proportions of persons included (red), polymerase chain reaction–determined infections treated (blue), and mosquito infections prevented (upper [dark green] and lower [light green] estimates), in relation to distance from rapid diagnostic test–positive individuals, estimated by simulated analyses.](https://oup.silverchair-cdn.com/oup/backfile/Content_public/Journal/cid/64/9/10.1093_cid_cix136/1/m_cix13603.jpeg?Expires=1750206781&Signature=ukyIW2~D4xUIdGuOClYeYBavcruWMwgiiKa7Bjs48V-fuUMdUUKGs9i2CwvtDo0mFHivYNUTcMBQQzNp54g7AGDF-PmOzRtrfE1I-GiWtzJg3tXnX8A3QEpzLR1wpGfheqz4jkCooG8uF-LCxTYaVzgf~ZNwafyvztef9DVrle9OhAcBZDTyfZTLtPIo5P6DxqZ0hCROzx4dP8KJ1xbMPV1MMz0gEXmD2lzDj16cH5G6jnDHHhawEvrSuNE0ZcXmzmUeOwkGNsO6Ni--BnUYM3pR22K8LryEQ46-M0FHWSyo3jEaHsArQ9XrmUJ2eOTYCGD4MRpdsNTZbJpC2hlMHg__&Key-Pair-Id=APKAIE5G5CRDK6RD3PGA)
Proportions of persons included (red), polymerase chain reaction–determined infections treated (blue), and mosquito infections prevented (upper [dark green] and lower [light green] estimates), in relation to distance from rapid diagnostic test–positive individuals, estimated by simulated analyses.
Valid serological responses were recorded from 4431 individuals at the first screening round, of whom 1170 (26.4%) were positive for MSP-119 and/or AMA-1 (Table 3), and 63% of households tested had ≥1 seropositive individual present. Both seropositivity and age-adjusted antibody responses for AMA-1 and MSP-119 were higher among RDT- and PCR-positive individuals than among those with negative test results (Figure 4). Hence, 8 of 10 RDT-positive (80%) and 54 of 103 of PCR-positive (52%) individuals were seropositive (Figure 4B). Conversely, PCR-positive infections were detected in 54 of 1074 seropositive individuals (5.0%) (Table 2).
Impact of Different Simulated Treatment Strategies Based on Positive RDT and Serological Screening Results
| Treatment Strategy | Persons Treated, % | PCR-Positive Infections Treated, % | Mosquito Infections Avoided, %a |
|---|---|---|---|
| All RDT-positive individuals | 0.2 | 8.9 | 28.2–44.7 |
| All members of households with ≥1 RDT-positive individual | 1.0 | 13.0 | 31.4–52.2 |
| All living within given radius of RDT-positive individual | |||
| <100 m | 4.4 | 16.2 | 34.0–53.9 |
| <300 m | 13.9 | 30.1 | 44.9–61.5 |
| <1000 m | 57.6 | 65.9 | 73.1–81.2 |
| All individual with positive results | |||
| AMA | 19.6 | 45.7 | 47.9–50.3 |
| MSP-119 | 14.7 | 41.1 | 41.8–42.6 |
| AMA or MSP-119 | 26.4 | 56.8 | 62.0–66.9 |
| All members of households with | |||
| ≥1 AMA-positive individual | 49.9 | 67.0 | 71.9–77.2 |
| ≥1 MSP-119–positive indivudal | 41.6 | 61.0 | 64.7–68.8 |
| ≥1 AMA- or MSP-119–positive individual | 62.8 | 76.8 | 82.6–88.1 |
Abbreviations: PCR, polymerase chain reaction; RDT, rapid diagnostic test.
aShown as range, with lower estimates assuming infectivity rates in reference [7] and higher estimates according to reference [31].
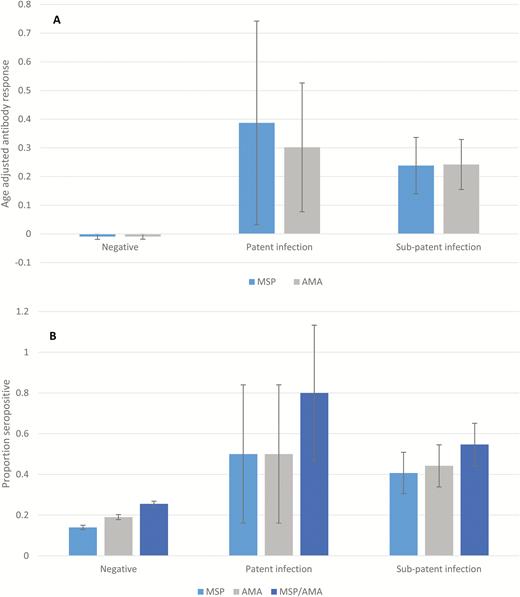
A, Age-adjusted mean antibody responses for MSP-119 (dark gray) and AMA-1 (light gray) by infection status. B, Proportion seropositive to MSP-119 and AMA-1 by infection status. Confidence intervals calculated allowing for clustering within households and shehias. No infection was defined as rapid diagnostic test (RDT) and polymerase chain reaction (PCR) negative; patent infection, as RDT positive; and subpatent infection, as PCR positive and RDT negative.
Age-adjusted antibody responses to MSP-119 in PCR-negative individuals displayed a slightly negative linear relationship with distance to RDT-positive individuals (coefficient, –0.02; P = .01). This relationship was not found with responses to AMA-1 when distance was included as a linear, quadratic, or binary variable (inside vs outside the household of an RDT-positive individual). No relationship was found between age-adjusted responses to either antigen or distance to nearest PCR-positive individual.
Simulating Different Treatment Approaches
The implications and impact of different targeted treatment strategies are highlighted in Table 3 and Figure 3. According to the estimates, a reduction in onward transmission of 28.2%–44.7% would be achieved by treating only the 13 RDT-positive infections (8.9% of PCR-positive infections). Treating all members in the RDT-positive households would have targeted another 4.1% of infections and prevented a further 3.2%–7.5% of mosquito infections. If all living within 1000 m of the RDT-positive individuals (57.6% of the population) are included, 65.9% (95% CI, 57.1–73.7) of all PCR-determined infections would be treated, and >70% of mosquito infections avoided.
If seropositivity was used as a basis for targeting treatment, treating all members of households with ≥1 AMA-1 or MSP-119 positive individual would have included 62.8% of the population, targeted 76.8% (95% CI, 67.6–83.9) of infections and prevented >80% of mosquito infections. A similar impact on transmission would require treating all individuals within 1150 m of an RDT-positive individual (66.8% of the population).
DISCUSSION
FSAT/MSAT or presumptive FDA/MDA strategies have been proposed in the context of malaria elimination. We hypothesized that a combination of the 2 concepts may represent a useful approach. This study therefore aimed to investigate clustering of PCR-detected infections in and around households that would be identified by either RDT or serological screening to then analyze and estimate the potential impact of FDA versus MDA on reducing the asymptomatic PCR-positive P. falciparum reservoir and reducing onward transmission.
Although the 123 PCR-positive individuals were scattered over the whole study area, results suggest that such infections show some propensity to cluster around RDT-positive infections. Additional clustering at specific locations distant from the households, such as rice farms, may have been missed in this household-based survey. In addition, because only about 67% of recorded persons were screened and infections with low parasite density fluctuate from day to day highly [32–35], a number of infections were probably undetected in our survey. This may have reduced the statistical power to detect additional spatial patterns.
The RDT screening, as expected, detected only a small proportion (about 10%) of PCR-positive infections. The simulated impact estimates, however, suggest that treating only the 13 RDT-positive individuals would prevent 28%–45% of onward mosquito infections and further transmission, but no impact was found on the prospectively recorded clinical malaria cases over a 2-month period after the RDT-based MSAT in the study area [13]. Several reasons may account for this. First, the estimated transmission effect assumes that everyone is screened, whereas the RDT screening coverage was only 67% of persons. Second, the higher transmission risk from higher (RDT-positive) parasite densities (and gametocytemias) may be relatively short-lived until densities are reduced by the immune system. Third, the possible impact may be diluted by imported infections from neighboring shehias or Tanzania mainland. Furthermore, studies on the relations of parasite/gametocyte densities and malaria transmission have shown conflicting results [36].
Spatial clustering of PCR-positive infections around RDT-positive infections was most apparent within the same household as the RDT-positive infection, with the odds of being PCR positive 7-fold higher than for those living >1000 m from an RDT-positive individual. Similar results have been found elsewhere [11, 12]. There was also weak evidence that living within 300 m of an RDT-positive individual was a risk factor. These findings support a policy of presumptive treatment of all members in households with an RDT-positive individual and potentially within, for example, a 300-m radius of such an individual (14% of the population). Such a strategy would have eliminated about 30% of PCR-positive infections. Treating individuals residing with 300–1000 m of an RDT-positive household did not show any added value compared with community-wide MDA. A challenge associated with either FDA or MDA is achieving the high coverage necessary for successful transmission-reducing strategies.
In Zanzibar, malaria surveillance is largely based on weekly reporting of RDT-confirmed malaria infections in febrile patients from all public health facilities. Although the RDT-positive infections in our study were asymptomatic, we believe that our clustering analyses and conclusions regarding the impact of reactive presumptive treatments may possibly be extrapolated to the situation of Zanzibar surveillance with reactive response to RDT-positive clinical infections. In an area with implemented good community case management, the early treatment of symptomatic infections and household members would obviously be especially efficient in preventing transmission.
The serological testing was only partly discriminative in identifying PCR-positive individuals or their households. Hence only 57% of infections were found among all seropositive individuals. This may be explained by the fact that seropositivity can be more a reflection of past than of current infection, owing to the long half-lives of antibodies, that relatively few antigens and low serum dilutions were used in the assays, or that false-positive PCR results may be more common at low transmission. Treating all households with ≥1 seropositive member would have covered 77% of PCR-identified infections but would mean treating 63% of the population. A drawback for serological MSAT is also that, at least presently, the screening cannot be performed at the point of care. Because serological data are more stable measures of malaria transmission, they may be used to identify larger residual hot-spot areas [37] rather than to identify individuals or households at risk.
In conclusion, we showed that PCR-detectable P. falciparum infections cluster around RDT-positive individuals and most strongly within the infected household. The findings support presumptive treatment within households of RDT-positive individuals and potentially worth considering within a certain radius (eg, 300 m) for purposes of reducing malaria transmission. Wider large-scale MDA may be required to meet a more rapid elimination objective. Serological tests do not presently seem to be a feasible MSAT alternative in Zanzibar because they were neither discriminative enough to identify individuals or households with ongoing infections and transmission nor available as point-of-care tests.
Notes
Acknowledgments. We thank the residents in Unguja who participated in the study and our enumerators for screening study participants. We also thank Berit Aydin Schmidt for valuable comments on the manuscript and assistance in its submission.
Financial support. This work was supported by Swedish Research Council (grants2009–3785 and 2013–6594) and the Bill & Melinda Gates Foundation (grantOPP 1013170])
Potential conflicts of interest. All authors: No reported conflicts. All authors have submitted the ICMJE Form for Disclosure of Potential Conflicts of Interest. Conflicts that the editors consider relevant to the content of the manuscript have been disclosed.
References
Author notes
Correspondence: A. Björkman, Department of Microbiology, Tumor and Cell Biology, Karolinska Institutet, SE 17176 Stockholm, Sweden ([email protected]).

