


Abstract
Airway-colonization by Staphylococcus aureus predisposes to the development of ventilator-associated tracheobronchitis (VAT) and ventilator-associated pneumonia (VAP). Despite extensive antibiotic treatment of intensive care unit patients, limited data are available on the efficacy of antibiotics on bacterial airway colonization and/or prevention of infections. Therefore, microbiologic responses to antibiotic treatment were evaluated in ventilated patients.
Results of semiquantitative analyses of S. aureus burden in serial endotracheal-aspirate (ETA) samples and VAT/VAP diagnosis were correlated to antibiotic treatment. Minimum inhibitory concentrations of relevant antibiotics using serially collected isolates were evaluated.
Forty-eight mechanically ventilated patients who were S. aureus positive by ETA samples and treated with relevant antibiotics for at least 2 consecutive days were included in the study. Vancomycin failed to reduce methicillin-resistant S. aureus (MRSA) or methicillin-susceptible S. aureus (MSSA) burden in the airways. Oxacillin was ineffective for MSSA colonization in approximately 30% of the patients, and responders were typically coadministered additional antibiotics. Despite antibiotic exposure, 15 of the 39 patients (approximately 38%) colonized only by S. aureus and treated with appropriate antibiotic for at least 2 days still progressed to VAP. Importantly, no change in antibiotic susceptibility of S. aureus isolates was observed during treatment. Staphylococcus aureus colonization levels inversely correlated with the presence of normal respiratory flora.
Antibiotic treatment is ineffective in reducing S. aureus colonization in the lower airways and preventing VAT or VAP. Staphylococcus aureus is in competition for colonization with the normal respiratory flora. To improve patient outcomes, alternatives to antibiotics are urgently needed.
(.)
Ventilator-associated pneumonia (VAP) is a life-threatening disease. Consequently, several preventive strategies, often implemented as a bundle, have been tested to decrease VAP incidence [1]. One of the most common causative pathogens of VAP is Staphylococcus aureus.
The endotracheal tube significantly reduces tracheobronchial mucus flow, resulting in retained secretions. Heavy bacterial airway colonization that can be assessed by quantitative or semiquantitative microbiological analysis of respiratory samples (such as endotracheal aspirate, bronchoalveolar lavage, or protected specimen brush) is a significant predisposing factor for the development of VAP [2, 3]. Therefore, reducing the S. aureus burden on mucosal surfaces would be expected to reduce the rate of progression to VAP [4–6]. Ventilator-associated tracheobronchitis (VAT) is considered to be an intermediate process between lower respiratory tract colonization and VAP, and several studies suggest that 20% to 30% of patients with VAT progress to VAP [7]. There are controversial data as to whether early appropriate therapy of VAT prevents progression to VAP [7, 8]. Moreover, the diagnosis of VAT is not trivial due to difficulties in differentiating VAT from colonization or VAP (low sensitivity of chest portable radiographs, patients with radiographic abnormalities). Treatment guidelines do not recommend antibiotics for airway colonization in mechanically ventilated patients. Despite this, many patients on mechanical ventilation receive antibiotics either as a defensive strategy to prevent potentially life-threatening infections or as a response to symptoms that indicate infection (e.g., fever and leukocytosis). Oxacillin is the most commonly used antibiotic against methicillin- susceptible S. aureus (MSSA), while most methicillin-resistant S. aureus (MRSA) infections are treated with vancomycin or linezolid. Due to the high prevalence of MRSA in the United States, MSSA-infected patients are often treated with vancomycin, typically as a result of initiation of empiric antibiotic therapy.
Since no information is available on the effectiveness of antibiotics in altering lower airway colonization, we analyzed the microbiological response to antibiotics active against S. aureus determined by semiquantitative (SQ) bacterial assessment in serially collected endotracheal aspirate (ETA) samples of ventilated patients.
METHODS
Study Population
ETA samples from 231 patients hospitalized between May 2010 and December 2010 in 3 intensive care units (ICUs) at the Lahey Hospital and Medical Center (Burlington, Massachusetts) were collected for a previously published study [4].
The SQ bacterial burden in the lower airways was determined in 1258 ETA samples obtained from the 231 patients. SQ counts revealed “heavy colonization” defined as moderate (3+) or many (4+) bacteria, which relates to ≥105 to 106 colony-forming units/mL by quantitative ETA analysis [3, 4]. SQ counts below these thresholds represent “light colonization.” The microbial characteristics of study patients’ isolates were described previously [9].
Forty-eight patients were included in this study based on S. aureus–positive ETA samples and treatment with S. aureus–relevant antibiotics (vancomycin, oxacillin, linezolid) for at least 2 consecutive days. Clinically customary doses of these antibiotics were administered intravenously. Unless the physician ordered the microbiological analysis for diagnostic purposes, pathogens identified in the daily ETA specimens were not reported to the treating physicians and therefore did not influence antibiotic choices. Serum levels of antibiotics were not determined.
Bacterial burden and antibiotic treatment were monitored for each patient daily during the study period and reviewed retrospectively. Microbial response to antibiotic treatment was defined as the reduction of S. aureus burden from heavy to light or no colonization upon treatment with S. aureus–active antibiotics.
A total of 292 ETA samples from 56 patients contained S. aureus. Seven of these patients were treated with S. aureus–active antibiotics for fewer than 2 consecutive days and 1 patient was reported with S. aureus community-acquired pneumonia at admission. Therefore, these 8 patients were excluded from subsequent analyses, resulting in 21 study patients positive for MRSA and 27 study patients positive for MSSA.
Diagnosis of VAT was based on heavy colonization and at least 2 of the following 3 additional clinical criteria: fever or hypothermia, leukocytosis or leukopenia, and purulent respiratory secretion. VAP was diagnosed as for VAT with additional new infiltrate on chest radiographs.
Normal respiratory flora (NRF) in ETA samples were reported and classified by recovery of microorganisms such as α-hemolytic Streptococcus spp., apathogenic Neisseria spp., Corynebacterium spp., Bacteroides spp., Fusobacterium spp., Spirochaetes, and Candida spp.
The Lahey Clinic Institutional Review Board approved the research protocols.
Microbial Genetics and Antimicrobial Susceptibility Testing
Strains were cultured and maintained using standard microbiological procedures. Hemolysis profiling and genotyping (multilocus sequence typing (MLST), spa-typing) of this collection were published previously [9]. The antimicrobial susceptibility of S. aureus isolates was determined as minimum inhibitory concentrations (MICs) for vancomycin, linezolid, oxacillin, cefepime, ceftriaxone, and ciprofloxacin, tested by agar diffusion (Etest, bioMérieux, Austria) in accordance with the actual European Committee on Antimicrobial Susceptibility Testing (EUCAST) guidelines for clinical breakpoints of microbial resistance.
Statistical Data Analyses
Data were analyzed by group comparison based on 2-tailed, unpaired t test with Welch’s correction and Fisher exact 2-tailed probability tests using Prism 6 software (GraphPad, La Jolla, California). Methods used for each dataset are described in the text and the figure legends.
RESULTS
Low Efficacy of Antibiotics Against MRSA and MSSA Airway Colonization and in Preventing VAT or VAP
Staphylococcus aureus–positive ETA samples were recovered from 56 of the 231 patients enrolled; all patients were treated with antibiotics. Forty-eight of these 56 patients received anti-S. aureus relevant antibiotics for at least 2 consecutive days before ETA sampling was included in this study (Supplementary Figure 1). MSSA and MRSA isolates were recovered from 27 and 21 patients, respectively. Nine of the 48 patients were co-colonized by other bacterial species; some of them are potential pathogens (eg, Klebsiella spp., Escherichia coli, Pseudomonas aeruginosa, Proteus mirabilis, Acinetobacter baumannii, and Serratia marcescens). Patient demographics and baseline characteristics are provided in Table 1. As reported previously for patients from this study [9], significantly more VAP patients were infected with MSSA than with MRSA strains. Furthermore, S. aureus VAP patients spent significantly more time on a ventilator in the ICU and the hospital than those diagnosed with S. aureus VAT or colonization. The Charlson comorbidity index was not higher in VAP patients. Because no significant differences in other baseline characteristics were found between the MSSA and MRSA colonized patients, the study-patient population was not further stratified.
Demographics of Study Patients
| Non-VAP | P Value | P Value | ||||
|---|---|---|---|---|---|---|
| VAP | VAT/Colonized | MRSA | MSSA | |||
| (n = 16a) | (n = 14a/n = 18) | (n = 21) | (n = 27) | |||
| Demographic Factor | ||||||
| Age, y | 59.63 ± 12.86b | 65.91 ± 2.495b | .1323c | 66.33 ± 12.63b | 61.85 ± 14.74b | .2631c |
| Male, n (%) | 8 (50.0) | 21 (65.6) | .3568d | 14 (66.7) | 15 (55.6) | .5553d |
| Race | ||||||
| Asian, n (%) | 0 (0.0) | 0 (0.0) | NA | 0 (0.0) | 0 (0.0) | NA |
| Black, n (%) | 1 (6.3) | 0 (0.0) | .3333d | 0 (0.0) | 1 (3.7) | 1.0000d |
| White, n (%) | 15 (93.7) | 31 (96.9) | 1.0000d | 21 (100.0) | 25 (92.6) | .4973d |
| Hispanic, n (%) | 0 (0.0) | 1 (3.1) | 1.0000d | 0 (0.0) | 1 (3.7) | 1.0000d |
| Body mass index | 27.39 ± 7.25b | 33.11 ± 2.191b | .0502c | 33.26 ± 14.56b | 29.61 ± 17.61b | .3044c |
| Surgical intensive care unit, n (%) | 9 (56.3) | 7 (21.9) | .0250d | 4 (19.0) | 12 (44.5) | .0752d |
| Medical intensive care unit, n (%) | 7 (43.7) | 25 (78.1) | 17 (81.0) | 15 (55.5) | ||
| Confounding Factor | ||||||
| Chronic obstructive pulmonary disease, n (%) | 0 (0.0) | 2 (6.3) | 1.0000d | 2 (9.5) | 0 (0.0) | .1862d |
| Previous pneumonia, n (%) | 0 (0.0) | 6 (18.8) | .1595d | 4 (19.0) | 2 (7.4) | .3827d |
| Immunosuppression, n (%) | 0 (0.0) | 2 (6.3) | .5461d | 2 (9.5) | 0 (0.0) | .1862d |
| Steroid use, n (%) | 0 (0.0) | 0 (0.0) | NA | 0 (0.0) | 0 (0.0) | NA |
| Neutropenia, n (%) | 0 (0.0) | 1 (3.1) | 1.0000d | 0 (0.0) | 1 (3.7) | 1.0000d |
| White blood cell count (×103) | 12.12 ± 5.43b | 13.79 ± 1.58b | .4280c | 15.42 ± 8.25b | 11.53 ± 7.40b | .0986c |
| Past or current smoker, n (%) | 6 (37.5) | 11 (34.4) | 1.0000d | 9 (42.9) | 10 (37.0) | .7701d |
| Clinical Status | ||||||
| Charlson comorbidity index | 1.06 ± 1.12b | 2.03 ± 0.34b | .0343c | 2.10 ± 1.95b | 1.41 ± 1.58b | .1954c |
| Acute Physiology and Chronic Health Evaluation II | 17.32 ± 4.63b | 18.23 ± 1.094b | .5724c | 17.32 ± 3.71b | 18.39 ± 6.88b | .4958c |
| GCS, (n) | 13.25 ± 0.50b (4) | 12.75 ± 0.86b (12) | .5875c | 13.50 ± 2.72b (8) | 12.25 ± 2.43b (8) | .3500c |
| GCS of patients intubated prior to scoring, n | 7.00 ± 2.17b (12) | 10.10 ± 2.96b (20) | .3173c | 12.23 ± 16.21b (13) | 6.68 ± 1.83b (19) | .2425c |
| Acute renal failure, n (%) | 2 (12.5) | 7 (21.9) | .6974d | 5 (23.8) | 4 (14.8) | .4772d |
| Chronic organ insufficiency, n (%) | 2 (12.5) | 6 (18.8) | .7012d | 3 (14.3) | 5 (18.5) | 1.0000d |
| Outcome | ||||||
| Mortality in hospital, n (%) | 3 (18.8) | 9 (28.1) | .7252d | 6 (28.6) | 6 (22.2) | .7406d |
| Duration of hospitalization, days | 28.81 ± 12.06b | 18.78 ± 1.606b | .0072c | 18.10 ± 8.84b | 25.26 ± 11.84b | .0205c |
| Duration of hospitalization prior to ICU stay, days | 1.31 ± 1.85b | 2.16 ± 0.75b | .3429c | 1.86 ± 4.03b | 1.89 ± 3.34b | .9769c |
| Duration of hospitalization prior to ventilation, days | 4.75 ± 3.84b | 5.34 ± 0.89b | .6530c | 4.76 ± 4.57b | 5.44 ± 4.77b | .6170c |
| Duration of ICU stay, days | 25.75 ± 9.65b | 13.88 ± 1.43b | .0003c | 13.43 ± 7.23b | 21.26 ± 11.01b | .0049c |
| Duration of ICU stay prior to ventilation, days | 3.44 ± 3.78b | 3.19 ± 0.34b | .8060c | 2.90 ± 1.64b | 3.56 ± 3.23b | .3693c |
| Duration of ventilation, days | 11.94 ± 5.30b | 6.66 ± 0.64b | .0016c | 6.95 ± 4.36b | 9.56 ± 5.06b | .0622c |
| Clinical Microbiology | ||||||
| Antibiotics prior to ICU stay, n (%) | 7 (43.8) | 22 (68.8) | .1237d | 16 (76.2) | 14 (51.9) | .1331d |
| Antibiotics during ICU stay, n (%) | 16 (100.0) | 32 (100) | NA | 21 (100.0) | 27 (100.0) | NA |
| First day of heavy colonization | 3.44 ± 2.89b | 3.09 ± 0.50b | .6987c | 3.10 ± 2.17b | 3.30 ± 3.28b | .7999c |
| MRSA, n (%) | 3 (18.8) | 18 (56.3) | .0164d | 21 (100.0) | 0 (0.0) | NA |
| MSSA, n (%) | 13 (81.2) | 14 (43.7) | 0 (0.0) | 27 (100.0) | ||
Bold values indicate statistically significant differences. Abbreviations: GCS, Glasgow coma scale; ICU, intensive care unit; MRSA, methicillin-resistant Staphylococcus aureus; MSSA, methicillin-susceptible Staphylococcus aureus; NA, not applicable; VAP, ventilator-associated pneumonia; VAT, ventilator-associated tracheobronchitis.
1/16 VAP and 1/14 VAT patients were coinfected with another respiratory pathogen prior to or at the time of diagnosis.
Mean ± standard deviation are shown for the following: age; body mass index; white blood cell counts; Charlson comorbidity index; Acute Physiology and Chronic Health Evaluation II; GCS; GCS intubated; duration of: hospitalization, hospitalization prior to ICU stay, hospitalization prior to ventilation, ICU stay, ICU stay prior to ventilation, ventilation; and first day of heavy colonization categories.
Two-tailed, unpaired t test with Welch’s correction (MRSA vs MSSA).
Fisher exact 2-tailed test.
Heavy colonization developed early during mechanical ventilation; in 60% of patients, it was detected by day 4 and in 92% of patients during the first 8 days post-intubation. No significant difference was observed in the temporal patterns of MSSA and MRSA colonization (Figure 1).
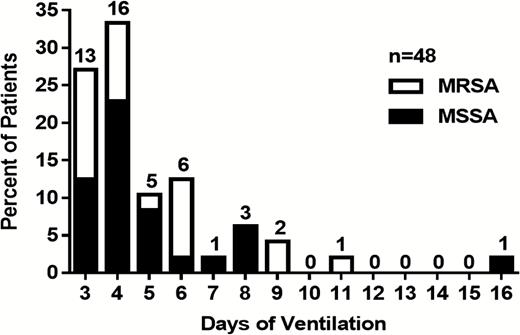
Time course of detecting heavy endotracheal colonization by Staphylococcus aureus in ventilated patients. The actual day of detecting the first heavy S. aureus endotracheal aspirate colonization is shown for the 48 study patients on mechanical ventilation between days 3 and 16 following intubation. Percentage ratios of methicillin-resistant Staphylococcus aureus and methicillin-susceptible Staphylococcus aureus is depicted with the total number of patients per cohort indicated on top of each bar. Abbreviations: MRSA, methicillin-resistant Staphylococcus aureus; MSSA, methicillin-susceptible Staphylococcus aureus.
Eighteen of the 21 patients with MRSA colonization were treated with vancomycin for at least 2 consecutive days (Table 2). However, only 1 of them showed reduced bacterial burden in the serial ETA samples. The 3 MRSA patients who received linezolid did not have a microbiological response (Table 2). Vancomycin was also used in 15 patients colonized by MSSA; 9 of these were nonresponders to vancomycin treatment. In the remaining 6 patients who exhibited a decreasing tendency in bacterial counts (from heavy to light), vancomycin was used in combination with other S. aureus–active antibiotics such as penicillins (oxacillin or nafcillin), cephalosporins (cefepime, cefazoline, or ceftriaxone), or fluoroquinolones (ciprofloxacin or levofloxacin; Table 2). The 7 S. aureus–colonized patients, excluded from the analysis due to treatment with antibiotics for fewer than 2 consecutive days, were also treated with vancomycin, and 2 of the 3 MSSA-colonized patients were treated with oxacillin in addition to vancomycin.
Effect of Selected Anti-Staphylococcus aureus Antibiotics on the Microbial Response in Endotracheal Aspirate Samples and Disease Progression
| Treatment and Response Group | Number of Patients Exposed for Given Days to Respective Antibiotic Prior to Detection of First Heavy Colonization (colonized/VAT/VAP) | Total Number per Response Group | Total, % | Total per Response Group, % | Minimum Inhibitory Concentration of Isolates to Respective Antibiotic, µg/mL | ||||||||
|---|---|---|---|---|---|---|---|---|---|---|---|---|---|
| 2 days | 3 days | 4 days | 5 days | 6 days | 7 days | 8 days | 9 days | ≥10 days | |||||
| Vancomycin—MRSA (n = 18) | |||||||||||||
| Nonresponding to antibiotics | 0/1/0 | 1/0/0 | 0/1/0 | 3/0/0 | 2/0/0 | 1/1/1 | 0/1/1 | 1/1/0 | 1/0/1 | 9/5/3 | 50.0/27.8/16.7 | 94.4 | 1.00 (0.75; 1.00) |
| Responding to single antibiotic | 0/0/1 | 0/0/1 | 0.0/0.0/5.6 | 5.6 | 1.00 (1.00) | ||||||||
| Responding to antibiotic combination | |||||||||||||
| Linezolid—MRSA (n = 3) | |||||||||||||
| Nonresponding to antibiotics | 0/0/1 | 0/0/1 | 1/0/0 | 1/0/2 | 33.3/0.0/66.7 | 100.0 | 0.75 (0.50; 0.75) | ||||||
| Responding to single antibiotic | |||||||||||||
| Responding to antibiotic combination | |||||||||||||
| Vancomycin—MSSA (n = 15) | |||||||||||||
| Nonresponding to antibiotics | 0/0/1 | 0/0/1 | 0/1/1 | 0/0/1 | 0/2/0 | 0/0/2 | 0/3/6 | 0.0/20.0/40.0 | 60.0 | 1.00 (0.75; 1.00) | |||
| Responding to single antibiotic | |||||||||||||
| Responding to antibiotic combination | 0/1/0 | 1/1/0 | 0/0/1 | 0/1/1 | 1/3/2 | 6.7/20.0/13.3 | 40.0 | 1.00 (0.75; 1.00) | |||||
| Oxacillin—MSSA (n = 9) | |||||||||||||
| Nonresponding to antibiotics | 0/0/1 | 0/0/1 | 0/0/2 | 0.0/0.0/22.2 | 22.2 | 0.38 (0.13; 0.75) | |||||||
| Responding to single antibiotic | 0/0/1 | 0/0/1 | 0.0/0.0/11.1 | 11.1 | 0.50 (0.50) | ||||||||
| Responding to antibiotic combination | 0/1/2 | 0/1/0 | 0/0/1 | 0/0/1 | 0/2/4 | 0.0/22.2/44.4 | 66.7 | 0.75 (0.25; 1.00) | |||||
Total patient numbers (n) per treatment group are indicated per cohort stratified for the interval of antibiotic treatment and disease phenotype (colonized/VAT/VAP). Response group: level of reduction in Staphylococcus aureus numbers based on semiquantitative endotracheal aspirate analysis (from heavy to light colonization or no S. aureus recovered) by respective antibiotic per treatment group. VAT and/or VAP were diagnosed as previously described [4]. Minimum inhibitory concentration of S. aureus isolates to respective antibiotic per response group showing the median (lower; upper).
Abbreviations: MRSA, methicillin-resistant Staphylococcus aureus; MSSA, methicillin-susceptible Staphylococcus aureus; VAP, ventilator-associated pneumonia; VAT, ventilator-associated tracheobronchitis.
Oxacillin was used in 9 patients with MSSA in their ETA (7 diagnosed with VAP); 2 of them showed no response. In 7 patients the S. aureus burden was reduced during antibiotic treatment; 6 of these patients received combinations of up to 3 additional antibiotics such as vancomycin, ciprofloxacin, cefepime, ceftriaxone, levofloxacin, imipenem, and metronidazole (Table 2).
Despite appropriate antibiotic treatment for at least 2 consecutive days, 13 VAT cases and 15 VAP cases were diagnosed among the 39 patients colonized only by S. aureus. Five of the 13 patients (38.5%) diagnosed with S. aureus VAT progressed to VAP. In 8 of 15 (53.3%) S. aureus VAP patients, diagnosis was made within the first 5 days of mechanical ventilation (Figure 2).
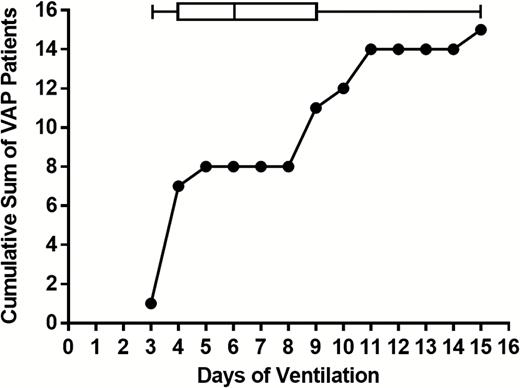
Staphylococcus aureus ventilator-associated pneumonia (VAP) diagnosis in relation to the duration of mechanical ventilation. The cumulative sum of patients diagnosed with S. aureus VAP is plotted against time on the ventilator. Box and whiskers indicate the 5–95 percentiles for the days of VAP diagnosis. Abbreviation: VAP, ventilator-associated pneumonia.
Long-term ventilated patients provided multiple samples (more than 8) and were analyzed in more detail (representative patients listed in Supplementary Figure 2). Without exception, these patients were exposed to several different antibiotics simultaneously. In most cases the heavy colonization by MSSA or MRSA could not be eliminated or was only temporarily eliminated, and VAT and/or VAP still developed in spite of long-term exposure to antibiotics (Supplementary Figure 2A–F).
To investigate whether the low efficacy of antibiotics originated from a decreasing susceptibility of S. aureus upon exposure during colonization, the antibiotic susceptibility profile of the first and last isolates from these patients (collected up to 14 days apart) was determined. Agar diffusion tests performed according to the EUCAST guidelines revealed that none of the isolate pairs displayed an MIC creep or change in antibiotic susceptibility over time. We also compared the vancomycin MIC values of isolates from responders with those of nonresponders and did not detect any significant differences or trend toward higher MICs in nonresponders (Table 2).
Airway Colonization by MRSA and MSSA Reduces the Normal Respiratory Flora
We observed that microorganisms constituting the NRF, such as α-hemolytic Streptococcus spp., apathogenic Neisseria spp., Corynebacterium spp., Bacteroides spp., Fusobacterium spp., Spirochaetes, and Candida spp., were often absent in ETA samples that contained heavy S. aureus burden. Analysis of NRF and S. aureus in all ETA samples of the 231 study patients revealed an inverse correlation. Heavy colonization (SQ of 3+ or 4+) either by MRSA (P = .0014) or MSSA (P < .0001) was associated with an approximately 50% reduction in NRF positivity of ETA samples (Figure 3).
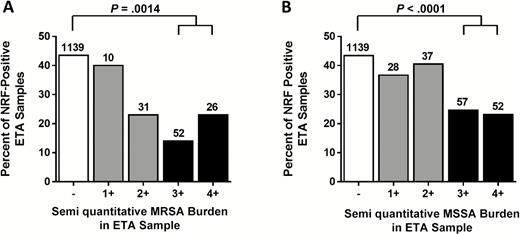
The presence of normal respiratory flora (NRF) in endotracheal aspirate (ETA) samples with different levels of Staphylococcus aureus burden. Percentages of all S. aureus– and NRF-positive ETA samples, grouped according to the semiquantitative bacterial burden of MRSA (A) and MSSA (B) are indicated. Total numbers of positive samples per category are shown on top of each bar with P values calculated using the Fischer exact 2-tailed probability test for indicated group comparison. Abbreviations: ETA, endotracheal aspirate; MRSA, methicillin-resistant Staphylococcus aureus; MSSA, methicillin-susceptible Staphylococcus aureus; NRF, normal respiratory flora.
Since the observed inverse correlation between S. aureus burden and NRF positivity may be related to treatment with S. aureus–active antibiotics, we analyzed the effect of relevant antibiotics on the recovery of NRF from ETAs. Importantly, antibiotic treatment per se did not have a significant negative effect on NRF (data not shown).
DISCUSSION
In this study we show that development of heavy colonization of the airways by S. aureus is an early event during mechanical ventilation. This was assessed by SQ microbiological analysis of endotracheal aspirates, which is a noninvasive respiratory culture sampling method that is recommended for detecting significant airway colonization to support VAP diagnosis by the 2016 Infectious Diseases Society of America and the American Thoracic Society guidelines [2]. An important finding of this study is the low efficacy of antibiotic treatment to reduce S. aureus colonization of the lower airways in ventilated patients and to prevent progression from colonization to VAT and VAP. This was particularly true for vancomycin, which was similarly ineffective at reducing or clearing MRSA or MSSA colonization. Treatment with oxacillin, which is the appropriate antibiotic for MSSA infections, was more effective at reducing heavy MSSA colonization; however, in most cases it was administered in combination with other antibiotics and therefore its sole efficacy could not be assessed. Nevertheless, one third of the patients still did not respond with a reduced MSSA burden to oxacillin, and in several patients, VAT and VAP developed despite oxacillin treatment.
Our observation is in line with previous findings that demonstrated the superiority of oxacillin over vancomycin against MSSA both in vitro and clinically [10–12]. Vancomycin displays lower tissue penetration and serum and alveolar lining fluid concentration levels, as well as diminished bactericidal activity against MRSA with higher MICs (>1 mg/mL) than other S. aureus–active antibiotics such as linezolid [13–16]. In this study, samples were collected in 2010, and only 3 study patients were treated with linezolid; therefore, the effectiveness of vancomycin compared to linezolid could not be determined. However, the 3 patients treated with linezolid (for 5 to 11 days) did not respond with a reduced MRSA burden to linezolid.
Decreased susceptibility of S. aureus isolates to antibiotics was not observed based on MIC values even after 10 days of treatment; therefore, it does not explain the lack of efficacy of antibiotics on S. aureus colonization. A more likely explanation is that antibiotics do not reach therapeutic concentrations in the alveolar lining fluid. Importantly, MIC values determined in vitro on agar plates or rich culture media are crude surrogates of antibiotic susceptibility and have limitations for extrapolation to in vivo. Moreover, in mechanically ventilated patients, several factors can affect bacterial clearance, most importantly the presence of the endotracheal tube, its colonization by microorganisms, and inflammation, all of which promote biofilm formation [17, 18]. Biofilm formation that is a well-recognized virulence mechanism seems to be central to the development of persistent colonization and infection in the airways. Soon after intubation, the endotracheal tube becomes colonized by microorganisms present in the oropharynx that form a biofilm on its surface [19–21]. Bacterial biofilms are surface-attached communities of cells encased within a self-produced extracellular polysaccharide matrix that shelters bacteria from host defense mechanisms. The most likely mechanisms of the observed resistance to antibiotic treatment are the reduced drug penetration into biofilms and decreased bacterial multiplication, which is especially relevant for the efficacy of antibiotics that target the cell wall. Gram-negative bacterial species such as P. mirabilis, E. coli, P. aeruginosa, Klebsiella spp., and A. baumannii were also isolated from the 231 ventilated patients in this study. In the vast majority of these patients (25 of 27), heavy colonization with gram-negative bacteria was also not reduced by appropriate antibiotic treatment (data not shown), confirming that low efficacy of antibiotics on mucosal surfaces is a general phenomenon and not limited to S. aureus.
In line with this conclusion, we also did not observe any obvious effect of antibiotic treatment on the overall recovery of NRF from ETA samples. However, the presence of NRF species was inversely correlated with the levels of MSSA and MRSA burden. As the exact composition of the NRF was not recorded, the detailed effects on individual NRF species, that is, a change of the ratio of recovered gram-positive and gram-negative species, could not be evaluated. These data suggest a competition between commensals and S. aureus during colonization of the lower airways. Whether the lack or reduced presence of NRF in the lower airways predisposes for S. aureus colonization or S. aureus overgrows and outcompetes commensals cannot be concluded based on this study but certainly warrants further investigation. This is especially true in light of recent publications that indicate that microbe–microbe interactions between S. aureus and human commensal bacteria affect S. aureus behavior. Altered gene expression, notably diminished S. aureus exotoxin expression, has been observed in the presence of commensal Corynebacterium spp. [22]. Staphylococcus lugdunensis, another commensal bacterium, was reported to interfere with S. aureus colonization through the production of the antibiotic-like compound lugdunin [23]. Data suggest that S. aureus also interacts with opportunistic pathogens such as P. aeruginosa and Klebsiella spp. [24–26]. One possible mechanisms is via the action of the best-characterized S. aureus virulence factor, alpha-hemolysin, which is shown to enhance biofilm formation [27]. It was elegantly demonstrated in experimental animal models that an alpha-hemolysin neutralizing monoclonal antibody reduced the rate of lung infections caused by opportunistic gram-negative pathogens [28].
We are aware of the limitations of our study: the observational nature, the low patient number, and single study center. The potential variability in culturing and quantification techniques among clinical microbiology laboratories and the temporal and geographical changes in S. aureus genotypes certainly call for broader studies. The strength of our study is the well- characterized patient cohort and the daily microbiological analyses of ETA samples.
We found that 38% of the ventilated patients colonized by S. aureus (without co-colonization by other pathogens) developed pneumonia, despite treatment with appropriate antibiotics for at least 2 consecutive days. This raises the question: what alternative or adjunct approaches to antibiotics could be considered to address the high risk of progression to pneumonia in ventilated patients heavily colonized with S. aureus? It has been demonstrated by multiple in vitro and in vivo studies that exposure to certain antibiotics can upregulate the cytotoxin production of S. aureus [29–33]. This is expected to be particularly relevant when antibiotics do not control bacterial growth efficiently, which is the scenario suggested by our study. Secreted cytotoxins of S. aureus include alpha-hemolysin that damages lung epithelial cells and promotes biofilm formation and systemic spread [34], as well as leukocidins that lyse phagocytic cells and thus interfere with the elimination of S. aureus by the immune system [35]. High alpha-hemolysin–expressing S. aureus isolates were associated with progression to pneumonia in our previous study with patients also included in this study [9]. Leukocidins have been shown to contribute to pneumonia pathogenesis in rabbit models [36, 37]. Panton-Valentine leukocidin expression by community-associated MRSA (CA-MRSA) strains is considered to be associated with their propensity to cause necrotizing pneumonia [38].
Several studies reported synergistic effects of cytotoxin neutralizing antibodies in combination with MRSA and MSSA relevant antibiotics [39, 40]. Since cytotoxin neutralizing antibodies do not elicit a direct bactericidal effect, the mode of action of protection in pneumonia is the prevention of lung and epithelial barrier damage, as well as rescuing the leukocytes at the site of infection and thus enhancing the clearance of S. aureus. Several clinical studies are ongoing with S. aureus toxin neutralizing antibodies that have the potential to address the question whether this alternative approach offers benefits for ventilated patients by preventing S. aureus VAP and improving disease outcome and mortality rates.
Notes
Author contributions. E. N. and L. S. had full access to all data in the manuscript and take full responsibility for the integrity of the data and the accuracy of the data analysis. Study concept and design: E. N., L. S., and J. H. Acquisition, analysis, or interpretation of data: L. S., E. N., J. H., G. N., and D. C. Drafting of the manuscript: E. N., L. S., J. H., G. N., and D. C. Critical revision of the manuscript for important intellectual content: E. N., L. S., J. H., G. N., and D. C. Study supervision: E. N., L. S., and J. H. Clinical study supervision: D. C. and J. H.
Acknowledgments We thank Christine Power, Zoltán Magyarics, René Russo, David Mantus, Chris Stevens, and Ekaterina Kabak for their critical review of the manuscript and Manuel Zerbs, Jacqueline Steinhäuser, Mohamed Ben Omran, Yuxiu Lei, and Ahsan Waqas for technical support and clinical data collection.
Financial support. This work was supported by the General Program grant of the Austrian Research Promotion Agency (grant numbers FFG 841918, FFG 845382), awarded to Arsanis Biosciences.
Potential conflicts of interest. L.S., G.N., and E.N. are employees and shareholders in Arsanis, Inc (Delaware). All other authors: No reported conflicts. All authors have submitted the ICMJE Form for Disclosure of Potential Conflicts of Interest. Conflicts that the editors consider relevant to the content of the manuscript have been disclosed.
References
Author notes
L. S. and J. H. contributed equally to this manuscript.
Correspondence: E. Nagy, Arsanis, Inc, Arsanis Biosciences Helmut-Qualtinger-Gasse 2, 1030 Vienna, Austria ([email protected]).

