


Abstract
Invasive community-associated methicillin-resistant Staphylococcus aureus (MRSA) incidence in the United States is higher among black persons than white persons. We explored the extent to which socioeconomic factors might explain this racial disparity.
A retrospective cohort was based on the Centers for Disease Control and Prevention’s Emerging Infections Program surveillance data for invasive community-associated MRSA cases (isolated from a normally sterile site of an outpatient or on hospital admission day ≤3 in a patient without specified major healthcare exposures) from 2009 to 2011 in 33 counties of 9 states. We used generalized estimating equations to determine census tract–level factors associated with differences in MRSA incidence and inverse odds ratio–weighted mediation analysis to determine the proportion of racial disparity mediated by socioeconomic factors.
Annual invasive community-associated MRSA incidence was 4.59 per 100000 among whites and 7.60 per 100000 among blacks (rate ratio [RR], 1.66; 95% confidence interval [CI], 1.52–1.80). In the mediation analysis, after accounting for census tract–level measures of federally designated medically underserved areas, education, income, housing value, and rural status, 91% of the original racial disparity was explained; no significant association of black race with community-associated MRSA remained (RR, 1.05; 95% CI, .92–1.20).
The racial disparity in invasive community-associated MRSA rates was largely explained by socioeconomic factors. The specific factors that underlie the association between census tract–level socioeconomic measures and MRSA incidence, which may include modifiable social (eg, poverty, crowding) and biological factors (not explored in this analysis), should be elucidated to define strategies for reducing racial disparities in community-associated MRSA rates.
Methicillin-resistant Staphylococcus aureus (MRSA) has been recognized for decades as a significant pathogen in healthcare settings and an antibiotic-resistant pathogen of major importance in the United States [1–4]. Currently, guidelines and professional society recommendations provide strategies for preventing MRSA and other drug-resistant organisms in healthcare settings [5–7]; large declines in healthcare-associated MRSA have been documented over the past decade [8, 9].
However, in the United States MRSA also emerged in the community in the late 1990s [10, 11]. The incidence of invasive infection due to community-associated MRSA has not substantially changed for several years and, owing to declines in healthcare-associated MRSA, now exceeds that of invasive MRSA developing during the course of hospitalization [9, 12]. It is estimated that >15000 invasive community-associated infections and >1000 associated deaths occur annually in the United States [12].
Furthermore, population-based MRSA infection data in North America have consistently documented higher rates in black persons than in white persons [13–16]. Some proposed reasons for the racial disparity have included differences in host factors and differences in patients’ underlying medical conditions [10, 13, 14]. There are no general population-level guidelines or strategies for preventing invasive community-associated MRSA infections or for reducing racial disparities in MRSA infection rates. As potential strategies are developed or considered, the existence of racial disparities raises the question of whether prevention strategies could be developed that would reduce this disparity.
Factors related to lower socioeconomic status (SES), such as prior incarceration, intravenous drug use, and crowding, are known to increase the risk of community-associated MRSA infection [17–19], and lower SES in the community has been associated with increased rates of other acute infectious diseases [20]. Furthermore, black persons in the United States experience lower SES, which has been described to be due to a complex set of historical and current experiences and conditions [21–25]. Socioeconomic factors, therefore, are likely to account for at least some of the observed racial disparities in community-associated MRSA infection rates.
We examined whether area-based socioeconomic factors could explain racial differences in community-associated invasive MRSA infection incidence. In this project, the area-based measures proxy both individual- and community-level socioeconomic conditions and experiences. Our goal was both to assess which community factors were associated with differences in MRSA infection incidence, and to what extent these factors explained racial differences in MRSA rates. The intention was for results to inform future directions for prevention of invasive community-associated MRSA.
METHODS
MRSA Surveillance Data
The study design was a retrospective cohort using MRSA data obtained from the Centers for Disease Control and Prevention (CDC) Emerging Infections Program (EIP) Active Bacterial Core Surveillance for invasive MRSA in 2009–2011. EIP MRSA surveillance is an active, population-based, laboratory-based surveillance program that has been described previously [13]. An invasive community-associated MRSA case was defined as isolation of MRSA from a normally sterile body site (eg, blood, cerebrospinal fluid, internal body fluid) of a resident of the surveillance catchment area, where the index clinical specimen was obtained either from an outpatient or an inpatient during the first 3 days of hospitalization, without one of the following healthcare-related risk factors: surgery, dialysis, hospitalization, or residence in a long-term care facility within the prior year; or presence of a central venous catheter within 2 days prior to the culture. During 2009–2011, surveillance was conducted for invasive MRSA in residents of 33 counties in 9 US states, covering a population of 19 million persons. Trained EIP staff in each surveillance site investigated all reports of MRSA from eligible culture sources from laboratories servicing residents of their catchment area. Surveillance data, including demographic (eg, race) and clinical information, were collected through review of medical records. For this project, EIP site staff geocoded community-associated MRSA case addresses using ArcGIS (Esri) or Centrus Desktop (Group 1 Software, Inc) and recorded the 2010 census tract. MRSA cases occurring in homeless and incarcerated persons were excluded from geocoding and analysis.
Census Tract Data
Population denominators were obtained from the 2010 US census. Census tract characteristics came from multiple sources, including the 2010 US census, the 2008–2012 American Community Survey release, and the Health Resources and Services Administration (HRSA). Variables were based on those used in the Harvard Public Health Disparities Geocoding Project [26], encompassing factors related to income (households with low or high income, persons below the poverty level, and income inequality), housing (crowding, expensive homes, rural population), education (low or high education level among adults), and healthcare (health insurance coverage, and whether the census tract is part of a medically underserved area as defined by HRSA [27]). Definitions of each variable including data sources are listed in Table 1. We considered these area-based measures to proxy both individual- and community-level socioeconomic conditions and experiences.
Area-Based Socioeconomic Variables Considered for Inclusion in the Analysis
| Variable | Definition | Data Source |
|---|---|---|
| Low-income households | % households with income <$25000 (approximates <50% of median US household income) | ACS |
| High-income households | % households with income ≥$200000 (approximates ≥400% of median US household income) | ACS |
| Poverty | % persons below poverty level in past 12 months | ACS |
| Income inequality index | Gini coefficienta | ACS |
| Crowding | % of occupied households with >1 person/room | ACS |
| Expensive homes | % of owner-occupied housing units ≥$750000 (approximates ≥400% of median value) | ACS |
| Rural areas | % population living in rural area | 2010 Census |
| Low education | % people aged ≥25 y with <12th grade education (includes 12th grade, no diploma) | ACS |
| High education | % people aged ≥25 y with at least bachelor’s degree | ACS |
| Health insurance | % persons with health insurance coverage | ACS |
| Medically underserved area | Based on % of population with income below poverty level, percent of population with age >65 y, infant mortality, and availability of primary care providers | HRSA |
Abbreviations: ACS, 2008–2012 American Community Survey; HRSA, Health Resources and Services Administration.
aGini coefficient ranges from 0 to 1, with extreme values when income is uniformly distributed across all members of population (Gini coefficient = 0) or all income belongs to a single person (Gini coefficient = 1).
Data Analysis
Data analyses were performed using SAS software version 9.3 (SAS Institute). Patient race was classified as black only, white only, or other (which included persons reported to be of multiple races). As almost all patients with known race were either black only or white only, analyses related to race focused on these 2 race categories. In addition, Hispanic ethnicity was not examined because a large proportion of our cases (>40%) were reported to have unknown ethnicity. Multiple imputation with 10 imputation data sets was used to account for missing race (14.5% of cases) using the PROC MI procedure, based on the distribution of race and the demographics of the underlying census tract for cases with known race (see Supplementary Methods).
Descriptive analysis of geocoded cases was performed. Case counts were then aggregated by race for each census tract and coordinated with race specific denominators for each tract. Frequency weights were applied so that the counts and denominators appropriately reflected individuals in the analysis. Subsequent analyses used the race-aggregated individual data, nested within census tracts as the unit of level for the analysis. Using a Poisson generalized estimating equation (GEE) model with independent correlation structure at the census tract level, rate ratios (RRs) and corresponding 95% confidence intervals (CIs) for univariate associations between area-based measures of SES and invasive community-associated MRSA incidence were calculated. In addition, to evaluate potential interactions between race and SES with respect to MRSA incidence, annual invasive community-associated MRSA incidence per 100000 persons (using the census population to represent the size of the population at risk) was calculated and stratified by race and further stratified by quartiles of census tract-level SES. Cochran-Mantel-Haenszel RRs for black race stratified by quartiles of tract-level SES were calculated.
We hypothesized that race might affect MRSA infection rates through a pathway mediated by socioeconomic factors (indirect effect of race) as well as through a pathway unrelated to socioeconomic factors (direct effect of race). Mediation analysis was used to decompose the total (ie, observed and unadjusted) effect of race on invasive community-associated MRSA incidence into these direct and indirect effects. Area-based socioeconomic variables were selected as potential mediators based on noncollinearity (assessed through the variance inflation factor) and P ≤ .05 in a multivariable Poisson GEE model exploring the relationship between race, socioeconomic conditions, and MRSA infection incidence. Direct and indirect effects of race were estimated using the method of inverse odds ratio weighting [28, 29]. A further discussion of the method of inverse odds ratio weighting and specific details of our statistical analysis can be found in the Supplementary Methods. We applied this approach in a Poisson GEE model with clustering at the census tract level and frequency weights to account for the population size of each census tract. The estimated 95% CIs for total, direct, and indirect effects of race were calculated from 1000 bootstrapped runs. The proportion of racial disparity “mediated by” (ie, explained by) SES was calculated as the ratio of coefficients for indirect effect/total effect of black race on invasive community-associated MRSA incidence.
To assess whether results could be influenced by results from individual sites, sensitivity analyses were performed with each EIP site’s data omitted from the model.
Human Subjects
The EIP MRSA surveillance program (including geocoding of cases) and this analysis were considered to be nonresearch public health activities at the CDC. EIP sites obtained human subjects and ethics approvals from respective state health department and academic partner institutional review boards.
RESULTS
Geocoding Results and Description of Cases
During 2009–2011, 2722 community-associated MRSA cases were reported, of which 2609 were eligible for analysis (Figure 1). Of these, 2521 (96.6%) of cases’ residential addresses were successfully geocoded to a census tract in the surveillance area.
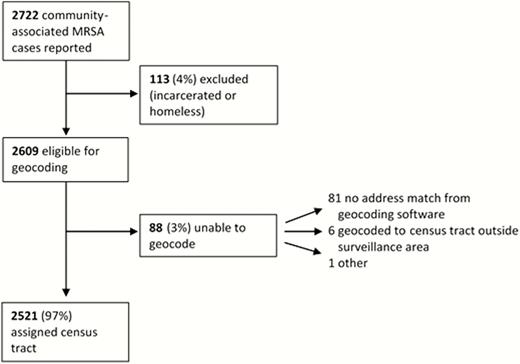
Results of geocoding of community-associated methicillin-resistant Staphylococcus aureus (MRSA) cases.
Among the 2156 cases with reported race, 1382 (64.1%) were reported to be in persons of white race only and 687 (31.9%) in persons of black race only (2069 [96.0%] therefore in either persons of white race only or black race only) (Table 2). Most cases (63.5%) occurred in male patients, and the median age was 52 years (interquartile range, 37–66 years). Diabetes, human immunodeficiency virus (HIV) infection, and intravenous drug use were reported in 27.3%, 8.8%, and 13.3% of cases, respectively. Most (75.3%) cases were associated with a positive blood culture for MRSA.
Description of Community-Associated Invasive Methicillin-Resistant Staphylococcus aureus Cases—Emerging Infections Program Data, 2009–2011 (n = 2521)
| Characteristic | No (%) |
|---|---|
| Race | |
| White | 1382 (54.8) |
| Black | 687 (27.3) |
| Other | 87 (3.5) |
| Unknown | 365 (14.5) |
| Male sex | 1601 (63.5) |
| Age, y, median (interquartile range) | 52 (37–66) |
| Selected underlying medical conditions | |
| Diabetes | 689 (27.3) |
| HIV | 223 (8.8) |
| IV drug use | 336 (13.3) |
| MRSA identified from blood culture | 1897 (75.3) |
Abbreviations: HIV, human immunodeficiency virus; IV, intravenous; MRSA, methicillin-resistant Staphylococcus aureus.
Unadjusted Analyses of Socioeconomic Status and MRSA Rates
Census tract-level factors associated with higher incidence in univariate analysis included low-income households (RR, 19.65; 95% CI, 14.78–26.12), persons living under the poverty level (RR, 16.78; 95% CI, 11.92–23.62), income inequality index (RR, 12.99; 95% CI, 6.54–25.82), crowding (RR, 437.72; 95% CI, 173.16–1106.48), low education (RR, 47.65; 95% CI, 33.96–66.86), and being a medically underserved area (RR, 2.40; 95% CI, 2.16–2.68) (Table 3). Conversely, factors associated with lower MRSA infection incidence were high-income households (RR, 0.008; 95% CI, .003–.02), expensive homes (RR, 0.46; 95% CI, .31–.68), rural areas (RR, 0.36; 95% CI, .25–.52), high education (RR, 0.11; 95% CI, .08–.14), and health insurance (RR, 0.08; 95% CI, .05–.11).
Univariate Rate Ratios for Association Between Neighborhood Socioeconomic Factors and Invasive Community-Associated Methicillin-Resistant Staphylococcus aureus Incidence
| Variable | Rate Ratioa | (95% Confidence Interval) | P Value |
|---|---|---|---|
| Low-income households | 19.65 | (14.78–26.12) | <.0001 |
| High-income households | 0.008 | (.003–.02) | <.0001 |
| Poverty | 16.78 | (11.92–23.62) | <.0001 |
| Income inequality index | 12.99 | (6.54–25.82) | <.0001 |
| Crowding | 437.72 | (173.16–1106.48) | <.0001 |
| Expensive homes | 0.46 | (.31–.68) | .0001 |
| Rural areas | 0.36 | (.25–.52) | <.0001 |
| Low education | 47.65 | (33.96–66.86) | <.0001 |
| High education | 0.11 | (.08–.14) | <.0001 |
| Health insurance | 0.08 | (.05–.11) | <.0001 |
| Medically underserved area | 2.40 | (2.16–2.68) | <.0001 |
aSocioeconomic status variables were coded as ranging from 0 (0% of the census tract with this characteristic) to 1 (100% of the census tract with this characteristic). As an example to assist in interpreting the rate ratios, the rate ratio of 19.65 for low income means that for each increase of 10% in households in a census tract with low income, we would predict an increase in the methicillin-resistant Staphylococcus aureus rate (cases/population) of 1.35-fold (the 10th root of 19.65).
Crude annual invasive community-associated MRSA incidence was 7.60 per 100000 black persons and 4.59 per 100000 white persons (RR, 1.66; 95% CI, 1.52–1.80). When incidence was stratified by different socioeconomic characteristics (related to income, housing, education, and health) of the census tracts, for almost all tract-level factors there was narrowing of the gap between incidence in black persons and white persons compared to the crude incidence by race (range of adjusted RRs, 1.16–1.37), although in these stratified analyses the adjusted RRs for race remained significant for all variables assessed (Figure 2).
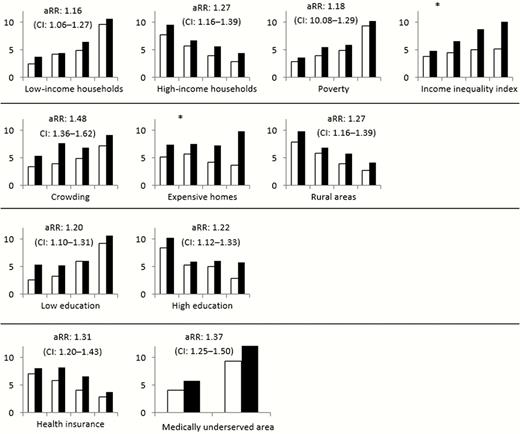
Methicillin-resistant Staphylococcus aureus (MRSA) incidence by race, stratified by quartiles of census tracts related to specific income, housing, education, and health variables. Incidences are displayed in increasing quartiles of census tracts, per 100000 persons for white (no fill) and black (solid fill) persons. The adjusted rate ratio (aRR) and 95% confidence interval (CI) of MRSA in black persons (reference group for aRR: rate in white persons) considering stratification is shown in each graph except when marked by (*) to indicate heterogeneity in RRs across quartiles (ie, interaction between race and the census tract measure). Refer to Table 1 for a description of individual variables.
Stratified analysis suggested interaction between race and socioeconomic characteristics in 2 situations. Increasing RRs for MRSA infection incidence in black persons were seen in census tracts with either greater income inequality (RR, 1.26 in lowest quartile of census tracts vs 1.93 in highest quartile) or larger percentage of expensive homes (RR, 1.44 in lowest quartile vs 2.66 in highest quartile).
Multivariable Analyses
In our mediation analyses, the rate ratio for community-associated MRSA capturing the total (ie, unadjusted) effect of black race compared with white race was 1.68 (95% CI, 1.53–1.84) (Figure 3). Socioeconomic variables determined to be independent and included in our mediation analysis were proportion of expensive homes in a census tract, proportion of persons with high education, proportion of low-income households, proportion of persons living in a rural area, and being a medically underserved area.
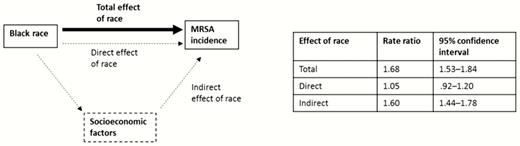
Results from mediation analysis to estimate the extent to which socioeconomic factors explain racial variation in invasive community-associated methicillin-resistant Staphylococcus aureus (MRSA) incidence. Diagram depicts the estimated rate ratio for the total effect of black race on invasive community-associated MRSA incidence (corresponding to unadjusted rate ratio and shown with the thick black arrrow) as well as a potential pathway in which race affects invasive community-associated MRSA incidence through socioeconomic factors (indirect effect of race) or independently (direct effect) as shown in dashed lines/arrows. Socioeconomic factors accounted for in the mediation analysis were proportion of expensive homes in a census tract, proportion of persons with high education, proportion of low-income households, proportion of persons living in a rural area, and being a medically underserved area.
Illustrative diagrams depicting potential relationships between race, SES, and invasive MRSA incidence, as well as results from mediation analysis, are shown in Figure 3. When accounting for all of these census tract–level socioeconomic mediators, 91% of the total effect was explained by census tract–level factors (RR for indirect effect, 1.60; 95% CI, 1.44–1.78). The resultant direct effect of race, representing effect of race on invasive MRSA incidence independent of socioeconomic factors considered, was not significant (RR, 1.05; 95% CI, .92–1.20).
Sensitivity Analyses
In sensitivity analyses, regardless of which EIP site’s data was withheld from mediation analysis, race did not have a significant direct effect on MRSA infection incidence when accounting for socioeconomic factors.
DISCUSSION
We found that neighborhoods characterized by lower SES and higher urbanicity had higher rates of invasive community-associated MRSA. Furthermore, there was no significant association of black race with MRSA infection rates in the mediation analysis when accounting for socioeconomic factors.
The results of our study suggest that the observed differences in invasive community-associated MRSA rates by race are primarily related to social factors. This is also consistent with findings outside the United States that persons living in areas of lower SES have higher rates of MRSA [19, 30]. These social factors are likely to reflect specific drivers such as availability and affordability of medical care, crowding, and poverty, both at the individual and community levels. There is also biologic plausibility for socioeconomic factors to be the major determinants of invasive community-associated MRSA rates. For example, poverty has been associated with increased prevalence of MRSA colonization, and there may be less transmission pressure in areas that are more rural [31]. Of note, factors such as differences in surgical procedures and dialysis (both of which have associations with underlying illnesses such as diabetes and predilection to infections) would not explain differences in invasive community-associated MRSA incidence as cases with these major healthcare exposures are excluded from our analysis.
The more proximal causes of racial disparities for invasive MRSA rates could not be directly elucidated by these data, given that we could not examine individual-level factors such as medical care, medical conditions, living situation, and SES. However, this work provides evidence that disparities in MRSA infection incidence can be explained on the basis of SES and thus do not depend on inherited biological factors. Even though SES is difficult to intervene on directly, the drivers for disparities may be modifiable factors. For example, disparities might be the result of behavioral risk factors linked to lower SES, such as intravenous drug use, lack of access to treatment for MRSA infections before becoming invasive, or differences in acquired medical conditions resulting from low SES. The modifiable factors produced by low SES that are responsible for disparities in MRSA should be explored further to guide efforts to reduce incidence of community-associated MRSA, particularly as characteristics described in the literature to be significantly linked with acquisition of community-associated MRSA (eg, HIV infection and intravenous drug use [18]) were associated with only a minority of cases in our analysis. These results also suggest that interventions for preventing invasive community-associated MRSA may have greater impact if focused on communities and regions with low SES. For example, such interventions could involve targeting educational messages for prevention of community-associated MRSA [32] to communities at highest risk. Alternatively, when designing studies to evaluate potential interventions for preventing invasive community-associated MRSA, conducting them in the communities with highest incidence/burden might have the most impact. In addition, the finding that most of the racial disparity is related to potentially modifiable factors indicates that in principle the disparity can in fact be addressed, which may be an important finding in itself.
Some caution should be exercised when interpreting the meaning, or even absence, of specific area-based measures in our model of MRSA infection incidence for at least 2 reasons. First, although area-based measures have shown similar effects to individual socioeconomic measures in some studies [33], in this analysis they capture a combination of individual and area SES because individual socioeconomic measures are not available. How these serve as a proxy for conditions and experiences that put individuals at risk for acquiring MRSA requires further investigation. Second, some of the area-based measures we considered are highly correlated with each other. For instance, the proportion of persons in an area with health insurance is correlated with other socioeconomic factors, such as income and education levels within that area. Therefore, the absence of “percentage insured persons” from the variables considered in our mediation analysis does not necessarily indicate that insurance is unimportant. Instead, lack of health insurance might be accounted for implicitly by other socioeconomic factors in the model.
We relied on race as recorded in the medical record by medical providers and multiply imputed race when missing. Compared to patient self-report (the gold standard for determining patient race), we have evidence that our race data are accurate. First, it has been described in the literature that among patients of white or black race, when documentation of race by administrative hospital data is available, it is highly concordant with patient self-report [34]. Second, our model for imputation of unknown race (affecting <15% of cases) has a high accuracy for predicting race in our surveillance data (see Supplementary Methods).
There are several limitations to this analysis. First, we were not able to explore trends in other races due to sample size constraints, or for Hispanic ethnicity, which might be important as analyses of racial and ethnic disparities in other diseases have found that the role of socioeconomic factors can vary by race and ethnicity [35]. Second, it is possible that the geographic areas where surveillance has been performed are not representative of trends in other areas of the United States. For example, some recent studies have suggested associations with swine farming and MRSA infections [36, 37], but the geographic regions in our surveillance are not suitable for exploring this risk factor. However, it is a strength in terms of representativeness of the analysis that it includes data from several states throughout the country, and the EIP is therefore a reasonable approximation of the United States [38]. Finally, we were unable to directly incorporate some potentially important social or community factors associated with elevated risk of community-associated MRSA, such as prior incarceration, in our analysis. We also did not have individual-level data from control patients or community-level data to account for risk conferred by underlying medical conditions.
In conclusion, racial disparities in invasive community-associated MRSA rates appear to be largely explained by socioeconomic disparities. Broader understanding of the mechanisms by which SES influences MRSA rates could be a major step forward in informing efforts to prevent community-associated MRSA, and focusing prevention efforts on communities with higher risk may be worth exploring as a strategy for reducing the public health burden of community-associated MRSA.
Supplementary Data
Supplementary materials are available at Clinical Infectious Diseases online. Consisting of data provided by the author to benefit the reader, the posted materials are not copyedited and are the sole responsibility of the author, so questions or comments should be addressed to the author.
Notes
Acknowledgments. The authors thank Centers for Disease Control and Prevention (CDC) staff members Fernanda Lessa for concept design; Shirley Zhang for database assistance; Rand Young, Prabasaj Paul, Emily Weston, and Alejandro Perez for technical assistance; and the following Emerging Infections Program (EIP) site staff for data collection, including geocoding of data, and project oversight at sites: Erin Parker, Lauren Pasutti, Brittany Martin, Cindy Amezcua, Gretchen Rothrock, and Arthur Reingold (California EIP); Wendy Bamberg, Deborah Aragon, and Veronica Fialkowksi (Colorado EIP); Carmen Marquez and Michelle Wilson (Connecticut EIP); Randy Van Dolson, Sasha Harb, Stepy Thomas, Monica Farley, Susan Ray, and Wendy Baughman (Georgia EIP); Terresa Carter, Rosemary Hollick, Kathleen Shutt, Joanne Benton, Kim Holmes, and Lindsay Bonner (Maryland EIP); Katherine Como-Sabetti and Lindsey Lesher (Minnesota EIP); Anita Gellert and Christina Felsen (New York EIP); Heather Jamieson and Tasha Poissant (Oregon EIP); and Gail Hughett, Terri McMinn, Brenda Barnes, Karen Leib, and Katie Dyer (Tennessee EIP).
Disclaimer. The findings and conclusions in this paper are those of the authors and do not necessarily represent the views of the CDC.
Financial support. This work was supported by a cooperative agreement through the CDC’s Emerging Infections Program (grant numbers U50CK000201 [California], U50CK000194 [Colorado], U50CK000195 [Connecticut], U50CK000196 [Georgia], U50CK000203 [Maryland], U50CK000204 [Minnesota], U50CK000199 [New York], U50CK000197 [Oregon], and U50CK000198 [Tennessee]).
Potential conflicts of interest. All authors: No reported conflicts. The authors have submitted the ICMJE Form for Disclosure of Potential Conflicts of Interest. Conflicts that the editors consider relevant to the content of the manuscript have been disclosed.
References
Author notes
Presented in part: 2015 ID Week, San Diego, California, 9 October 2015. Abstract 1130.
Correspondence: I. See, Division of Healthcare Quality Promotion, Centers for Disease Control and Prevention, 1600 Clifton Rd, MS A-16, Atlanta, GA 30329–4027 ([email protected]).

