


Abstract
Background. Country-specific studies in Africa have indicated that Plasmodium falciparum is associated with invasive nontyphoidal Salmonella (iNTS) disease. We conducted a multicenter study in 13 sites in Burkina Faso, Ethiopia, Ghana, Guinea-Bissau, Kenya, Madagascar, Senegal, South Africa, Sudan, and Tanzania to investigate the relationship between the occurrence of iNTS disease, other systemic bacterial infections, and malaria.
Methods. Febrile patients received a blood culture and a malaria test. Isolated bacteria underwent antimicrobial susceptibility testing, and the association between iNTS disease and malaria was assessed.
Results. A positive correlation between frequency proportions of malaria and iNTS was observed ( P = .01; r = 0.70). Areas with higher burden of malaria exhibited higher odds of iNTS disease compared to other bacterial infections (odds ratio [OR], 4.89; 95% CI, 1.61–14.90; P = .005) than areas with lower malaria burden. Malaria parasite positivity was associated with iNTS disease (OR, 2.44; P = .031) and gram-positive bacteremias, particularly Staphylococcus aureus , exhibited a high proportion of coinfection with Plasmodium malaria. Salmonella Typhimurium and Salmonella Enteritidis were the predominant NTS serovars (53/73; 73%). Both moderate (OR, 6.05; P = .0001) and severe (OR, 14.62; P < .0001) anemia were associated with iNTS disease.
Conclusions. A positive correlation between iNTS disease and malaria endemicity, and the association between Plasmodium parasite positivity and iNTS disease across sub-Saharan Africa, indicates the necessity to consider iNTS as a major cause of febrile illness in malaria-holoendemic areas. Prevention of iNTS disease through iNTS vaccines for areas of high malaria endemicity, targeting high-risk groups for Plasmodium parasitic infection, should be considered.
Nontyphoidal Salmonella (NTS) infections in specific populations in sub-Saharan Africa can result in invasive disease. Invasive NTS (iNTS) disease is associated with diverse, nonspecific clinical features that can be difficult to distinguish from typhoid fever and other febrile illnesses [ 1 , 2 ]. There is a paucity of data regarding the incidence of iNTS disease in Africa, but a recent systematic review of the global burden of iNTS disease estimated 3.4 million cases in 2010 with the highest burden of disease arising in Africa, with a case fatality rate of 20% [ 3 , 4 ]. Multiple studies have been conducted to investigate host-associated risk factors for iNTS disease and have identified recent malaria [ 5 ], human immunodeficiency virus (HIV) [ 6 ], severe anemia [ 7 ], severe malnutrition [ 8 ], and sickle cell disease [ 9 , 10 ] to be associated. However, our understanding of the natural history of iNTS, the transmission dynamics of the organisms, the features of asymptomatic human infections, the reservoirs, and the immune responses during infection are incomplete.
Among the 198 million global cases of malaria in 2013, 584 000 deaths were reported, 90% of which originated from sub-Saharan Africa [ 11 ]. The burden of malaria correlates with the force of infection, with disease concentrated among infants and young children in high-transmission areas [ 12 ]. Yet, the misdiagnosis of bacteremia as malaria is frequent, especially in sites with inadequate microbiological laboratory infrastructure to identify the pathogenic microorganisms [ 13 ]. Where transmission is intense, seemingly healthy older children and adults may experience Plasmodium falciparum infection with partial immunity, which may prevent the development of clinical symptoms [ 14 ]. This, coupled with the nonspecific clinical presentation of iNTS disease [ 2 ], means that patients with iNTS disease may be treated with antimalarials and/or inappropriate antimicrobials. Growing drug-resistant malaria [ 15 ] and antimicrobial resistance among iNTS strains implies that empiric antimicrobial regimens may not be effective against the locally circulating organisms [ 16 , 17 ].
Although the relationship between iNTS disease and malaria has been previously investigated [ 5 , 18 ], those studies have been constrained by the use of noncomparable study designs and by being restricted to one site. Here we describe the epidemiological features of iNTS disease and malaria in comparison to other community-acquired bacteremias in sub-Saharan Africa using a standardized multicenter approach.
METHODS
Febrile Disease Surveillance
Surveillance of invasive Salmonella infections in sub-Saharan Africa was conducted as described elsewhere (Marks F. et al, unpublished data), [ 19–20 ]. In brief, standardized healthcare-facility-based surveillance of febrile patients was instituted in 13 sites in sub-Saharan Africa: Nioko and Polesgo, Burkina Faso (BF); Butajira, Ethiopia; Asante Akim North District (AAN), Ghana; Bissau, Guinea-Bissau; the Kibera informal settlement in Nairobi, Kenya; Imerintsiatosika and Isotry, Madagascar; Pikine, Senegal; Pietermaritzburg, South Africa; East Wad Medani (EWM), Sudan; and Moshi Urban and Moshi Rural, Tanzania.
Study Population, Inclusion Criteria, Sample Collection, and Laboratory Diagnoses
Febrile patients from all age groups (except in Ghana, where only children aged <15 years were enrolled) with a tympanic or axillary temperature of ≥38.0°C or ≥37.5°C, respectively, living in the defined study areas were eligible for recruitment. For inpatients, reported fever within the period of 72 hours prior to admission was added to the inclusion criteria (Marks F. et al, unpublished data), [ 19 ]. Blood specimens were obtained from febrile patients for aerobic blood culturing (BD Bactec, Becton-Dickinson, Franklin Lakes, New Jersey or BacT/ALERT, bioMérieux, Marcy l'Etoile, France) and malaria diagnostics were performed via a combination of thick and thin blood smears and rapid malaria tests (SD Bioline Malaria Ag P.f/P.v, SD Standard Diagnostics, Suwon, Republic of Korea) that varied among sites.
Data Analysis
As the adjusted incidence rates of bacteremia calculated per 100 000 person-years of observation are described elsewhere (Marks F. et al, unpublished data), here, frequency proportions of bacteremias and Plasmodium parasite positivity are presented. After a normality test of our dataset, correlations between malaria and bacteremias from all sites were analyzed with the Spearman correlation coefficient ( r ). To measure the odds ratios (ORs) of iNTS infections per exposure to malaria endemicity (proportion of malaria frequencies at health facilities used as a proxy), generalized estimating equation (GEE) logistic regression was used. Stratified logistic regression for the univariate and multivariable analysis was performed to understand the individual-level covariates including Plasmodium spp. parasite positivity and anemia, considered to be associated with iNTS disease. Data were statistically analyzed taking into account age groups, sex, site-specific characteristics, and clinical data using Microsoft Excel (version 9.0, Microsoft Corporation, Redmond, Washington) and SAS software (version 9.4, SAS Institute, Cary, North Carolina).
RESULTS
Site and Age-Stratified Frequencies of iNTS Disease, Other Bacteremias, Malaria, and Coinfections
A total of 13 431 febrile patients were enrolled and had a blood culture performed during 2010–2014. Of the 13 431 blood cultures, 497 (4%) were positive for a bacterial pathogen: 73 (15%) NTS ( Salmonella Typhimurium [n = 38/73; 52%], Salmonella Enteritidis [n = 15/73; 21%], Salmonella Dublin [n = 10/73; 14%], and several other undetermined Salmonella serovars [n = 10/73; 14%]); 3 (1%) Salmonella Paratyphi A; 137 (28%) Salmonella Typhi; and 272 (55%) non- Salmonella bacteremias (179/272 [66%] gram-positive and 93/272 [34%] non- Salmonella gram-negative bacteremias) . The proportion of NTS among positive blood cultures was the highest in Nioko, BF (8/27; 30%) and AAN, Ghana (46/157; 29%), although the proportion of gram-positive bacteremia was equivalently high in the latter (Figure 1 ).
![Flowchart of Typhoid Fever Surveillance in Africa Program (TSAP) blood culture and malaria test performance. Blood culture–positive isolates: contaminants excluded (Marks F. et al, unpublished data). Gram-negative isolates: Salmonella species excluded. Malaria tests performed per site: Nioko, Burkina Faso (BF; thick/thin blood smears), Polesgo, BF (thick/thin blood smears), Butajira, Ethiopia (Rapid Diagnostic Test [RDT] and thick/thin blood smears), Asante Akim North District (AAN), Ghana (thick/thin blood smears), Bissau, Guinea-Bissau (GB; thick/thin blood smears), Kibera, Kenya (thick blood smear), Imerintsiatosika, Madagascar (MG; RDT and thick/thin blood smears), Isotry, MG (RDT and thick/thin blood smears), Pikine, Senegal (RDT if available and thick/thin blood smears), Pietermaritzburg, South Africa (SA; malaria-free zone: no malaria test performed), East Wad Medani (EWM), Sudan (thick/thin blood smears), Moshi Rural (MR), Tanzania (thick/thin blood smears), and Moshi Urban (MU), Tanzania (thick/thin blood smears). Numerators and denominators for each percentages (%) in the flowchart (in descending order from top to bottom): % of blood culture performed of recruited patients; % of malaria test performed of recruited patients; % of blood culture positive isolates of blood culture performed; % of malaria parasite–positive cases of malaria test performed; % of bacterial isolates coinfected with malaria of blood culture-confirmed positive isolates; % of nontyphoidal Salmonella (NTS), S. Typhi, Gram-positive, and non- Salmonella gram-negative isolates of blood culture-confirmed positive isolates; % of isolates with NTS-malaria coinfection, S . Typhi-malaria coinfection, gram-positive-malaria coinfection, non- Salmonella gram-negative-malaria coinfection of all bacterial isolates coinfected with malaria. Malaria species: 2801/3133 malaria positives confirmed with malaria species; 332/3133 missing data on malaria species; 2779/2801 Plasmodium falciparum ; 20/2801 Plasmodium malariae ; 2/2801 Plasmodium ovale . Malaria species confirmed per site listed below. Nioko, BF: 430/430 P. falciparum ; Polesgo, BF: 444/444 P. falciparum . Butajira, Ethiopia: 26/110 P. falciparum and 84 missing data on malaria species. AAN, Ghana: 1111/1139 P. falciparum , 20/1139 P. malariae , 2/1139 P. ovale , and 6 missing data on malaria species. Bissau, GB: 196/206 P. falciparum and 10 missing data on malaria species. Kibera, Kenya: not available/226 (no data on malaria species). Imerintsiatosika, MG: 19/19 P. falciparum ; Isotry, MG: 2/2 P. falciparum . Pikine, Senegal: 291/297 P. falciparum , and 6 missing data on malaria species. Pietermaritzburg, SA: No malaria test performed as the country is malaria-free. EWM, Sudan: 254/254 P. falciparum . MR, Tanzania: 2/2 P. falciparum ; MU, Tanzania: 4/4 P. falciparum . Abbreviations: H, hospital; HC, health center; IPD, inpatient department; NA, not available; OPD, outpatient department.](https://oup.silverchair-cdn.com/oup/backfile/Content_public/Journal/cid/62/suppl_1/10.1093_cid_civ893/3/m_civ89301a.jpeg?Expires=1750183240&Signature=bJlofKoIwav0FSkxjBiMLOp8P1CupFVpz4D9hh7u1sfAZKcubKPo0k92sxQ0GP-aroszsxBmgOlFFoW6FS0nrNNjQYC9MjhXiIJZUbPafaNaS0znLD26dSUXMk75j22sDZJ-B2mLm35s2-c2G~bMyHP~LMRmP~1ggkV1Kc93DSzhtQ69JBHOmPhc2v8veVNzjXEC9LAwo59VApEWMrWpDTb6m9ME3IQw8WRiTSu6DvU0zYxj3OcefD8-gPOV5Ll9CqTif-CQe4ErlMDLIF51bqrC6HF5plrtCu8niXpgFHhJw8OhB4tt7vdJezRsQucL2fHAH7PlkzFZH8~7hG0i5g__&Key-Pair-Id=APKAIE5G5CRDK6RD3PGA)
![Flowchart of Typhoid Fever Surveillance in Africa Program (TSAP) blood culture and malaria test performance. Blood culture–positive isolates: contaminants excluded (Marks F. et al, unpublished data). Gram-negative isolates: Salmonella species excluded. Malaria tests performed per site: Nioko, Burkina Faso (BF; thick/thin blood smears), Polesgo, BF (thick/thin blood smears), Butajira, Ethiopia (Rapid Diagnostic Test [RDT] and thick/thin blood smears), Asante Akim North District (AAN), Ghana (thick/thin blood smears), Bissau, Guinea-Bissau (GB; thick/thin blood smears), Kibera, Kenya (thick blood smear), Imerintsiatosika, Madagascar (MG; RDT and thick/thin blood smears), Isotry, MG (RDT and thick/thin blood smears), Pikine, Senegal (RDT if available and thick/thin blood smears), Pietermaritzburg, South Africa (SA; malaria-free zone: no malaria test performed), East Wad Medani (EWM), Sudan (thick/thin blood smears), Moshi Rural (MR), Tanzania (thick/thin blood smears), and Moshi Urban (MU), Tanzania (thick/thin blood smears). Numerators and denominators for each percentages (%) in the flowchart (in descending order from top to bottom): % of blood culture performed of recruited patients; % of malaria test performed of recruited patients; % of blood culture positive isolates of blood culture performed; % of malaria parasite–positive cases of malaria test performed; % of bacterial isolates coinfected with malaria of blood culture-confirmed positive isolates; % of nontyphoidal Salmonella (NTS), S. Typhi, Gram-positive, and non- Salmonella gram-negative isolates of blood culture-confirmed positive isolates; % of isolates with NTS-malaria coinfection, S . Typhi-malaria coinfection, gram-positive-malaria coinfection, non- Salmonella gram-negative-malaria coinfection of all bacterial isolates coinfected with malaria. Malaria species: 2801/3133 malaria positives confirmed with malaria species; 332/3133 missing data on malaria species; 2779/2801 Plasmodium falciparum ; 20/2801 Plasmodium malariae ; 2/2801 Plasmodium ovale . Malaria species confirmed per site listed below. Nioko, BF: 430/430 P. falciparum ; Polesgo, BF: 444/444 P. falciparum . Butajira, Ethiopia: 26/110 P. falciparum and 84 missing data on malaria species. AAN, Ghana: 1111/1139 P. falciparum , 20/1139 P. malariae , 2/1139 P. ovale , and 6 missing data on malaria species. Bissau, GB: 196/206 P. falciparum and 10 missing data on malaria species. Kibera, Kenya: not available/226 (no data on malaria species). Imerintsiatosika, MG: 19/19 P. falciparum ; Isotry, MG: 2/2 P. falciparum . Pikine, Senegal: 291/297 P. falciparum , and 6 missing data on malaria species. Pietermaritzburg, SA: No malaria test performed as the country is malaria-free. EWM, Sudan: 254/254 P. falciparum . MR, Tanzania: 2/2 P. falciparum ; MU, Tanzania: 4/4 P. falciparum . Abbreviations: H, hospital; HC, health center; IPD, inpatient department; NA, not available; OPD, outpatient department.](https://oup.silverchair-cdn.com/oup/backfile/Content_public/Journal/cid/62/suppl_1/10.1093_cid_civ893/3/m_civ89301b.jpeg?Expires=1750183240&Signature=KmE8apLSGZzGXWP31R-2SaT1~Z~ersWHmXaefr8tKhGyfh6hMMmD6Z~EMKjtdmpas9xIEFGBG1jiE41J9J5ahRhq52bXsjNJkjJBYDroKqGHqQqvrsGx-Kucexy4P-uWwAhVao93ECC27B9f2tJMIj13rgw4ZloJU3rNZ5PNt~MOYBQiZ1ZXYrDc7TIHWrD0r~--oyuxugis5Hzce8YQ~S1Qd78X7l0YMsOBEAXXhfswjoOhIwQdFD3ztg18cRajcKYCxMu3R8mD7uwaSmmwTlHFFhcKyRYitFk0R9f3TFq2BLtdeWTofzfRfTdnA2ttbC4daymTnH27RAHx2qtXXw__&Key-Pair-Id=APKAIE5G5CRDK6RD3PGA)
Flowchart of Typhoid Fever Surveillance in Africa Program (TSAP) blood culture and malaria test performance. Blood culture–positive isolates: contaminants excluded (Marks F. et al, unpublished data). Gram-negative isolates: Salmonella species excluded. Malaria tests performed per site: Nioko, Burkina Faso (BF; thick/thin blood smears), Polesgo, BF (thick/thin blood smears), Butajira, Ethiopia (Rapid Diagnostic Test [RDT] and thick/thin blood smears), Asante Akim North District (AAN), Ghana (thick/thin blood smears), Bissau, Guinea-Bissau (GB; thick/thin blood smears), Kibera, Kenya (thick blood smear), Imerintsiatosika, Madagascar (MG; RDT and thick/thin blood smears), Isotry, MG (RDT and thick/thin blood smears), Pikine, Senegal (RDT if available and thick/thin blood smears), Pietermaritzburg, South Africa (SA; malaria-free zone: no malaria test performed), East Wad Medani (EWM), Sudan (thick/thin blood smears), Moshi Rural (MR), Tanzania (thick/thin blood smears), and Moshi Urban (MU), Tanzania (thick/thin blood smears). Numerators and denominators for each percentages (%) in the flowchart (in descending order from top to bottom): % of blood culture performed of recruited patients; % of malaria test performed of recruited patients; % of blood culture positive isolates of blood culture performed; % of malaria parasite–positive cases of malaria test performed; % of bacterial isolates coinfected with malaria of blood culture-confirmed positive isolates; % of nontyphoidal Salmonella (NTS), S. Typhi, Gram-positive, and non- Salmonella gram-negative isolates of blood culture-confirmed positive isolates; % of isolates with NTS-malaria coinfection, S . Typhi-malaria coinfection, gram-positive-malaria coinfection, non- Salmonella gram-negative-malaria coinfection of all bacterial isolates coinfected with malaria. Malaria species: 2801/3133 malaria positives confirmed with malaria species; 332/3133 missing data on malaria species; 2779/2801 Plasmodium falciparum ; 20/2801 Plasmodium malariae ; 2/2801 Plasmodium ovale . Malaria species confirmed per site listed below. Nioko, BF: 430/430 P. falciparum ; Polesgo, BF: 444/444 P. falciparum . Butajira, Ethiopia: 26/110 P. falciparum and 84 missing data on malaria species. AAN, Ghana: 1111/1139 P. falciparum , 20/1139 P. malariae , 2/1139 P. ovale , and 6 missing data on malaria species. Bissau, GB: 196/206 P. falciparum and 10 missing data on malaria species. Kibera, Kenya: not available/226 (no data on malaria species). Imerintsiatosika, MG: 19/19 P. falciparum ; Isotry, MG: 2/2 P. falciparum . Pikine, Senegal: 291/297 P. falciparum , and 6 missing data on malaria species. Pietermaritzburg, SA: No malaria test performed as the country is malaria-free. EWM, Sudan: 254/254 P. falciparum . MR, Tanzania: 2/2 P. falciparum ; MU, Tanzania: 4/4 P. falciparum . Abbreviations: H, hospital; HC, health center; IPD, inpatient department; NA, not available; OPD, outpatient department.
A total of 11 421 of 13 431 (85%) blood samples were screened for malaria, of which 3133 (27%) were positive by any malaria test. The proportion of malaria frequencies presented at healthcare facilities was the highest in Polesgo, BF (444/744; 60%) and Nioko, BF (430/908; 47%), followed by AAN, Ghana (1139/2651; 43%), and EWM, Sudan (254/632; 40%). Sites in Ethiopia, Madagascar, and Tanzania had the lowest proportion of malaria-positive results. Of 3133 positive malaria tests, 1386 (44%) were from children aged <5 years. All, with the exception of 20 Plasmodium malariae and 2 Plasmodium ovale infections in AAN, Ghana and with 332 missing data on the Plasmodium species, were P. falciparum monoinfections.
The proportion of malaria coinfection with any bacterial pathogen from all 13 sites was 11% (53/497), predominantly gram-positive bacterial coinfection with malaria (22/53; 42%) and NTS-malaria coinfection (15/53; 28%) (Figure 1 ; Table 1 ). The malaria/iNTS coinfections were more common among children <5 years of age (11/20; 55%), particularly under 2 years of age (7/12; 58%), whereas all malaria/ Salmonella Typhi coinfections occurred in children >5 years of age. Children between 5 and 15 years of age had the highest proportion of malaria/bacteremia coinfection with a gram-positive bacterium (11/22; 50%). Children <2 years of age showed the highest proportion of iNTS (35/126; 28% or 35/73; 48%) and gram-positive bacterial infections (50/126; 40% or 50/179; 28%) compared with the other age groups (Table 1 ).
Age-Specific Frequencies of Organisms Isolated From Blood Culture and Malaria Test
| Blood Culture–Confirmed Organism | All Ages | 0 to <2 y | 2 to <5 y | 5 to <15 y | ≥15 y | Median Age, y (Q1–Q3) |
|---|---|---|---|---|---|---|
| Blood culture performed (No.) | 13 431 | 2843 | 2402 | 3355 | 4831 | |
| All pathogenic bacteria (no., % of No.) | 497 (4) | 126 (4) | 107 (4) | 141 (4) | 123 (3) | 5 (1–14) |
| NTS including 3 S . Paratyphi A (no., % of all pathogenic bacteria) a | 76 (15) | 35 (28) | 24 (22) | 10 (7) | 7 (6) | 2 (1–3) |
| Salmonella Typhi (no., % of all pathogenic bacteria) | 137 (28) | 6 (5) | 34 (32) | 67 (48) | 30 (24) | 8 (4–14) |
| Gram-negative bacteria (no., % of all pathogenic bacteria) b | 93 (19) | 34 (27) | 6 (6) | 15 (11) | 38 (31) | 6 (2–14) |
| Gram-positive bacteria (no., % of all pathogenic bacteria) | 179 (36) | 50 (40) | 42 (39) | 47 (33) | 40 (33) | 4 (1–13) |
| Malaria test performed (No.) c | 11421 | 2136 | 2031 | 3007 | 4247 | |
| Malaria positive (no., % of No.) | 3133 (27) | 527 (25) | 859 (42) | 1083 (36) | 664 (16) | 6 (2–12) |
| Plasmodium falciparum (no., % of malaria positive) | 2779 (89) | 500 (95) | 782 (91) | 913 (84) | 584 (88) | 5 (2–12) |
| Plasmodium malariae (no., % of malaria positive) | 20 (1) | 5 (1) | 8 (1) | 7 (1) | 0 (0) | 4 (2–6) |
| Plasmodium ovale (no., % of malaria positive) | 2 (0.1) | 0 (0) | 0 (0) | 2 (0.2) | 0 (0) | 6 (6–6) |
| Malarial-bacterial coinfection (no., % of all pathogenic bacteremia) | 53 (11) | 12 (10) | 8 (7) | 22 (16) | 11 (9) | 6 (2–11) |
| Malaria-NTS (no., % of coinfection) | 15 (28) | 7 (58) | 4 (50) | 4 (18) | 0 (0) | 2 (1–5) |
| Malaria- S. Typhi (no., % of coinfection) | 9 (17) | 0 (0) | 0 (0) | 5 (23) | 4 (36) | 9 (6–22) |
| Malaria gram-negative (no., % of coinfection) d | 7 (13) | 1 (8) | 1 (13) | 2 (9) | 3 (27) | 5 (1–11) |
| Malaria gram-positive (no., % of coinfection) e | 22 (42) | 4 (33) | 3 (38) | 11 (50) | 4 (36) | 7 (3–11) |
Abbreviation: NTS, nontyphoidal Salmonella .
a Total of 3 S . Paratyphi A and 73 NTS isolates: 38 of 73 (50%) Salmonella Typhimurium, 15 of 73 (20%) Salmonella Enteritidis, 10 of 73 (14%) Salmonella Dublin, and 10 of 73 (14%) other undetermined Salmonella serovars. The 3 S . Paratyphi A isolates were all female; 14, 20, and 25 years of age; none exhibited malaria coinfection.
b Gram-negative bacteria: Salmonella species excluded.
c Malaria test was performed through Rapid Diagnostic Test or/and blood film (thick and thin smears) (Figure 1 ). Of 11 421 blood samples screened for malaria, 3133 (27%) resulted positive: 20 P. malariae and 2 P. ovale were from Asante Akim North, Ghana. Three hundred thirty-two malaria-positive cases missed data on malaria species. Except for these, all were P. falciparum .
d Malaria gram-negative coinfection ( Salmonella species excluded): Of the 7 cases of malaria coinfection with gram-negative bacteria, 3 were Escherichia coli (all >15 years of age) and 2 Pseudomonas aeruginosa (one <2 years of age, one 5 to <15 years of age). No cases of malaria coinfection with Klebsiella pneumoniae .
e Malaria gram-positive coinfection: Of 22 cases of malaria coinfection with gram-positive bacteria, 59% (13/22) were Staphylococcus aureus (3 between 2 and <5 years, 6 between 5 and <15 years, and 4 aged ≥15 years) and 5 Streptococcus pneumoniae (2 under 2 years of age, 3 between 5 and <15 years of age).
iNTS–Malaria Correlations, Risk Factors, and Clinical Characteristics
A strong linear correlation of malaria with iNTS across sites was found ( P = .01; r = 0.70) (Figure 2 ). Areas with higher malaria burden had higher odds of iNTS disease compared with other bacterial infections (OR, 4.89; 95% confidence interval [CI], 1.61–14.90; P = .005; GEE logistic regression) than areas with lower burden of malaria (Table 2 ). Furthermore, relative to non-NTS invasive bacterial infections, Plasmodium parasite positivity was associated with iNTS disease (OR, 2.44; 95% CI, 1.09–5.47; P = .031; stratified univariate analysis; Table 3 ).
Characteristics of Bacterial Infection per Malaria Endemicity
| Characteristic | Risk Factor (Exposure) | |||
|---|---|---|---|---|
| Sites With Lower Malaria Endemicity a (n c = 105) | Sites With Higher Malaria Endemicity b (n = 392) | Odds Ratio (95% CI) | P Value | |
| iNTS infection d | 3 (2.9) | 73 (18.6) | 4.89 (1.61–14.90) | .005 |
| Salmonella Typhi infection | 23 (21.9) | 114 (29.1) | 0.94 (.38–2.32) | .893 |
| Gram-positive bacterial infection | 44 (41.9) | 135 (34.4) | 0.76 (.31–1.84) | .540 |
| Gram-negative bacterial infection | 24 (22.9) | 69 (17.6) | 1.09 (.48–2.46) | .842 |
| Malaria coinfection with all bacteremia e | 1 (1.5) | 52 (14.6) | 17.44 (2.76–110.10) | .002 |
Data are presented as No. (%) unless otherwise specified.
Abbreviations: CI, confidence interval; iNTS, invasive nontyphoidal Salmonella .
a Sites with lower malaria endemicity (lower-frequency proportions of malaria): Ethiopia (Butajira), Madagascar (Imerintsiatosika, Isotry), Tanzania (Moshi Rural, Moshi Urban), and malaria-free South Africa (Pietermaritzburg) (see Figure 1 ).
b Sites with higher malaria endemicity (higher-frequency proportions of malaria): Burkina Faso (Nioko, Polesgo), Ghana (Asante Akim North District), Guinea-Bissau (Bandim), Kenya (Kibera), Senegal (Pikine), and Sudan (East Wad Medani) (see Figure 1 ).
c No. = blood culture–confirmed real pathogen (excluding contaminants).
d iNTS infection: 3 S. Paratyphi A isolates grouped under iNTS in this analysis.
e Malaria coinfection with all bacteremia is analyzed based on number of blood culture positive cases with malaria test performed. Out of total 497 blood culture positive isolates, 422 had malaria test performed, which is grouped into sites with lower malaria endemicity ( n = 65) and sites with higher malaria endemicity ( n = 357).
Univariate and Multivariable Analyses of Characteristics Associated With Invasive Nontyphoidal Salmonella Disease a
| Characteristics Associated With iNTS Disease | Univariate Analysis | Multivariable Analysis | ||||
|---|---|---|---|---|---|---|
| iNTS (n b = 76) | Non-NTS Bacteremias (n c = 421) | OR (95% CI) | P Value | OR (95% CI) | P Value | |
| Malaria parasite positivity | 15 (19.7) | 38 (9.0) | 2.44 (1.09–5.47) | .031 | 2.10 (.84–5.24) | .110 |
| Nutritional status d | ||||||
| Moderate underweight (<10 y) e | 8 (11.9) | 30 (12.0) | 1.05 (.43–2.54) | .917 | NA f | NA f |
| Severe underweight (<10 y) g | 10 (14.9) | 47 (18.9) | 0.96 (.43–2.14) | .919 | NA f | NA f |
| Anemia status h | ||||||
| Moderate anemia i | 27 (35.5) | 65 (15.4) | 6.99 (2.79–17.52) | <.0001 | 6.05 (2.41–15.21) | .0001 |
| Severe anemia j | 34 (44.7) | 69 (16.4) | 13.10 (5.05–33.97) | <.0001 | 14.62 (5.56–38.43) | <.0001 |
Data are presented as No. (%) unless otherwise specified.
Abbreviations: CI, confidence interval; iNTS, invasive nontyphoidal Salmonella ; NA, not applicable; NTS, nontyphoidal Salmonella ; OR, odds ratio; SD, standard deviation.
a Stratified logistic regression was used for this univariate and multivariable analysis.
b Total valid case number (n) for iNTS includes the 3 S . Paratyphi A cases for this analysis.
c Total valid case number (n) for non-NTS bacteremia is the total number of blood culture positives (497) minus total number of NTS isolates (76 including 3 S . Paratyphi A): n = 421.
d Association between malnutrition (moderate and severe underweight) and iNTS disease compared to non-iNTS bacteremias. Both moderate and severe underweight cases compared with those without malnutrition.
e Total valid case number (No.) for moderate underweight cases for patients <10 years of age: NTS (n = 8), non-NTS bacteremia (n = 30). World Health Organization (WHO) Global Database on Child Growth and Malnutrition: z score cutoff point of < −2 SD and > −3 SD to classify moderate undernutrition.
f Not applicable due to missing data for patients >10 years of age.
g Total valid case number (No.) for severe underweight cases for patients <10 years of age: NTS (n = 10), non-NTS bacteremia (n = 47). WHO Global Database on Child Growth and Malnutrition: z score cutoff point of < −3 SD to classify severe undernutrition.
h Association between anemia (moderate and severe anemia) and iNTS disease compared to non-iNTS bacteremias. Both moderate and severe anemia cases compared with those without anemia.
i Moderate anemia: age group 0 to <5 years with hemoglobin level 7–9.9 g/dL, and age group ≥5 years with hemoglobin level 8–10.9 g/dL.
j Severe anemia: age group 0 to <5 years with hemoglobin level <7 g/dL, and age group ≥5 years with hemoglobin level <8 g/dL.
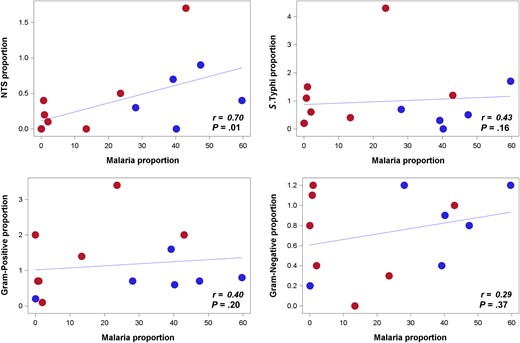
Correlation between frequency proportions of malaria and invasive nontyphoidal Salmonella (iNTS) compared to malaria with other invasive bacteria across 13 sites. Spearman correlation coefficient ( r ) is analyzed based on the proportion of frequencies of malaria, iNTS, Salmonella Typhi, gram-positive and non- Salmonella gram-negative bacterial isolates per site, controlled by each site study period. (Proportions of frequencies are calculated as iNTS, S. Typhi, gram-positive bacteria, non- Salmonella gram-negative bacteria positivity out of blood culture performed; malaria positivity out of malaria test performed.) Scattered dots represent each study sites. Frequencies of bacteremias and Plasmodium parasite positivity per site are noted in Figure 1 . Thirteen sites exhibited in the scattered dots are grouped per surveillance period below or above the median duration of surveillance period (20 months). Sites colored in red dots are those with surveillance period of >20 months: Ethiopia, Ghana, Kenya, South Africa, and Tanzania (urban and rural). Sites colored in blue dots are those with a surveillance period of ≤20 months: Burkina Faso (Nioko and Polesgo), Guinea-Bissau, Madagascar (Imerintsiatosika and Isotry), Senegal, and Sudan. Some sites with same or similar values may appear overlapped, but all 13 sites are dotted in the plot. 3 S. Paratyphi A isolates from Senegal are grouped under NTS in this analysis.
Patients with severe anemia (hemoglobin level <7 g/dL for age group 0 to <5 years; <8 g/dL for ≥5 years) had >10 times higher odds of iNTS disease (univariate analysis: OR, 13.10; P < .0001; multivariable analysis: OR, 14.62; P < .0001) than non-NTS bacteremia. Moderate anemia was also associated with iNTS disease (Table 3 ). Among 76 iNTS patients, which includes 3 S. Paratyphi A cases, 34 (45%) had severe anemia and 10 (15%) iNTS patients <10 years of age were severely underweight. iNTS patients exhibited the highest proportion of hospitalizations (54/76; 71%) and diarrhea (22/76; 29%) compared with other bacteremias: 32% (44/137) and 24% (33/137) of patients infected with Salmonella Typhi; 54% (96/179) and 16% (29/179) of patients with gram-positive bacterial infections; and 56% (52/93) and 16% (15/93) of patients with non- Salmonella gram-negative bacterial infections were hospitalized and had diarrhea.
DISCUSSION
In this study, we demonstrated a positive malaria-iNTS correlation over multiple countries in sub-Saharan Africa. Further, iNTS disease and gram-positive bacteremia were the most common malarial/bacterial coinfections in these areas, exceeding the number of coinfections with Salmonella Typhi and non- Salmonella gram-negative bacteremia. However, some of the sites (EWM, Sudan and Kibera, Kenya) did not follow this trend, as they had a low level of iNTS infections despite a high burden of malaria. This could be due to low local levels of transmission of iNTS disease, leading to reduced exposure of children with malaria to iNTS strains. The patterns of iNTS and malaria infections should also be further investigated in the context of the travel history of Kibera residents or rural–urban migration to Kibera, as people residing in Kibera travel within Kenya and their malaria infections may be associated with travel to areas with a greater malaria risk [ 21 ].
Our data support other studies [ 22–24 ] that suggest an elevated association between iNTS disease and Plasmodium parasite–positive individuals. We additionally found a high proportion of gram-positive bacterial coinfections with malaria, contrasting with earlier studies from the Gambia [ 5 ] and Malawi [ 25 ], that showed a strong association between malaria and iNTS disease, but little evidence for any association between malaria and non- Salmonella bacteremias. However, a recent meta-analysis of studies of children with severe malaria and bacteremia [ 26 ] indicated that in 5 studies, the overall prevalence of gram-positive organisms in children with malaria was greater than that of gram-negative organisms with Staphylococcus aureus , which was the main pathogen isolated in 3 studies. This observation is consistent with malaria-induced impairment of neutrophil function as an underlying causal link: Patients with chronic granulomatous disease, a congenital defect of neutrophil oxidative burst, are particularly susceptible to invasive S. aureus and Salmonella infections [ 27 ].
Although further investigation is required to understand the temporal precedence of infections with malaria parasites and NTS for a risk factor analysis for iNTS disease (including the association between iNTS disease and recent malaria vis-à-vis current malaria or malaria parasite density) [ 22 , 23 , 28 ], a multitude of potential mechanisms may explain this observation. Malaria impairs the oxidative burst function of macrophages and neutrophils, which is likely to increase the risk for iNTS disease, as oxidative burst is key for eliminating Salmonella from the intracellular niches [ 29–32 ]. More recently, the association has been linked to induction of heme oxygenase-1 (HO-1) in a mouse model of malaria that made mice more susceptible to NTS infection [ 33 ]. The same researchers demonstrated that impaired neutrophil oxidative burst was associated with HO-1 induction in Gambian children with malaria [ 34 ]. Malaria has also been shown to increase susceptibility to NTS infection in the mice through inhibition of interleukin 12 production [ 35 ] and increased interleukin 10 levels [ 36 ]. The precise contribution of this HO-1 pathway mechanism to enhanced susceptibility to iNTS disease in humans needs to be further investigated.
The study has some limitations. First, the surveillance period was not long enough to investigate any potential seasonality of malaria, iNTS disease, and coinfections. Second, given that individuals with mild cases of malaria do not necessarily seek healthcare at hospitals, the true burden of malaria is likely to be underreported. Different malaria diagnostics may have also influenced the sensitivity and specificity of the results [ 37 ], and we were unable to distinguish current from recent malaria in our analysis of iNTS risk factors. Third, HIV testing was not performed, as HIV seroprevalence was not a main objective of the Typhoid Fever Surveillance in Africa Program study. Insufficient clinical data precluded the development of robust diagnostic criteria to better predict the causative agents of the patients and the cause of fever, although diarrhea was indicative of iNTS.
Our standardized multicenter approach adds additional information to the epidemiology of iNTS disease and malaria in Africa. Both the positive correlation between malaria and iNTS disease and the association between malaria positivity and iNTS disease support the role of NTS as a common etiology of invasive bacterial disease among children with malaria in areas where malaria is highly prevalent. Furthermore, given that 2 to several days may be required to confirm bacteremia microbiologically [ 38 ], patients with febrile symptoms commonly are given an antimalarial drug and antimicrobials simultaneously, rendering them prone to developing antimicrobial resistance. A similar scenario has occurred with P. falciparum , which is already resistant to chloroquine and sulfadoxine-pyrimethamine in most parts of sub-Saharan Africa, and potentially to artemisinin derivatives in the future [ 15 ]. A high burden of iNTS disease and malaria, coupled with increasing antimicrobial resistance [ 39 , 40 ], may potentially contribute to increased severity of illness.
This provides additional evidence to prioritize the development of an iNTS vaccine, specifically designed for the African setting and used in areas of high iNTS prevalence and malaria endemicity. Such a vaccine could either be developed in a single formulation as a bivalent Salmonella Typhimurium and Salmonella Enteritidis regimen, given their predominance in sub-Saharan Africa as also found in our study, or as a trivalent compound, including Salmonella Typhi. Irrespective, surveillance for bacterial bloodstream infections to identify prevalent isolates should continue to monitor emerging pathogens and antimicrobial resistance. Further research on the development of rapid and accurate diagnostics of invasive Salmonella infections to minimize the risk of unnecessary simultaneous exposure to both antibiotics and antimalarials for those febrile patients is also warranted.
Notes
Acknowledgments. We thank the patients who participated in the study and the committed staff in respective sites and health facilities. The International Vaccine Institute acknowledges Soo-Young Kwon, Hye-Jin Seo, and Hyon-Jin Jeon for their administrative and logistic support during project implementation.
Disclaimer. The findings and conclusions are those of the authors and do not necessarily reflect positions or policies of the Bill & Melinda Gates Foundation or the US Centers for Disease Control and Prevention.
Financial support. The research was funded by the Bill & Melinda Gates Foundation (grant number OPPGH5231). The International Vaccine Institute acknowledges its donors, including the Republic of Korea and the Swedish International Development Cooperation Agency. Research infrastructure at the Moshi site was supported by the US National Institutes of Health (grant numbers R01TW009237; U01 AI062563; R24 TW007988; D43 PA-03-018; U01 AI069484; U01 AI067854; P30 AI064518), and by the UK Biotechnology and Biological Sciences Research Council (grant number BB/J010367). S. B. is a Sir Henry Dale Fellow, jointly funded by the Wellcome Trust and the Royal Society (grant number 100087/Z/12/Z). This publication was made possible through a grant from the Bill & Melinda Gates Foundation (OPP1129380).
Supplement sponsorship. This article appears as part of the supplement “Typhoid Fever Surveillance in Africa Program (TSAP),” sponsored by the International Vaccine Institute.
Potential conflicts of interest. All authors: No reported conflicts. All authors have submitted the ICMJE Form for Disclosure of Potential Conflicts of Interest. Conflicts that the editors consider relevant to the content of the manuscript have been disclosed.
References

