


Abstract
Background. Live oral rotavirus (RV) vaccines have shown modest efficacy among children in African countries for reasons that are not completely understood. We examined the possible inhibitory effect of preexisting antirotavirus antibodies on immunogenicity of monovalent RV vaccine (RV1).
Methods. Mother–infant pairs were enrolled at presentation for their routine immunization visit in Soweto, South Africa, when infants were aged 5–8 weeks. Infant serum samples were obtained before the first and second doses of RV1 and 1 month after the second dose. Maternal serum and breast milk samples were obtained prior to administration of each dose of RV1 to infants. RV-specific immunoglobulin G (IgG), IgA, and neutralizing activity in sera of infants and serum or breast milk samples of mothers were measured using enzyme-linked immunosorbent assays or a microneutralization test.
Results. Of the 107 serum pairs from infants who were seronegative for RV IgA at enrollment, we observed a strong positive association between IgG titers in pre-dose 1 sera of infants and mothers and significant negative associations between IgG titers in pre-dose 1 sera of infants and seroconversion to RV1 post-dose 1. Similarly, mothers whose infants’ IgA seroconverted after RV1 had significantly lower pre-dose 1 IgG titers in sera than those whose infants did not seroconvert.
Conclusions. High levels of preexisting serum IgG, including transplacentally acquired maternal IgG, appeared to have an inhibitory effect on the immunogenicity of RV1 among infants and may, in part, contribute to lower efficacy of RV vaccines in this and other low-income settings.
Rotavirus (RV) is the leading cause of severe gastroenteritis in young children and is responsible for 275 000–450 000 deaths, approximately 85% of which occur in low-income countries of Africa and Asia [1]. In South Africa, diarrhea accounts for approximately 18% of deaths among children aged <5 years [2], and RV infection is estimated to cause 17 644 to 25 630 hospitalizations annually among children aged <2 years [3]. Two live oral vaccines (Rotarix [RV1], GlaxoSmithKline Biologicals, and RotaTeq [RV5], Merck) are commercially available and recommended by the World Health Organization for all children worldwide and, to date, have been used for routine immunization programs in more than 60 countries [4]. Clinical trials of both vaccines showed that efficacy in middle- and high-income countries of North America, Europe, and Latin America ranged from 85% to 98% [5, 6]. However, the 2 vaccines are considerably less efficacious in low- to middle-income countries of Africa, Asia, and Latin America, with an efficacy ranging from approximately 40% to approximately 70% [7–11]. The reasons for this lower efficacy have not been fully explained but mimic the lower efficacy of other live oral vaccines such as oral polio vaccine (OPV) and typhoid and cholera vaccines in similar settings [8].
It has been reported that levels of RV immunoglobulin A (IgA), secretory IgA (sIgA), lactoferrin, and neutralizing activity in mothers’ breast milk vary by setting, with higher titers found among women in low-income countries compared with those in high-income countries [12–14]. These high levels of neutralizing activity in breast milk, together with maternal antibody transferred to the infant through the placenta, may have an inhibitory effect on the infectivity of live-attenuated vaccine viruses in the gut and thus the ability of vaccines to induce robust immune response among infants [7, 9, 11, 15]. To test this hypothesis, we recently investigated the effect of a transient delay of breastfeeding before and after the first and second vaccination with RV1 on the immune response among human immunodeficiency virus (HIV)–unexposed infants in Soweto, South Africa [16]. We found that infants with delayed and unrestricted breastfeeding had similar RV IgA response, suggesting that a transient delay of breastfeeding at the time of vaccination did not appear to improve the immune response to RV1. In the present study, we performed more detailed analyses to examine associations between maternal antibodies, particularly preexisting RV IgG, and the immunogenicity of 1 or 2 doses of RV1 among infants in South Africa. We also assessed the potential impact of IgA from natural infection prior to vaccination on subsequent immune response to RV1.
METHODS
Participants and Specimen Collection
A previously described mother–infant pair population from a prospective, randomized, longitudinal cohort study was used in this analysis [16]. These healthy HIV-unexposed infants were enrolled at presentation for their routine immunization visit at Diepkloof Primary Health Clinic, Soweto, South Africa, between 2 December 2009 and 9 April 2010. Infants who were aged 5–8 weeks at enrollment, breast fed, and did not receive any previous vaccines except for OPV and bacille Calmette-Guérin at birth were included in the study. Mothers who tested seronegative for HIV at beyond 24 weeks gestational age were also enrolled. Infants with known underlying immunosuppressive conditions and failure to thrive (<3rd percentile weight-for-age or decrease of more than 2 major centiles since birth) were excluded.
All vaccines were provided according to the standard schedule of the expanded program on immunization in South Africa. RV vaccine RV1 was administered at 6 and 14 weeks of age, concurrently with heptavalent pneumococcal conjugate vaccine (Prevenar; Wyeth, Madison, Wisconsin). All infants received trivalent OPV (Merieux, Sanofi Pasteur, Lyon, France) at 6 weeks and Pentaxim (diphtheria toxoid, tetanus toxoid, acellular pertussis adsorbed–inactivated poliovirus–Haemophilus influenzae type b conjugate vaccine [DTap-IPV-Hib]; Sanofi Pasteur) and Heberbiovac-HB (hepatitis B vaccine; Heber Biotec, Havana, Cuba) at 6, 10, and 14 weeks. Serum samples were obtained from the infants before the first and second doses of RV vaccine and 1 month after the second RV dose. Maternal serum and breast milk samples were obtained prior to administration of each dose of RV in their infants. All specimens were kept frozen at −70°C until shipment on dry ice for analysis at the US Centers for Disease Control and Prevention (CDC). The Human Research Ethics Committee (Medical) of the University of the Witwatersrand (M090824) reviewed and approved the protocol. Written informed consent was obtained from the parent or guardian on behalf of the infant. Because the CDC tested only anonymized specimens, this research did not require review by the CDC Institutional Review Board. The trial was registered on the South African National Clinical Trial Register (DOH-27-0511-2991).
Specimen Testing
RV-specific IgA in breast milk and serum samples was determined using enzyme-linked immunosorbent assay as previously described [12]. Briefly, microplate wells were coated with rabbit hyperimmune serum to rhesus rotavirus (RRV) and incubated with diluted RV1 strain or blotto (5% skim milk in phosphate-buffered saline [PBS]). After washing, breast milk samples (1:5–1:5120) and serum samples (1:10–1:10 240) that were serially diluted in diluent buffer (1% skim milk and 0.5% [v/v] of 10% polyoxyethylene ether W1 in PBS) were added to the wells, followed by biotin-conjugated goat anti-human IgA antibodies (KPL, Gaithersburg, Maryland). After incubation and washing, extravidin (Sigma, St. Louis, Missouri) was added to the wells and incubated, and then the reactions were developed with 3,3′,5,5′-tetramethylbenzidine (TMB; Sigma) and stopped with 1N hydrogen chloride. Optical density (OD) was determined at 450 nm with an enzyme immunoassay reader (MRX Revelation; Dynex Technologies, Chantilly, Virginia). IgA titers in breast milk and serum were calculated as the reciprocal of the highest dilution that gave a mean OD greater than the cutoff value (3 standard deviations above the mean OD of the negative-control serum wells). RV-specific IgG in serum samples was tested and analyzed in the same manner as IgA except that 0.5% normal rabbit serum was added to the biotin-conjugate solution.
RV-specific neutralizing activity in breast milk was measured using a microneutralization assay as previously described [12]. Briefly, breast milk samples (50 µL) in 2-fold dilutions were mixed with an equal volume of trypsin-activated RV1 vaccine virus to yield a concentration of 4000 FFU/well and incubated at 37°C for 1 hour. Monolayers of MA104 cells grown in 96-well plates were washed with PBS and incubated with diluted breast milk and virus mixture. Following incubation at 37°C for 1 hour, the plates were washed with PBS and incubated with 100 µL of Iscove's modified Dulbecco's medium (Invitrogen, Carlsbad, California) containing 5 μg/mL trypsin. After 20 hours of incubation at 37°C, the plates were fixed with 15 μL of 37% formaldehyde at 4°C for 30 minutes. RV antigen in MA104 cells was detected by incubating plates with a rabbit anti-RRV hyperimmune serum, horseradish peroxidase-labeled anti-rabbit IgG, and then TMB. Neutralizing titer in a breast milk specimen was determined as the reciprocal of the highest dilution that showed a >70% reduction in the absorbance value compared with that in virus-only controls.
Statistical Analyses
Data analyses were performed using SPSS Statistics, version 20 (IBM Corp., Armonk, New York). The Wilcoxon signed-rank test was used to compare titers within or between groups. Comparisons between categorical variables were done using the χ2 and relative risk tests. IgA titers ≥40 in serum were considered positive. Seroconversion was defined as greater than 4-fold increase in RV-specific IgA titers following the first or second RV vaccine doses compared with titers prior to the first dose.
Univariate linear regression analyses were performed to examine the relationships between infants' IgG and mothers' IgG pre-dose 1 in sera and between neutralizing activity and IgA pre-dose 1 and 2 in breast milk specimens. Log transformed (log2) titers of IgG, IgA, and neutralizing activity were used in the linear regression models. Linear regression models were assessed for violations of assumptions. Spearman rank correlations were used in univariate analyses to examine relationships between continuous variables when the assumptions of the regression model were not met. Univariate and multivariate logistic regression analyses were performed to examine the relationships between continuous variables and seroconversion post-dose 1 and 2. Finally, log2 titers of IgA, IgG, and neutralizing activity were used in the logistic regression models. An alpha level of 0.05 (P < .05) was considered significant for all tests.
RESULTS
We enrolled 250 infants with a median age of 6.1 weeks (range 6–8) at the time of their first RV1 immunization, given concomitantly with OPV and other scheduled pediatric vaccines [16]. Because some infants were not fully adherent to the protocol and were excluded from the study, or some specimens were not collected, we analyzed available matched serum and breast milk samples from 181 mother–infant pairs. RV IgA seroconversion rate at post-dose 1 was 35% (64/181) and increased significantly to 60% (108/181) at post-dose 2 (P < .001). Then, we generated 2 groups based on the status of IgA seroconversion, that is, infants who did or did not seroconvert at post-dose 1 or post-dose 2, and evaluated biological predictors of the IgA seroconversion (Table 1). Infant pre-dose 1 serum RV IgG titers were significantly higher in the group of infants who did not seroconvert than those of infants who seroconverted at post-dose 1 (P = .010). While seroconverted and nonseroconverted post-dose 1 infants had similar pre-dose 1 serum IgA titers, we found that infants who did not seroconvert at post-dose 2 were more likely to be IgA positive at pre-dose 1 than those who seroconverted (53% vs 32%, P = .005).
Comparison of Mother–Infant Pairs (n = 181) Assigned to Analysis of Rotavirus (RV) Antibodies in Sera and RV Antibodies and Neutralizing Activity in Breast Milk by Infant Immunoglobulin A Seroconversion Post-Dose 1 and Post-Dose 2 of Rotarix
| Subjects | Seroconversion Post-Dose 1 Status | Seroconversion Post-Dose 2 Status | |||||
|---|---|---|---|---|---|---|---|
| Total (N = 181) | Yes (n = 64) | No (n = 117) | P Valuea | Yes (n = 108) | No (n = 73) | P Valuea | |
| Infants | |||||||
| Percentage (95% CI), n/N | 35 (28–42), 64/181 | 60 (52–67), 108/181 | <.001b | ||||
| Age, in weeks, at dose 1 median (range) | 6 (6–8) | 6 (6–7) | 6 (6–8) | .233 | 6 (6–8) | 6.1 (6–7) | .799 |
| Age, in weeks, at dose 2 median (range) | 16 (12–24) | 16 (14–23) | 16 (12–20) | .981 | 16 (14–24) | 15 (12–19) | .006 |
| IgG pre-dose 1, median (range) | 1280 (20–20 480) | 1280 (20–10 240) | 1280 (80–20 480) | .010 | 1280 (20–10 240) | 1280 (80–20 480) | .072 |
| IgA pre-dose 1, Positivity, % (95% CI), n/N | 41 (34–48), 74/181 | 34 (22–46), 22/64 | 44 (35–54), 52/117 | .188 | 32 (23–41), 35/108 | 53 (42–65), 39/73 | .005 |
| IgA pre-dose 1, median (range) | 20 (1–1280) | 20 (1–320) | 20 (1–1280) | .151 | 20 (1–320) | 40 (1–1280) | .005 |
| IgA post-dose 1, median (range) | 40 (1–10 240) | 160 (40–10 240) | 40 (1–1280) | <.001 | 80 (1–10 240) | 40 (1–1280) | .001 |
| IgA post-dose 2, median (range) | 160 (1–20 480) | 320 (40–20 480) | 80 (1–5120) | <.001 | 320 (40–20 480) | 40 (1–640) | <.001 |
| Mothers | |||||||
| IgG sera pre-dose 1, median (range) | 10 240 (80–163, 840) | 5120 (80–81 920) | 10 240 (640–163 840) | .031 | 10 240 (80–163 840) | 10 240 (640–163 840) | .235 |
| IgA sera pre-dose 1, median (range) | 40 (1–10, 240) | 20 (1–5120) | 40 (1–10 240) | .053 | 40 (1–10 240) | 40 (1–5120) | .123 |
| IgA sera post-dose 1, median (range) | 160 (1–10 240) | 160 (1–10 240) | 160 (1–10 240) | .395 | 160 (1–10, 240) | 320 (1–10 240) | .331 |
| IgA BM, pre-dose 1, median (range) | 40 (1–2560) | 30 (1–1280) | 40 (1–2560) | .499 | 20 (1–1280) | 40 (1–2560) | .615 |
| IgA BM post-dose 1, median (range) | 40 (1–10 240) | 40 (1–2560) | 40 (1–10 240) | .520 | 40 (5–2560) | 40 (1–10, 240) | .781 |
| NA BM pre-dose 1, median (range) | 8 (1–2048) | 8 (1–2048) | 8 (1–2048) | .445 | 8 (1–2048) | 8 (1–2048) | .848 |
| NA BM post-dose 1, median (range) | 16 (1–2048) | 16 (1–2048) | 16 (1–2048) | .629 | 16 (1–2048) | 16 (1–2048) | .737 |
Serum and breast milk specimens from 181 infant–mother pairs were analyzed as described in the text. Seroconversion was defined as a ≥4-fold rise in IgA titer from baseline to post-dose 2. Seropositivity of IgA was defined as titer ≥1:40.
Significant P values are highlighted in bold (P < .05).
Abbreviations: BM, breast milk; CI, confidence interval; Ig, immunoglobulin; NA, neutralizing activity.
a Statistical difference was established by Wilcoxon rank-sum test.
b Statistical difference was established by χ2 test.
To examine whether maternal antibodies influenced immune response to RV1 in infants, we compared titers of IgG, IgA in serum, and IgA and neutralizing activity in breast milk specimens of mothers with infants who seroconverted or did not seroconvert (Table 1). Mothers whose infants seroconverted post-dose 1 had significantly lower titers of IgG (P = .031) and IgA (P = .053) in pre-dose 1 sera than those whose infants did not seroconvert, but these differences were not significant in mothers at post-dose 2. There were no differences observed for titers of post-dose 1 IgA in serum and pre-dose 1 and post-dose 1 IgA and neutralizing activity in breast milk. For mothers whose infants seroconverted or did not seroconvert post-dose 2, none of the IgG, IgA, and neutralizing activity titers in serum or breast milk specimens were significantly different.
We then performed a second analyses by excluding 74 infants who might have had an early neonatal RV infection, as evidenced by a pre-dose 1 RV IgA titer of ≥40 in serum (Table 2 and Figure 1). In this new subset of mother–infant pairs (n = 107), 39% of infants seroconverted post-dose 1 and 68% seroconverted post-dose 2. Infants who failed to seroconvert post-dose 1 had significantly higher pre-dose 1 RV IgG titers than those who seroconverted (P = .004). This trend continued until post-dose 2 (P = .051). Mothers whose infants seroconverted post-dose 1 had significantly lower median titers of IgG in pre-dose 1 sera than those whose infants did not seroconvert post-dose 1, but this difference was not seen post-dose 2. Similarly, infants who did not seroconvert and their mothers had higher cumulative IgG titers in pre-dose 1 sera than those who seroconverted at post-dose 1 (Figure 1). None of the titers for IgA or neutralizing activity in serum or breast milk specimens of mothers were significantly different regardless of seroconversion status post-dose 1 and post-dose 2 in infants.
Comparison of Mother and Rotavirus (RV)-Unexposed Infant Pairs (n = 107) Assigned to Analysis of RV Antibodies in Sera and RV Antibodies and Neutralizing Activity in Breast Milk, by Infant Immunoglobulin A Seroconversion Post-Dose 1 and Post-Dose 2 of Rotarix
| Subjects | Seroconversion 1 Status | Seroconversion 2 Status | |||||
|---|---|---|---|---|---|---|---|
| Total (N = 107) | Yes (n = 42) | No (n = 65) | P Valuea | Yes (n = 73) | No (n = 34) | P Valuea | |
| Infants | |||||||
| Percentage % (n/N) | 39 (42/107) | 68 (73/107) | <.001b | ||||
| Age, in weeks, at dose 1 median (range) | 6 (6–8) | 6 (6–7) | 6 (6–8) | .219 | 6 (6–8) | 6 (6–7) | .756 |
| Age, in weeks, at dose 2 median (range) | 16 (14–23) | 16 (14–23) | 16 (14–19) | .767 | 16 (14–23) | 15 (14–19) | .053 |
| IgG pre-dose 1, median (range) | 1280 (20–20 480) | 1280 (20–10 240) | 2560 (160–20 480) | .004 | 1280 (20–10 240) | 2560 (320–20 480) | .051 |
| IgA post-dose 1, median (range) | 40 (1–10 240) | 80 (40–10 240) | 20 (1–60) | <.001 | 40 (1–10 240) | 20 (1–60) | <.001 |
| IgA post dose 2, median (range) | 80 (1–20 480) | 160 (40–20 480) | 40 (1–2560) | <.001 | 160 (40–20 480) | 20 (1–40) | <.001 |
| Mother | |||||||
| IgG sera pre-dose 1, median (range) | 10 240 (80–163 840) | 5120 (80–81 920) | 10 240 (640–163 840) | .040 | 10 240 (80–163 840) | 20 480 (640–163 840) | .166 |
| IgA sera pre-dose 1, median (range) | 40 (1–5120) | 20 (1–5120) | 40 (1–5120) | .203 | 40 (1–5120) | 80 (1–2560) | .102 |
| IgA sera post-dose 1, median (range) | 160 (1–10 240) | 160 (1–10 240) | 160 (1–10 240) | .632 | 160 (1–10 240) | 320 (1–10 240) | .255 |
| IgA BM, pre-dose 1, median (range) | 40 (1–2560) | 40 (1–1280) | 40 (1–2560) | .420 | 40 (1–1280) | 40 (1–2560) | .534 |
| IgA BM post-dose 1, median (range) | 40 (5–10 240) | 40 (10–2560) | 40 (5–10 240) | .620 | 40 (5–2560) | 40 (5–10 240) | .801 |
| NA BM pre-dose 1, median (range) | 8 (1–2048) | 4 (1–2048) | 8 (1–2048) | .849 | 8 (1–2048) | 8 (1–2048) | .606 |
| NA BM post-dose 1, median (range) | 16 (1–2048) | 16 (1–2048) | 16 (1–2048) | .817 | 16 (1–2048) | 12 (1–2048) | .616 |
Serum and breast milk specimens from 107 infant–mother pairs were analyzed as described in the text. Seroconversion was defined as a ≥4-fold rise in IgA titer from baseline to post-dose 2. Seropositivity of IgA was defined as titer ≥1:40.
Significant P values are highlighted in bold (P < .05).
Abbreviations: BM, breast milk; Ig, immunoglobulin; NA, neutralizing activity.
a Statistical difference was established by Wilcoxon rank-sum test.
b Statistical difference was established by χ2 test.
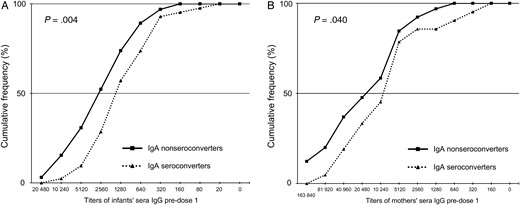
Cumulative frequency profiles of rotavirus immunoglobulin G (RV IgG) titers in pre-dose 1 sera of 107 RV-unexposed infants (A) and their mothers (B), by infant IgA seroconversion post-dose 1 of RV vaccine. Seroconversion was defined as a 4-fold increase in RV-specific IgA titers in post-dose 1 sera when compared with the corresponding preimmunization sera. Pre-dose 1 sera of infants and their mothers were tested for RV-specific IgG as described in the text.
We also performed univariate and multivariate analysis to identify variables that might influence IgA seroconversion (Table 3). The levels of pre-dose 1 IgG in infant sera were negatively associated with seroconversion post-dose 1 by both univariate and multivariate analyses and seroconversion post-dose 2 by univariate analysis. IgG titers in mothers’ sera were negatively associated with seroconversion post-dose 1 in the univariate analysis only. We also analyzed the relationship between the pre-dose 1 IgG titers in infants and IgA titers in response to RV1 at post-dose 1 and post-dose 2. We found a relatively strong negative association between preexisting IgG titers in pre-dose 1 sera and IgA titers in post-dose 1 sera (r = − 0.28, P = .003). Similarly, we found a weaker but significant negative association between preexisting IgG titers in pre-dose 1 sera and IgA titers in post-dose 2 sera (r = − 0.23, P = .016; data not shown).
Predictors for Serum Immunoglobulin A Seroconversion to Rotarix in Rotavirus-Unexposed Infants (n = 107), South Africa, 2009–2010
| Explanatory Variables | IgA Seroconversion Post-Dose 1 | IgA Seroconversion Post-Dose 2 | ||||||||||
|---|---|---|---|---|---|---|---|---|---|---|---|---|
| Univariate Analysis | Multivariate Analysis | Univariate Analysis | Multivariate Analysis | |||||||||
| Coefficient | OR (95% CI) | P Value | Coefficient | Adjusted OR (95% CI) | P Value | Coefficient | OR (95% CI) | P Value | Coefficient | Adjusted OR (95% CI) | P Value | |
| Infants | ||||||||||||
| IgG pre-dose 1 | −0.38 | 0.69 (.53–.88) | .004 | −0.30 | 0.74 (0.55–.99) | .044 | −0.28 | 0.76 (.59–.98) | .034 | −0.19 | 0.83 (0.63–1.08) | .166 |
| IgA post-dose 1 | 0.36 | 1.43 (1.19–1.71) | <.001 | 0.34 | 1.40 (1.17–1.68) | <.001 | ||||||
| Age at dose 1 | −1.0188 | 0.36 (.10–1.36) | .133 | 0.15 | 1.16 (.33–4.05) | .817 | ||||||
| Age at dose 2 | 0.1043 | 1.11 (.85–1.44) | .436 | 0.32 | 1.38 (.99–1.91) | .055 | ||||||
| Gender (male) | −0.16 | 0.85 (.39–1.86) | .686 | −0.14 | 0.87 (.39–1.97) | .741 | ||||||
| Weight at birth, kg | 0.26 | 1.29 (.56–2.98) | .547 | 0.41 | 1.51 (.63–3.60) | .357 | ||||||
| Mothers | ||||||||||||
| IgG sera pre-dose 1 | −0.23 | 0.80 (.66–.96) | .015 | −0.11 | 0.90 (.72–1.11) | .311 | −0.14 | 0.87 (.72–1.05) | .138 | |||
| IgA sera pre-dose 1 | −0.1 | 0.90 (.81–1.01) | .066 | −0.08 | 0.93 (.83–1.04) | .177 | ||||||
| IgA sera pre-dose 2 | −0.09 | 0.91 (.80–1.05) | .19 | |||||||||
| IgA BM, pre-dose 1 | −0.07 | 0.93 (.78–1.11) | .411 | −0.10 | 0.90 (.75–1.08) | .275 | ||||||
| IgA BM pre-dose 2 | 0.00 | 1.00 (.83–1.20) | .998 | |||||||||
| NA BM pre-dose 1 | −0.02 | 0.98 (.85–1.13) | .774 | 0.03 | 1.03 (.89–1.20) | .672 | ||||||
| NA BM pre-dose 2 | 0.04 | 1.04 (.90–1.20) | .559 | |||||||||
Log-2 transformed antirotavirus titers were used in the analysis as described in the text.
Significant P values are highlighted in bold (P < .05).
Abbreviations: BM, breast milk; CI, confidence interval; Ig, immunoglobulin; NA, neutralizing activity; OR, odds ratio.
We further observed a strong significant association between IgG titers in pre-dose 1 sera of paired infants and mothers using univariate regression analyses (r = 0.56, P < .001; Figure 2A). We also found a weak but significant correlation between IgA titers in breast milk and sera from mothers at pre-dose 1 (r = 0.27, P = .005; Figure 2B). In addition, we found significant positive associations between RV IgA and neutralizing activity in breast milk at pre-dose 1 (r = 0.41, P < .001) and post-dose 1 (r = .40, P < .001; data not shown).
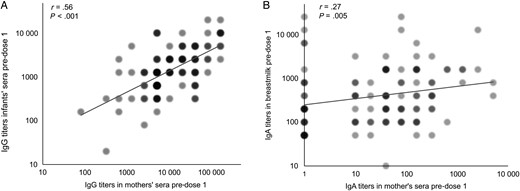
Association of rotavirus immunoglobulin G (RV IgG) titers in pre-dose 1 sera of 107 RV-unexposed infants and their mothers (A) and association of RV IgA titers in pre-dose 1 sera and breast milk from mothers (B). Log-transformed (log2) IgG titers in paired mother and infant sera were analyzed by univariate linear regression analysis. The log2 IgA titers were analyzed using Spearman correlation analysis. Regression models were assessed for violations of assumptions. Color intensity and circle size at each point were proportional to the number of samples.
DISCUSSION
In this cohort of mothers and their HIV-unexposed infants in Soweto, South Africa, we demonstrated a strong association between levels of IgG in sera of mother–infant pairs at the time of first RV immunization, suggesting direct transplacental transmission of this antibody from mothers to infants. Infants who failed to seroconvert to RV1 had significantly higher RV IgG titers in pre-dose 1 sera than those who seroconverted. The second dose of RV1 somewhat overcame the interference of preexisting RV IgG since levels of this antibody in infants with a median age of 16 weeks (range 12–24) had waned. These findings indicate that maternal IgG may have interfered with the immune response to RV1 in infants.
Maternal IgG is transported across the placenta by an active, receptor-mediated process during pregnancy, thereby protecting term infants against infection [17]. In newborns and young infants, RV IgG comes primarily from the mother in the first or second month of life, depending on settings. Since the median age of this infant cohort was 6.1 weeks at the first dose of vaccination, levels of RV IgG were expected to be high, as reported in Indian, Mexican, and Nicaraguan infants of similar age [18–20]. Our observations of high IgG levels in sera of these South African infants at age 6.1 weeks may explain higher seroconversion rates to RV1 when administered at a 3-dose (6, 10, and 14 weeks) or a 2-dose (10 and 14 weeks) schedule than at the 6- and 10-week schedule recommended by the manufacturer in the same setting [21]. Since transplacental RV IgG decreases with a half-life of 3–4 weeks, this 4-week delay in vaccine administration might explain the improved immunogenicity of the vaccine. Of note, since RV immunity is believed to be polygenic and cross-reactive, we think the preexisting serum IgG is a mixture of nonneutralizing RV antibody directed primarily against VP6 group antigen and, to a lesser degree, VP4 and VP7 serotype antigens. Thus, this inhibitory effect would apply for both RV1 and RV5 vaccines. Maternal antibody interference has also been reported in children who received polio and measles vaccines [22, 23].
We previously reported positive associations between levels of IgA and neutralizing activity against RV1, RV5, and 116E strains in breast milk of mothers in India and South Africa, but not in specimens from mothers in the United States [13]. In the present study, we again found significant correlations between RV IgA titers and neutralizing titers against RV1 strain in breast milk collected at the time of the first and second RV vaccinations from South African mothers. We also observed a significant association between IgA titers in pre-dose 1 sera and breast milk from mothers, suggesting some transmission of IgA between systemic and mucosal systems [24]. This association could also be explained by dual natural infection with RV in both mother and infant. Additionally, a correlation between IgA in sera and sIgA in breast milk has been reported [14, 25]. Of note, we observed similar levels of IgA and neutralizing activity in breast milk of mothers whose infants seroconverted or did not seroconvert, supporting the recent report of no effect from a short abstention of breastfeeding before and after each vaccination on immune response to RV1 in South African infants. However, we could not evaluate the effect of long-term breastfeeding on vaccine immunogenicity since all infants were breastfed. Long-term breastfeeding practices have been reported to be associated with lower immune response to RV1 or RV5 among infants in both high- and low-income countries [26–28].
The apparent inhibitory effect of maternal antibody could represent one of the complicated mechanisms to explain why live oral RV vaccines have been less immunogenic and effective in low-income settings such as Africa [11, 15] where infants typically acquire high titer RV IgG transplacentally from their mothers. In addition, preexisting serum IgA appeared to have some damping effect on vaccine immunogenicity as well. Future studies should investigate other potential confounders such as malnutrition, coinfections, comorbidities, and gut microbiota. Given that multiple factors are likely involved in gut enteropathy and reduced efficacy of oral vaccines and that intervention strategies to date have not shown any major improvements, alternative approaches, such as parenteral immunization with inactivated RV or subunit vaccine, should be assessed.
Notes
Disclaimer. The finding and conclusions in this report are those of the authors and do not necessarily represent the official positions of Centers for Disease Control and Prevention (CDC).
Financial support. The clinical aspect of this study was funded through core funding from the South African Medical Research Council (Respiratory and Meningeal Pathogens Research Unit) and Department of Science and Technology/National Research Foundation South African Research Chair Initiative on Vaccine Preventable Diseases. The funders had no role in the conduct of the study or in the write-up of the manuscript. The immunology work was funded by the CDC.
Potential conflicts of interest. All authors: No reported conflicts. All authors have submitted the ICMJE Form for Disclosure of Potential Conflicts of Interest. Conflicts that the editors consider relevant to the content of the manuscript have been disclosed.

