


Abstract
Background There are frequent reports of intensive care unit (ICU) outbreaks due to transmission of particular antibiotic-resistant bacteria. Less is known about the burden of outbreaks of resistance due to horizontal transfer of mobile genetic elements between species. Moreover, the potential of existing statistical software as a preliminary means for detecting such events has never been assessed. This study uses a software package to determine the burden of species and resistance outbreaks in 2 adjacent ICUs and to look for evidence of clustering of resistance outbreaks consistent with interspecies transmission of resistance elements.
Methods A retrospective analysis of data from 2 adjacent 15-bed adult ICUs between 2002 and 2009 was undertaken. Detection of bacterial species-groups and resistance outbreaks was conducted using SaTScan and WHONet-SaTScan software. Resampling and permutation methods were applied to investigate temporal clustering of outbreaks.
Results Outbreaks occurred for 69% of bacterial species-groups (18/26), and resistance outbreaks were detected against 63% of antibiotics (10/16). Resistance outbreaks against 7 of 10 antibiotics were observed in multiple species-groups simultaneously and there was evidence of inter–species-group dependence for 4 of 7 antibiotics; background temporal changes in resistance did not explain the temporal aggregation of outbreaks in 3 of 7 antibiotics.
Conclusions Species outbreaks occurred for the majority of bacteria commonly identified in the ICU. There was evidence for frequent temporal clustering of resistance outbreaks consistent with interspecies transmission of resistance elements. Wider application of outbreak detection software combined with targeted sequencing of bacterial genomes is needed to understand the contribution of interspecies gene transfer to resistance emergence.
The occurrence of antimicrobial resistance on the intensive care unit (ICU) is an emerging global concern, particularly with regard to gram-negative bacteria [1–3]. Resistance in the ICU may emerge and be maintained through several mechanisms including importation of resistant strains [4], person-to-person clonal transmission [5], endogenous development of new resistance [6], acquisition of resistant organisms from an environmental reservoir [7], and horizontal transfer of mobile genetic elements within and between species [8].
Outbreaks of resistant bacteria (ie, spatial and temporal grouping of cases above what might be expected due purely to chance) are of particular concern in the ICU and there have been numerous reports described in the literature [9]; however, the majority of reports concern single outbreaks with a single bacterial species, making it difficult to draw general conclusions on the underlying risk factors and dissemination routes for nosocomial outbreaks [10, 11]. Particularly, it is unclear to what extent outbreaks of resistance can be ascribed to horizontal gene transfer relative to other possible mechanisms of resistance spread. Quantifying the relative importance of these mechanisms would help target infection control and antimicrobial stewardship strategies.
Over the past 10 years, our institutional infection control committee has dealt with 3 recognized outbreaks on the ICU involving Acinetobacter species in 2002–2003, Enterobacter species in 2002, and methicillin-resistant Staphylococcus aureus (MRSA) in 2002–2004 [12]. In response to the MRSA outbreak, a heightened infection control program was initiated in July 2003 that included antiseptic body washing for all patients from April 2004 onward [13].
The objectives of this study are to describe the overall burden of outbreaks of bacterial species and antimicrobial resistance on the ICU and to investigate whether there is evidence for temporal clustering of resistance across multiple bacterial species. The identification of simultaneous resistance outbreaks across different bacterial species may suggest cross-species horizontal gene transfer as a mechanism of resistance emergence in the ICU.
METHODS
Study Population
This retrospective study was conducted at Guy's and St Thomas’ NHS Foundation Trust, a 1050-bed teaching hospital in London, United Kingdom, with research ethics committee approval. An anonymized database containing clinical, demographic, microbiological, and daily antimicrobial treatment was created containing data on all patients admitted to 2 adjacent 15-bed general ICUs between 1 January 2002 and 31 December 2009.
Antimicrobial policies in place throughout the study period recommended a 5-day course of vancomycin for empiric treatment of suspected hospital-acquired gram-positive infection and a 5-day course of gentamicin or ceftazidime as first-line empiric treatment of suspected gram-negative infection, with other agents used in presence of resistance or as second-line agents. For a 6-month period in 2002, gentamicin was replaced with amikacin in response to an outbreak of Acinetobacter species.
Infection control measures consisted of daily infection control visits, use of alcohol-gel dispensers, use of gloves and gowns for patient examination and admission, and weekly surveillance screening for carriage of MRSA and gentamicin-resistant gram-negative bacteria. A heightened infection control campaign commenced in July 2003 in response to high rates of MRSA infection. It began with a focus on education and audit of hand hygiene and use of contact precautions. Cohorting of MRSA colonized patients was introduced in November 2003 followed by a daily antiseptic protocol for all patients in April 2004 [13].
All S. aureus, streptococci, and enterococci and all gram-negative bacteria present as pure or dominant growth in patient specimens were identified and had antimicrobial susceptibility determined. Commensal flora, obligate anaerobic bacteria, fungi, mycobacteria, and bacteria identified in MRSA and gentamicin-resistance screens were not included.
Until August 2006, susceptibility patterns were determined using agar disk diffusion for all pathogens. Thereafter, the VITEK system (bioMérieux, Marcy-l'Etoile, France) was used for susceptibility testing of S. aureus, Enterobacteriaceae, and nonfermentative gram-negative bacilli. Susceptibility testing was performed according to the British Society of Antimicrobial Chemotherapy standards.
Patient-days in both ICUs were calculated from the hospital's admission and discharge data. If a patient had a microbiology sample taken in the ICU but no ICU admission had been recorded, the day of sampling was counted as 1 patient day.
Cluster Detection
SaTScan was used for detection of outbreaks of bacterial species (http://www.satscan.org). Bacteria were classified into groups based on species (eg, S. aureus), groups of species (eg, coagulase-negative staphylococci [CoNS]), or genus (eg, Pseudomonas species; see Supplementary Table 1 for details). These groupings are referred to as species-groups hereafter. The CoNS group was excluded from cluster detection analyses due to its vast biological heterogeneity. To look for temporal windows with increased incidence of infections, a purely temporal scan statistic using a Poisson-based model was used [14–17]. Separate analyses were conducted for each species-group in each ICU. Cluster detection was based on the first patient isolate of each species-group over the 8-year period. Analyses were conducted for all species-groups with >5 unique patient isolates in at least 1 ICU; this resulted in analysis of 26 species-groups (Table 1). Isolates with the target species-group were defined as cases, and the number of patients at risk of infection as the population at risk. Analyses were implemented using daily time units, a significance level of .05, and a maximum temporal cluster size of 4 years. Hypothesis testing was conducted through Monte Carlo simulations. Outbreak detection was performed with log-linear temporal adjustment. In this adjustment, SaTScan estimates from the data the percentage of yearly increase or decrease in the rate that is to be adjusted for before testing for clusters. Analysis of resistance outbreaks was conducted with WHONet from the WHO Collaborating Centre for Surveillance of Antimicrobial Resistance (http://www.who.int/drugresistance/whonetsoftware), which incorporates the SaTScan space-time permutation scan statistic [18]. This model was applied to 8-year retrospective data to look for clusters of resistance to the 16 most frequently prescribed antibiotics (Table 1), which represented 87% (62 004/71 291) of all antibiotic therapy days. To adjust for purely spatial and purely temporal variation, the space-time permutation model requires case data and, respectively, the spatial location and time for each case. Nonparametric locations (eg, ward name) may be defined as “space” in WhoNet-SatScan. It is also possible to define nonspatial variables (eg, resistance profile) as the “location.” This allows the detection of temporal clusters in these variables (eg, periods with a higher than expected frequency of a certain resistance profile) while adjusting for temporal changes in the relevant denominator (eg, total resistant and sensitive isolates). Analyses were conducted for each ICU and for each combination of species-group (n = 26) and antibiotic (n = 16) separately. To test for outbreaks of resistance to 1 antibiotic in a given species-group, profile = sensitive and profile = resistant were taken to represent 2 separate locations. Cases were the species-group isolates detected at each location at each time unit. A resistance outbreak was defined as the occurrence of cases in the resistant location (ie, resistant isolates) in excess of what would be expected given the total number of cases seen (whether resistant or sensitive). Only patients’ first isolates of each species-group with antimicrobial sensitivity testing results were included in the analyses. Species-antibiotic combinations tested <8 times per unit and naturally occurring resistance phenotypes (eg, vancomycin resistance among gram-negative bacteria) were not analyzed. To assess consistency, analyses were repeated in SaTScan with a scan statistic based on purely temporal retrospective Bernoulli modeling of case-control data [19, 20], where resistant and sensitive unique patient isolates were specified as cases and controls, respectively. Analyses were implemented as described for purely temporal Poisson analysis of species-groups clusters, with the maximum cluster length defined as 50% of the study period. Isolates of intermediate resistance were treated as resistant. Clusters of events defined by the scan statistics are referred to as outbreaks hereafter.
Overview of Bacterial Species-Groups and Antimicrobial Agents Included in the Outbreak Analysis
| Species-Group | Antimicrobial Agent |
|---|---|
| Acinetobacter spp | Amikacin |
| Bacillus spp | Amoxicillin |
| Chryseobacterium spp | Co-amoxiclav |
| Citrobacter spp | Ceftazidime |
| Corynebacterium spp | Cefuroxime |
| Enterobacter spp | Ciprofloxacin |
| Enterococcus spp | Clindamycin |
| Escherichia spp | Colistin |
| Group A hemolytic Streptococcus spp | Erythromycin |
| Group B hemolytic Streptococcus spp | Gentamicin |
| Group D hemolytic Streptococcus spp | Imipenem/meropenema |
| Group G hemolytic Streptococcus spp | Methicillinb |
| Haemophilus spp | Penicillin |
| Hafnia spp | Piperacillin/tazobactam |
| Klebsiella spp | Tobramycin |
| Moraxella spp | Vancomycin |
| Morganella spp | |
| Neisseria spp | |
| Proteus spp | |
| Pseudomonas spp | |
| Staphylococcus aureus | |
| Streptococcus milleri group | |
| Streptococcus pneumoniae | |
| Streptococcus viridans | |
| Serratia spp | |
| Stenotrophomonas spp |
a Imipenem was used for susceptibility testing, and meropenem was used for antimicrobial treatment.
b Methicillin was used for susceptibility testing only.
Resampling and permutation methods of outbreak start dates accounting for outbreak duration over 100 000 iterations were performed to investigate temporal clustering of outbreaks. We defined 2 statistics to measure the extent to which outbreaks coincided: first, the sum of days between all possible pairs of outbreak start dates; second, the percentage of study period days on which outbreaks overlapped. Resampling was used to test the null hypotheses that the probability of bacterial outbreaks and the probability of resistance outbreaks did not change with the day of the study. A permutation test was then used to see if there was evidence to reject the null hypothesis that, for any given antibiotic, temporal aggregation of resistance clusters in multiple species-groups could be explained by underlying temporal variation in resistance. Rejecting this hypothesis would provide evidence that resistance outbreaks did not occur independently in different species-groups. Analyses were conducted in R version 2.13.2 [21]. See Supplementary Material for a detailed description of these methods.
To examine antimicrobial use, the number of patient-days of antibiotic use in each ICU separately was calculated for 16 antimicrobial agents. To account for the high transit of patients between the ICUs (15.5%; n = 1224), outbreak numbers and temporal aggregation of clusters are presented for the ICUs separately and combined.
RESULTS
A total of 89 856 patient-days were recorded (44 878 in ICU-1 and 44 978 in ICU-2), corresponding to an average of 15 patients per ICU per day. Of 184 720 samples retrieved from ICU patients and processed, 37 117 were culture-positive for a specific bacteria. Of these, 32 479 were clinical samples. Numbers of samples were comparable between ICU-1 (16 725) and ICU-2 (15 754). The most prevalent species-groups were CoNS (18.3%, n = 5933), Pseudomonas species (17.8%, n = 5778), and S. aureus (12.4%, n = 4021). Isolates were recovered from respiratory tract samples (36.2%); drain and catheter tips (20.2%); skin and wound swabs (13.9%); blood cultures (13.1%); urinary samples (6.3%); pus, drain fluids, and biopsy tissues (5.1%); and other specimens (5.4%).
Outbreaks of Bacterial Species
In total, 9428 unique patient-species isolates were included in the analysis. Figure 1 shows the presence and duration of species-group outbreaks in relation to the incidence of each species-group in each ICU. After application of log-linear temporal adjustment, outbreaks were detected for 58% (15/26) of species-groups in ICU-1 and 35% (9/26) in ICU-2 (Figure 1, Table 2). Outbreak size ranged from 2 cases over 1 calendar day to 243 cases over 1.4 years. Overall, outbreaks were detected for 69% of species-groups (18/26). Three species-group outbreaks occurred in both ICUs simultaneously. Outbreaks consisting of at least 5 cases occurred in 38% of species-groups (10/26). There was no evidence of temporal clustering of species-group outbreaks during the study period after temporal adjustment for incidence trends (Table 3). In contrast, outbreaks detected before application of temporal adjustments were significantly aggregated within the first 4 years of the study period as measured by the overlap days statistic (ICU-1, P = .03; ICU-2, P = .03; combined ICUs, P = .003).
Overview of Outbreaks of Species-Groups in Both Intensive Care Units After Log-Linear Adjustment for Underlying Temporal Trends
| Species-Groups | Outbreaka | Number | P Value | ||
|---|---|---|---|---|---|
| Start | End | Observed | Expected | ||
| ICU-1 | |||||
| Acinetobacter spp | 04/10/02 | 13/02/03 | 40 | 13.85 | .001 |
| Chryseobacterium spp | 09/01/04 | 05/08/07 | 42 | 21.81 | .001 |
| Citrobacter spp | 05/08/07 | 16/08/07 | 7 | 0.37 | .001 |
| Corynebacterium spp | 06/02/09 | 08/02/09 | 3 | 0.034 | .024 |
| Enterobacter spp | 01/08/02 | 16/08/02 | 12 | 2.31 | .033 |
| Enterococcus spp | 20/08/02 | 16/09/02 | 23 | 6.2 | .001 |
| Escherichia spp | 02/09/08 | 12/09/08 | 9 | 1.04 | .016 |
| GAS | 13/05/05 | 14/05/05 | 2 | 0.0056 | .024 |
| GDS | 16/07/06 | 17/07/06 | 2 | 0.0063 | .042 |
| Klebsiella spp | 15/09/04 | 04/11/04 | 24 | 6.94 | .003 |
| Proteus spp | 01/05/08 | 02/05/08 | 4 | 0.071 | .009 |
| Pseudomonas spp | 01/06/04 | 11/11/05 | 243 | 150.63 | .001 |
| Staphylococcus aureus | 26/10/06 | 26/10/06 | 5 | 0.2 | .018 |
| Streptococcus milleri group | 02/04/06 | 06/04/06 | 3 | 0.042 | .025 |
| Streptococcus pneumoniae | 01/04/02 | 12/04/02 | 6 | 0.49 | .048 |
| ICU-2 | |||||
| Acinetobacter spp | 16/10/02 | 13/02/03 | 30 | 10.12 | .002 |
| Enterobacter spp | 01/09/06 | 17/09/06 | 12 | 1.29 | .002 |
| Enterococcus spp | 11/11/07 | 02/02/08 | 29 | 10.75 | .032 |
| GGS | 04/05/05 | 04/05/05 | 2 | 0.0042 | .022 |
| Hafnia spp | 16/09/06 | 16/09/06 | 2 | 0.0032 | .012 |
| Klebsiella spp | 01/05/04 | 04/10/05 | 121 | 75.42 | .002 |
| Pseudomonas spp | 02/11/04 | 11/11/04 | 13 | 1.82 | .001 |
| S. aureus | 20/10/02 | 22/08/04 | 235 | 177.05 | .008 |
| Streptococcus viridans | 16/09/04 | 24/09/04 | 4 | 0.11 | .02 |
Abbreviations: GAS, group A hemolytic Streptococcus species; GDS, group D hemolytic Streptococcus species; GGS, group G hemolytic Streptococcus species; ICU, intensive care unit.
a Outbreak data are shown as day/month/year.
Results of Resampling and Permutation Analyses of Outbreaks of Species-Groups and Resistance
| Location | No.of Outbreaks | P Value for Test Statistics | ||||
|---|---|---|---|---|---|---|
| Resampling | Permutation | |||||
| Start Dates | Overlap Days | Start Dates | Overlap Days | |||
| Species-Groups | ||||||
| ICU-1 | All | 15 | .379 | .178 | … | … |
| ICU-2 | All | 9 | .885 | .257 | … | … |
| Combined | All | 21 (18 species) | .666 | .116 | … | … |
| Antibiotic resistance | ||||||
| ICU-1 | Amikacin | 3 | .432 | .513 | .638 | .380 |
| Amoxicillin | 1 | … | … | … | … | |
| Ceftazidime | 2 | .324 | 1.000 | .350 | .112 | |
| Cefuroxime | 2 | .664 | 1.000 | .764 | .237 | |
| Ciprofloxacin | 3 | .090 | .075 | .163 | .074 | |
| Co-amoxiclav | 3 | .966 | 1.000 | .959 | .373 | |
| Gentamicin | 4 | .119 | .434 | .253 | .368 | |
| Imipenem | 3 | .288 | .154 | .698 | .397 | |
| Piperacillin/tazobactam | 3 | .023* | .098 | .028* | .014* | |
| Tobramycin | 0 | … | … | … | … | |
| ICU-2 | Amikacin | 2 | .467 | 1.000 | .553 | .342 |
| Amoxicillin | 0 | … | … | … | … | |
| Ceftazidime | 2 | .122 | .183 | .208 | .212 | |
| Cefuroxime | 1 | … | … | … | … | |
| Ciprofloxacin | 1 | … | … | … | … | |
| Co-amoxiclav | 2 | .101 | .076 | .149 | .153 | |
| Gentamicin | 3 | <.005* | .069 | .014* | .313 | |
| Imipenem | 1 | … | … | … | … | |
| Piperacillin/tazobactam | 2 | .122 | .255 | .210 | .209 | |
| Tobramycin | 1 | … | … | … | … | |
| Combined | Amikacin | 4 | .248 | .620 | .718 | .714 |
| Amoxicillin | 1 | … | … | … | … | |
| Ceftazidime | 4 (3 species) | .072 | .043* | .296 | .085 | |
| Cefuroxime | 2 | .673 | 1.000 | .794 | .274 | |
| Ciprofloxacin | 4 | .029* | .078 | .085 | .028* | |
| Co-amoxiclav | 4 | .874 | .482 | .953 | .451 | |
| Gentamicin | 6 (5 species) | .032* | .033* | .148 | .033* | |
| Imipenem | 3 | .284 | .154 | .581 | .305 | |
| Piperacillin/tazobactam | 5 (4 species) | .001* | .012* | .005* | .001* | |
| Tobramycin | 1 | … | … | … | … | |
P values reflect the proportion of resampling or permutation iterations with fewer days between outbreak start dates, and with greater percentage of days with overlapping outbreaks than observed from the data. Outbreaks of resistance were observed in multiple species-groups in 8 of 10 antibiotics and were detected in several species-groups simultaneously in 7 of 10 antibiotics with resistance outbreaks.
A total of 84 resampling and permutation tests were carried out. P < .05 was noted for 18% of these tests (15/84). If the null hypothesis were in all cases true, only 4 (5%) of these tests would have been expected to show effects significant at the P = .05 level.
Abbreviation: ICU, intensive care unit.
*P < .05.
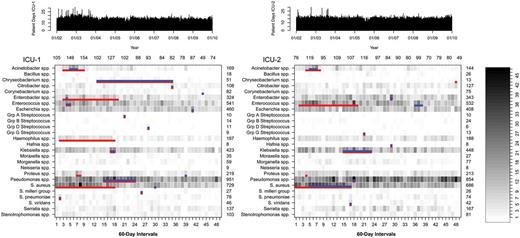
Incidence of identification of species-groups from patient clinical samples in 2 adjacent intensive care units (ICUs). Detected outbreaks after temporal adjustment for underlying temporal trends are depicted in blue. Red lines show outbreaks that would have been detected if no temporal adjustment had been applied. The number of patient-days for each ICU is shown at top.
Outbreaks of Antimicrobial Resistance
Selection of the first bacterial species per patient with antibiotic susceptibility results identified 8091 isolates. Twenty-four outbreaks of resistance were detected in ICU-1 and 15 in ICU-2 (Figure 2, Table 4). Outbreak size ranged from 2 cases over 6 calendar days to 71 cases over 1.2 years. Results were consistent with SaTScan cluster detection using the Bernoulli probability model.
Outbreaks of Resistance in Both Intensive Care Units After Application of Spatial-Temporal Adjustments
| Resistance | Outbreaka | No. | P Value | ||
|---|---|---|---|---|---|
| Start | End | Observed | Expected | ||
| ICU-1 | |||||
| Amikacin | |||||
| Acinetobacter spp | 08/08/03 | 09/11/05 | 40 | 21.54 | .001 |
| Serratia spp | 27/03/07 | 23/06/07 | 3 | 0.22 | .04 |
| Klebsiella spp | 02/11/05 | 05/03/06 | 7 | 0.97 | .01 |
| Amoxicillin | |||||
| Enterococcus spp | 01/08/09 | 11/12/09 | 11 | 3.19 | .01 |
| Ceftazidime | |||||
| Klebsiella spp | 01/11/05 | 10/02/06 | 15 | 4.94 | .003 |
| Pseudomonas spp | 05/04/07 | 04/06/07 | 7 | 1.06 | .01 |
| Cefuroxime | |||||
| Haemophilus spp | 24/06/02 | 19/09/02 | 8 | 1.65 | .01 |
| Klebsiella spp | 01/11/05 | 26/04/07 | 38 | 21.32 | .001 |
| Ciprofloxacin | |||||
| Enterobacter spp | 07/05/04 | 06/07/04 | 10 | 1.84 | .001 |
| Klebsiella spp | 01/11/05 | 22/01/06 | 10 | 3.13 | .04 |
| Pseudomonas spp | 08/05/04 | 01/10/04 | 28 | 12.81 | .002 |
| Co-amoxiclav | |||||
| Enterococcus spp | 01/08/09 | 11/12/09 | 11 | 3.02 | .007 |
| Escherichia spp | 10/09/03 | 30/05/04 | 18 | 7.68 | .04 |
| Haemophilus spp | 24/06/02 | 20/08/02 | 6 | 1.03 | .02 |
| Gentamicin | |||||
| Enterobacter spp | 07/05/04 | 06/07/04 | 10 | 1.97 | .001 |
| Klebsiella spp | 01/11/05 | 10/02/06 | 12 | 3.43 | .004 |
| Pseudomonas spp | 16/05/04 | 01/10/04 | 26 | 12.26 | .01 |
| Staphylococcus aureus | 03/11/02 | 21/01/04 | 71 | 39.19 | .001 |
| Imipenem | |||||
| Acinetobacter spp | 03/06/04 | 08/05/08 | 49 | 22.12 | .001 |
| Enterobacter spp | 30/08/06 | 05/09/06 | 2 | 0.03 | .04 |
| Pseudomonas spp | 05/04/07 | 05/06/07 | 8 | 1.47 | .01 |
| Piperacillin/tazobactam | |||||
| Escherichia spp | 26/04/05 | 01/11/05 | 11 | 3.40 | .04 |
| Klebsiella spp | 01/11/05 | 12/01/06 | 9 | 2.74 | .04 |
| Morganella spp | 09/02/05 | 13/06/08 | 19 | 10.37 | .001 |
| ICU-2 | |||||
| Amikacin | |||||
| Acinetobacter spp | 18/10/04 | 15/12/05 | 22 | 10.18 | .001 |
| Enterobacter spp | 11/12/06 | 12/04/07 | 4 | 0.27 | .01 |
| Ceftazidime | |||||
| Citrobacter spp | 29/11/04 | 16/11/06 | 29 | 19.03 | .03 |
| Klebsiella spp | 01/06/05 | 03/09/05 | 13 | 4.46 | .02 |
| Cefuroxime | |||||
| Haemophilus spp | 26/05/02 | 10/11/02 | 6 | 1.04 | .02 |
| Ciprofloxacin | |||||
| Proteus spp | 03/05/05 | 28/05/05 | 3 | 0.10 | .007 |
| Co-amoxiclav | |||||
| Haemophilus spp | 26/05/02 | 10/11/02 | 6 | 1.04 | .02 |
| Klebsiella spp | 27/10/02 | 22/01/03 | 12 | 3.67 | .01 |
| Gentamicin | |||||
| Klebsiella spp | 27/10/02 | 22/01/03 | 11 | 3.32 | .03 |
| S. aureus | 05/02/03 | 12/02/04 | 66 | 31.99 | .001 |
| Serratia spp | 05/03/03 | 30/08/03 | 5 | 0.51 | .002 |
| Imipenem | |||||
| Acinetobacter spp | 18/10/04 | 03/09/07 | 29 | 11.05 | .001 |
| Piperacillin/tazobactam | |||||
| Citrobacter spp | 29/11/04 | 29/06/07 | 28 | 18.14 | .04 |
| Klebsiella spp | 01/06/05 | 22/07/05 | 10 | 2.54 | .005 |
| Tobramycin | |||||
| Klebsiella spp | 28/09/08 | 04/02/09 | 6 | 1.57 | .03 |
Abbreviation: ICU, intensive care unit.
a Outbreak data are shown as day/month/year.
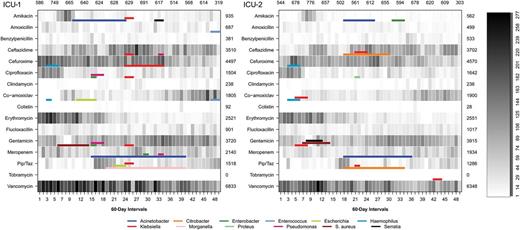
Number of patient-days of antibiotic therapy in 2 adjacent intensive care units for different antimicrobial agents. Colored bars represent detected outbreaks of antibiotic resistance. Abbreviation: ICU, intensive care unit; Pip/Taz, piperacillin/tazobactam.
For the 2 ICUs combined, 180 combinations of species-group and antibiotic were analyzed. Outbreaks of resistance were detected for 17% of these combinations (31/180) and were identified in 1 or more species-groups for 63% of antibiotics (10/16). In 87% of resistance outbreaks (34/39) no concomitant increase in species-group incidence was observed, whereas 13% of resistance outbreaks (5/39) coincided with an outbreak of the species-group (Supplementary Figure 1).
Outbreaks of resistance occurred in multiple species-groups simultaneously for 44% of assessed antibiotics (7/16). The hypothesis that single-species-group resistance outbreaks occurred independently could be rejected in 4 of 16 antibiotics according to at least 1 of the 2 test statistics (Table 3). Outbreaks of resistance to ceftazidime, ciprofloxacin, gentamicin, and piperacillin/tazobactam transcending multiple species-groups simultaneously were unlikely to be independent (Table 3) and, for ciprofloxacin, gentamicin and piperacillin/tazobactam, inter–species-group dependence could not be explained by background temporal changes in the occurrence of resistance clusters (Table 3).
Patient days of antibiotic use for 16 antibiotic agents in relation to the occurrence of resistance outbreaks is shown in Figure 2. There was an increase in days of therapy with ceftazidime, co-amoxiclav, gentamicin, and piperacillin/tazobactam and a decrease in cefuroxime, ciprofloxacin, erythromycin, and vancomycin during the study. Start dates of resistance outbreaks did not consistently follow an increase in patient days of antibiotic therapy (Figure 2).
DISCUSSION
To our knowledge, this is the first ICU study to assess the simultaneous occurrence of outbreaks of all common bacterial species and of resistance to all commonly used antibiotics over an extended period. Outbreaks of increased incidence were detected within 69% of species-groups (18/26) whereas resistance outbreaks occurred for 63% of antibiotics (10/16).
It is difficult to determine the incidence of outbreaks on ICUs because standard outbreak detection methods rely heavily on simple rule-based criteria and typically focus on only a few organisms [22, 23]. Previous application of WHONet-SaTScan software has identified both known and otherwise unrecognized outbreaks [24]. During this study period, only 3 outbreaks had been recognized at the time (S. aureus, Enterobacter, and Acinetobacter species). Most of the additional species-group outbreaks detected in the analyses presumably reflect hospital or ICU transmission, but some outbreaks, such as those with streptococci and Haemophilus influenzae, may reflect both hospital and community transmission. The initiation and self-termination of many outbreaks could reflect only transient presence of events necessary for heightened transmission but are also consistent with stochastic epidemic fadeout. It is unclear why some outbreaks reached clinical awareness and prompted targeted interventions and, given that numerous outbreaks did self-terminate, to what extent such interventions influenced the time to outbreak termination.
This study also provides further evidence that resistance outbreaks go unnoticed particularly when multiple species are involved or there is no corresponding rise in species incidence [25]. Resistance outbreaks occurred in multiple species-groups concomitantly, and the majority (87%; 34/39) were due to an increased proportion of resistant strains and not to a concomitant increase in incidence of that particular species-group.
A preliminary analysis showed aggregation of species-group outbreaks within the first 4 years of the study, which disappeared with adjustment for underlying temporal trends. This trend for reduced incidence of identification of bacteria at clinical sites could be linked to the introduction of daily antiseptic washes for all patients in April 2004 [12, 13], which was also followed by a reduction in detection of CoNS at clinical sites. Chlorhexidine washes have been associated with a reduction in colonization and infection with antibiotic-resistant bacteria [26, 27]; however, there was also a hand-hygiene campaign on the ICU during this period that may also have reduced nosocomial transmission [28–30]. Consequently, the explanation for a temporal reduction in bacterial identification at clinical sites is likely to be multifactorial.
There was no equivalent temporal effect on incidence of resistance outbreaks, suggesting that the infection control campaign was less effective at preventing these. Such observation would be consistent with antibiotic use and/or horizontal gene transmission being the predominant factors promoting emergence of resistance outbreaks.
For 70% (7/10) of antibiotics with resistance outbreaks, these occurred in multiple species-groups simultaneously and, in the majority of cases (4/7), outbreaks were not found to occur independently across the several species-groups. Temporal aggregation and nonindependence of resistance outbreaks could not be explained by underlying trends in resistance in 3 of 7 antibiotics. The use of sophisticated outbreak detection software to analyze a wide range of species-groups and resistance profile combinations showed frequent resistance outbreaks with a distribution pattern consistent with interspecies transmission of resistance elements. It seems less plausible that such a pattern could be explained solely by simultaneous importation of resistant strains, person-to-person transmission, or environmental acquisition without inter–species-group genetic exchange.
There is considerable evidence that antimicrobial use influences within-species resistance trends in ICUs [31–33], and it is therefore possible that antibiotic pressure may have resulted in simultaneous outbreaks across multiple species through endogenous development of new resistance and through selection of resistant organisms from patient flora. However, based on visual inspection of the data, there was no obvious relationship between patient-days of antibiotic therapy and start dates of resistance outbreaks in our study.
Little emphasis has previously been placed on investigating between-species clustering of resistance. Yet, there is a large reservoir of mobile elements carrying resistance genes, and horizontal transfer of genetic elements has been recognized as an important mechanism of resistance spread, especially among ICU patients [34, 35]. Horizontal gene transfer contributed extensively to the emergence of resistance in Enterobacteriaceae during several outbreak periods [36–39] and was shown to be involved in 10% of infections with highly resistant gram-negative bacteria in a tertiary care hospital [35]. This study is the first to describe the relative distribution of resistance outbreaks across bacterial species to identify whether a pattern consistent with frequent involvement of horizontal gene transfer is evident from the data. To attain sufficient numbers of isolates for analysis, bacterial genus and species were pulled into groups consistent with current biological classifications. The grouping was justified by the scope of the study, which was not to identify specific species or clones responsible for interspecies transmission of resistance, but to test for inter-species-group dependence of resistance outbreaks.
Strengths of this study are the inclusion of the majority of detected bacteria and antibiotic therapies in the analyses, the availability of population and control data to account for population changes, and the adjustment for underlying seasonality and temporal trends in species-group incidence and resistance profiles during cluster detection. These adjustments suggest that detected outbreaks reflect genuine clusters of transmission. Contrary to rule-based outbreak detection, the use of advanced outbreak detection software does not rely on subjective judgment of outbreak occurrence.
There are several limitations to this evaluation. First, our analysis led to detection of only the single most likely cluster for each species-group or species-group–antibiotic combination. Second, we only included the first isolate for each species-group from each patient. Both these may have resulted in underestimation of the incidence of outbreaks for the 2002–2009 period. Third, throughout this period an expert rule proposed that Enterobacter species, Serratia species, Citrobacter freundii, Morganella species, and Providencia species should be reported as resistant to cephalosporins and piperacillin/tazobactam. Although this rule was controversial and not enforced rigorously, some of the resistant isolates might have been reported rather than measured as resistant. Finally, clustering of cases does not necessarily mean that there is a biological connection between cases [40].
In summary, a better understanding of the relative contribution of the several mechanisms of resistance emergence and spread on ICU is needed to inform antimicrobial stewardship and infection control programs. Here we identified frequent simultaneous occurrence of resistance outbreaks consistent with cross-species horizontal transfer of resistance elements. Further studies using automated outbreak detection software, combined with targeted sequencing of bacterial genomes, will be required to determine the contribution of interspecies gene transfer to resistance emergence in the hospital setting.
Notes
Acknowledgments. John Stelling, Susan Huang, and Martin Kulldorff are greatly acknowledged for assisting with the queries concerning the analysis settings in WHONet-SaTScan software. Ben Cooper is part of the Wellcome Trust Mahidol University Oxford Tropical Medicine Research Programme, supported by the Wellcome Trust of Great Britain (Major Overseas Programme–Thailand Unit Core Grant). Ben Cooper also acknowledges support from the Oak Foundation.
Financial support. This work was supported by a grant from Pfizer as part of the AIRE Foundation programme and by Guy's & St Thomas’ Charity, Department of Health via the NIHR comprehensive Biomedical Research Centre award to Guy's & St Thomas’ NHS Foundation Trust in partnership with King's College London.
Potential conflicts of interest. All authors: No reported conflicts.
All authors have submitted the ICMJE Form for Disclosure of Potential Conflicts of Interest. Conflicts that the editors consider relevant to the content of the manuscript have been disclosed.

