


Abstract
Severe malaria resulting from Plasmodium falciparum infection is the leading parasitic cause of death in children worldwide, and severe malarial anemia (SMA) is the most common clinical presentation. The evidence in support of current blood transfusion guidelines for patients with SMA is limited.
We conducted a retrospective cohort study of 911 hospitalized children with SMA in a holoendemic region of Zambia to examine the association of whole blood transfusion with in-hospital survival. Data were analyzed in adjusted logistic regression models using multiple imputation for missing data.
The median age of patients was 24 months (interquartile range, 16–30) and overall case fatality was 16%. Blood transfusion was associated with 35% reduced odds of death in children with SMA (odds ratio, 0.65; 95% confidence interval, .52–.81; P = .0002) corresponding to a number-needed-to-treat (NNT) of 14 patients. Children with SMA complicated by thrombocytopenia were more likely to benefit from transfusion than those without thrombocytopenia (NNT = 5). Longer storage time of whole blood was negatively associated with survival and with the posttransfusion rise in the platelet count but was not associated with the posttransfusion change in hemoglobin concentration.
Whole blood given to pediatric patients with SMA was associated with improved survival, mainly among those with thrombocytopenia who received whole blood stored for <4 weeks. These findings point to a potential use for incorporating thrombocytopenia into clinical decision making and management of severe malaria, which can be further assessed in prospective studies, and underline the importance of maintaining reliable blood donation networks in areas of high malaria transmission.
Severe malaria resulting from infection with Plasmodium falciparum remains a public health crisis in highly endemic areas. In 2020, there were 627 000 malaria deaths, including 602 000 in sub-Saharan Africa where the majority of those who die are children younger than 5 years old [1]. Despite its toll, the clinical management of severe malaria has seen little advancement over the past 2 decades [2]. Prompt diagnosis and treatment with intravenous artesunate and supportive measures are the current standard of care. In high-transmission regions, the predominant clinical presentation of severe malaria is severe malarial anemia (SMA). Other presentations include cerebral malaria and severe malaria classified according to the presence of acidosis, respiratory distress, jaundice, hyperparasitemia, and other laboratory and clinical features [3].
Prior studies that assessed the role of blood transfusion in the management of children with SMA often yielded equivocal results [4–17]. A Cochrane meta-analysis last updated in 2010 found no conclusive evidence for a benefit of blood transfusion to survival in children with SMA [18]. Early studies were done at the height of the acquired immunodeficiency syndrome epidemic in sub-Saharan Africa, when investigators sought evidence to support a reduction in the number of blood transfusions to curtail transfusion-transmitted retroviral infection [4, 5]. Studies tended to group SMA with other causes of severe anemia, limiting their implications for the case management of severe malaria.
In Zambia, as throughout sub-Saharan Africa, whole blood, rather than its individual components, is commonly used for transfusion. Blood donors are mainly senior secondary school-aged children. Screening of blood for human immunodeficiency virus, hepatitis B and C viruses, and syphilis is universal. Because of supply-and-demand imbalance, blood bank stockouts occur periodically, providing a means to investigate the impact of blood transfusion on patient outcomes in a quasi-experimental design [19].
To evaluate the impact of whole blood transfusion on the survival of hospitalized children with SMA, we conducted a retrospective cohort study at a district-level hospital in a holoendemic area of northern Zambia. In addition to informing clinical care, characterizing the effects of blood transfusion on survival of patients with SMA can assist national malaria control programs in accounting for the contribution to malaria mortality of blood supply shortages, a public health crisis of its own [20].
METHODS
Study Site
The study was conducted at a 175-bed district-level hospital in Nchelenge District, Luapula Province [21], where malaria is holoendemic [22, 23]. Intravenous artesunate has been used as first-line therapy for severe malaria there since 2012.
Study Design and Study Population
This was a retrospective cohort study of hospitalized children ≤15 years old with SMA. Inclusion criteria were a diagnosis of SMA, defined by a recorded malaria diagnosis in the ward register in combination with a documented hemoglobin concentration ≤5 g/dL measured within 24 hours of hospital admission. The hospital clinicians largely rely on reported results of P. falciparum–specific rapid diagnostic tests (RDTs) performed at the referring health centers, in combination with a compatible clinical syndrome, to diagnose malaria. RDTs were sometimes performed in the hospital ward itself (51% of cases), whereas microscopy was rarely done (<1% of cases). Exclusion criteria were missing hemoglobin data, missing outcome data, diagnosis of sickle cell disease, and presence of eosinophilia (>500 eosinophils/μL). The study was approved in the United States by the Johns Hopkins Bloomberg School of Public Health Institutional Review Board and by the Tropical Disease Research Centre Ethics Review Committee in Ndola, Zambia.
Study Procedures
Data were extracted from pediatric ward registers and laboratory logbooks across dates for which all data sources were available. These were inclusive of March–December 2012 and January 2014–June 2019. Patient age, sex, weight, and dates of hospital admission, blood transfusion (if any), and hospital discharge or death were collected, as were expiration dates of transfused blood and dates of laboratory testing. White blood cell count, platelet count, mean corpuscular volume, mean corpuscular hemoglobin, mean corpuscular hemoglobin concentration, and ABO blood type for children with available data were recorded. Complete blood count testing was performed using a Sysmex XS 1000i analyzer (Sysmex Corporation, Kobe, Japan). For eligible children with available medical charts (n = 513), we recorded presenting signs and symptoms including fever defined as an axillary temperature >37.5°C and the presence or absence of respiratory distress, coma or convulsion, and jaundice.
Outcomes
The primary outcome was mortality. Secondary outcomes were length of stay and post-transfusion changes in hemoglobin concentration and platelet count.
Statistical Analysis
Pearson χ2 or Fisher exact tests were used to compare categorical variables and Student t or Wilcoxon rank-sum tests were used to compare continuous variables. Survival data were displayed in Kaplan-Meier survival curves and compared using the log-rank test. Multivariable logistic regression was used to predict in-hospital mortality and estimate the effect of blood transfusion controlling for age, sex, and hematologic covariates (hemoglobin concentration, white blood cell count, and platelet count) in the main model. Interactions between blood transfusion and continuous age, age group (<5 years vs 5 to ≤15 years), hemoglobin concentration, hemoglobin group (≤3.0 g/dL vs 3.1–5.0 g/dL), platelet count, and thrombocytopenia (threshold of 75 000/μL identified from graphical inspection of a smoothed spline curve) were tested in separate regression models to evaluate for effect modification. Multiple imputation using a fully conditional specification with 25 iterations was implemented for all logistic regression analyses, incorporating the admission date as an auxiliary variable [24]. Missingness was modeled to be missing completely at random based on the mechanisms of missingness (ie, randomly misplaced or destroyed laboratory and ward records, instrument downtime). Missing data for all predictor variables included in regression models for the primary analysis were imputed. Number needed to treat (NNT) was calculated from the adjusted logistic regression models using the standard formula with standard Wald methods for calculation of the 95% confidence interval (CI). In secondary analyses, we analyzed only those who received a blood transfusion to investigate associations between survival and the storage time of blood and post-transfusion changes in the hemoglobin concentration and platelet count, and we analyzed only those who survived to examine differences in length of hospital stay. Three sensitivity analyses were done. One excluded data from 2012 to control for potential secular trends, another included only children with available chart data to allow adjustment for additional covariates, and the third included only those with available RDT results. Analyses were done using SAS 9.4 (SAS Institute Inc., Cary, North Carolina, USA) and Stata 16 (StataCorp, College Station, Texas, USA).
RESULTS
Figure 1 shows the study flow diagram and Table 1 shows the baseline characteristics of the study population. Over the study period, there were 22 partial or complete blood stockouts lasting between 1 and 24 days. Of the 911 eligible children, 709 (78%) underwent transfusion, 155 (17%) did not, and 47 (5%) were missing transfusion data because of unavailable records. Mortality was 14% in the transfused group compared with 26% in the nontransfused group (Table 2). Three hundred and ten (34%) were missing white blood cell count data and 328 (36%) were missing platelet count data. Children with missing data were similar to those without missing data with respect to age, sex, hemoglobin concentration, and mortality (Supplementary data).
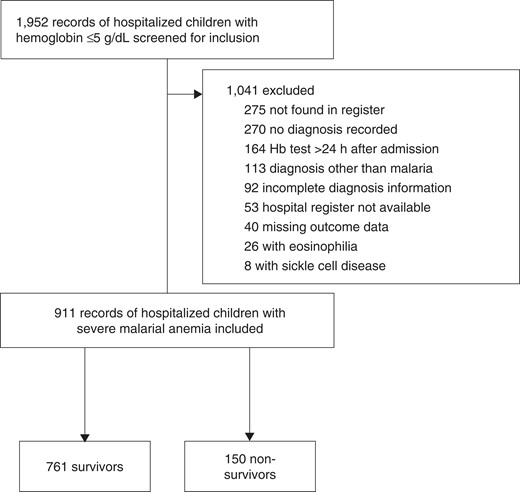
Record screening and inclusion. Abbreviation: Hb, hemoglobin.
Characteristics of Children With Severe Malarial Anemia According to Survival
| Survivors (n = 761) | Nonsurvivors (n = 150) | P-value | |
|---|---|---|---|
| Age, m | 24 (16–31) | 24 (14–29) | .565 |
| Age group | .961 | ||
| <2 y | 293 (39%) | 58 (39%) | |
| 2 to <5 y | 402 (53%) | 78 (52%) | |
| 5 to ≤15 y | 66 (9%) | 14 (9%) | |
| Female | 381 (50%) | 84 (56%) | .184 |
| Clinical features on presentation | |||
| Fever | 201 (48%) | 41 (56%) | .216 |
| Respiratory distress | 95 (22%) | 32 (39%) | .002 |
| Coma or convulsion | 39 (9%) | 9 (11%) | .607 |
| Jaundice | 19 (4%) | 12 (14%) | <.001 |
| Hemoglobin, g/dL | 3.7 (3.1–4.4) | 3.4 (2.5–4.3) | .002 |
| White blood cell count, 1000/μL | 13.5 (8.5–22.8) | 18.9 (9.4–30.5) | .008 |
| Platelet count, 1000/μL | 125 (73–218) | 78 (44–153) | <.001 |
| Blood group | .866 | ||
| Type A | 177 (27%) | 37 (30%) | |
| Type B | 153 (23%) | 28 (22%) | |
| Type AB | 34 (5%) | 8 (6%) | |
| Type O | 288 (44%) | 52 (42%) | |
| Mean corpuscular volume, fL | 79.9 ± 13.1 | 79.6 ± 12.6 | .864 |
| Mean corpuscular hemoglobin, pg/cell | 24.6 ± 4.3 | 24.0 ± 3.8 | .269 |
| Mean corpuscular hemoglobin concentration, g/dL | 30.8 ± 3.5 | 30.9 ± 7.1 | .102 |
| Hemoglobin ≤3.0 g/dL | 176 (23%) | 55 (37%) | <.001 |
| Platelet count ≤75 000/μL | 136 (28%) | 43 (46%) | <.001 |
| Length of stay, d | 4.7 ± 4.2 | 2.1 ± 2.9 | <.001 |
| Antibacterial therapy administered | 211 (49%) | 45 (56%) | .293 |
| Blood transfusion administered | 610 (84%) | 99 (71%) | <.001 |
| Time to expiration of whole blood, d | 18.8 ± 9.1 | 16.3 ± 9.5 | .017 |
| Transfused within 2 wk of expiration date | 192 (32%) | 46 (47%) | .004 |
Data are n (%), median (interquartile range), or mean ± standard deviation. P-values were computed by Pearson χ2 or Fisher exact test for dichotomous variables and Wilcoxon rank-sum test for continuous variables.
Characteristics of Children With Severe Malarial Anemia According to Whether Whole Blood Transfusion Was Given or Not
| Transfusion (n = 709) | No Transfusion (n = 155) | P-value | |
|---|---|---|---|
| Age, m | 24 (15–31) | 24 (15–35) | .897 |
| Age group | .981 | ||
| <2 y | 287 (41%) | 64 (41%) | |
| 2 to <5 y | 356 (50%) | 77 (50%) | |
| 5 to ≤15 y | 66 (9%) | 14 (9%) | |
| Female | 362 (51%) | 73 (47%) | .372 |
| Clinical features on presentation | |||
| Fever | 205 (50%) | 37 (49%) | .879 |
| Respiratory distress | 108 (25%) | 19 (23%) | .768 |
| Coma or convulsion | 37 (7%) | 17 (21%) | <.001 |
| Jaundice | 23 (5%) | 8 (10%) | .113 |
| Hemoglobin, g/dL | 3.6 (3.0–4.3) | 4.0 (3.3–4.6) | <.001 |
| White blood cell count, 1000/μL | 14.4 (8.6–24.8) | 13.4 (8.9–20.9) | .608 |
| Platelet count, 1000/μL | 122 (70–219) | 90 (58–163) | .009 |
| Blood group | .628 | ||
| Type A | 186 (29%) | 23 (24%) | |
| Type B | 154 (24%) | 22 (23%) | |
| Type AB | 37 (6%) | 4 (4%) | |
| Type O | 268 (42%) | 46 (48%) | |
| Mean corpuscular volume, fL | 80.2 ± 13.7 | 79.1 ± 10.5 | .747 |
| Mean corpuscular hemoglobin, pg/cell | 24.6 ± 4.4 | 24.0 ± 3.4 | .233 |
| Mean corpuscular hemoglobin concentration, g/dL | 30.8 ± 4.7 | 30.6 ± 3.1 | .769 |
| Hemoglobin ≤3.0 g/dL | 194 (28%) | 29 (19%) | .025 |
| Platelet count ≤75 000/μL | 135 (29%) | 38 (36%) | .157 |
| Length of stay, d | 4.4 ± 4.3 | 3.6 ± 3.5 | .001 |
| Antibacterial therapy administered | 212 (49%) | 45 (56%) | .254 |
| Died before hospital discharge | 99 (14%) | 41 (26%) | <.001 |
Data are n (%), median (interquartile range), or mean ± standard deviation. P-values were computed by Pearson χ2 or Fisher exact test for dichotomous variables and Wilcoxon rank-sum test for continuous variables.
Mortality was associated with respiratory distress, jaundice, hemoglobin concentration, white blood cell count, platelet count, length of stay, blood transfusion, and storage time of blood in unadjusted comparisons (Table 1). The nontransfused group had a higher median hemoglobin concentration, lower platelet count, and higher prevalence of coma or convulsion. The higher hemoglobin concentration in the nontransfused group resulted from clinical practice variation: different providers used slightly different thresholds for transfusion, and when the supply of whole blood was low, patients with lower hemoglobin concentrations were prioritized over those with higher concentrations. Hemoglobin and platelets were negatively correlated (Spearman’s ρ −0.17, P < .0001); thus, the selection of patients with higher hemoglobin concentrations into the nontransfused group simultaneously selected for those with lower platelet counts.
In the primary analysis, blood transfusion was associated with reduced mortality (odds ratio [OR], 0.65; 95% CI .52–.81; P = .0002 adjusted for age, sex, and hematologic covariates), corresponding to an NNT of 14 patients (95% CI, 9.5–27.1). Sensitivity analysis excluding the 2012 data yielded similar results (OR, 0.46; 95% CI, .27–.79; P = .005) as did a sensitivity analysis limited to those with an available positive RDT result (OR, 0.64; 95% CI, .47–.88; P = .006). Length of stay was similar between survivors of both groups (4.7 vs 4.5 days; P = .49).
Kaplan-Meier survival estimates stratified by age, anemia severity, and thrombocytopenia are shown in Figure 2. Transfusion had a similar impact on survival in children older than 5 years of age as in children younger than 5 years old. Stratification by anemia suggested that children with more severe anemia benefited more than children with less severe anemia but the CI overlapped (OR, 0.36; 95% CI, .16–.81; P = .01 for those with hemoglobin ≤3.0 g/dL and OR, 0.43; 95% CI, .26–.70; P = .0006 for those with hemoglobin 3.1–5.0 g/dL). Stratification by platelet count showed a difference in transfusion-associated survival only in children with thrombocytopenia: in children with platelets >75 000/μL, there was no statistically significant association between transfusion and survival (OR, 1.47; 95% CI, .84–2.63; P = .18 adjusted for age, sex, hemoglobin concentration, and white blood cell count) in contrast to children with platelets ≤75 000/μL (OR, 0.36; 95% CI, .20–.64; P = .0007 adjusted for the same). Effect modification analysis by logistic regression supported an interaction between blood transfusion and thrombocytopenia (P = .01) but not age (P = .93) or hemoglobin concentration (P = .79). The corresponding NNT for patients with SMA complicated by thrombocytopenia was 5 patients (95% CI, 4.3–9.8).
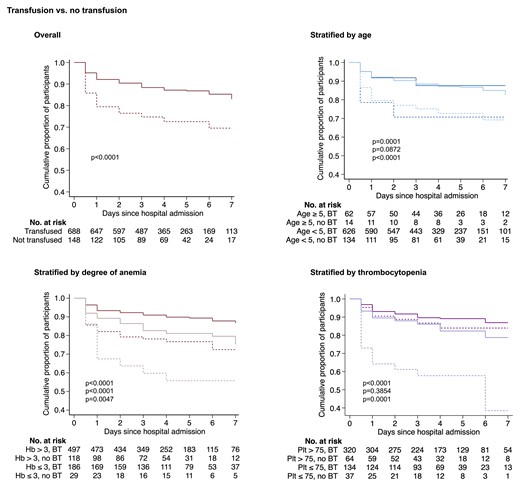
Kaplan-Meier estimates of the cumulative survival of children with severe malarial anemia who either received whole blood transfusion or not. Curves show transfused (solid line) or nontransfused (broken line) patients stratified according to the upper (dark color) and lower (light color) limits for each subgroup category. P-values were calculated by the log-rank test and are displayed in order of overall and pairwise comparisons according to subgroup from top to bottom. Notably, whole blood transfusion was not associated with survival in children without thrombocytopenia (P = .39). Transfusion was not significantly associated with survival in children >5 years old (P = .09), but the comparison is limited by the small sample size (n = 14). Patients missing date of admission and/or discharge (n = 32) were excluded. Abbreviations: BT, blood transfusion; Hb, hemoglobin; Plt, platelet count.
Transfused patients whose platelet count increased were more likely to have survived than transfused patients whose platelet count did not (OR, 0.09; 95% CI, .13–.62; P = .014 adjusted for age, sex, and hematologic covariates) but the same was not true for the hemoglobin concentration (Figure 3A). Similarly, nonsurvivors differed from survivors with respect to the posttransfusion platelet count but not the posttransfusion hemoglobin concentration (Figure 3B).
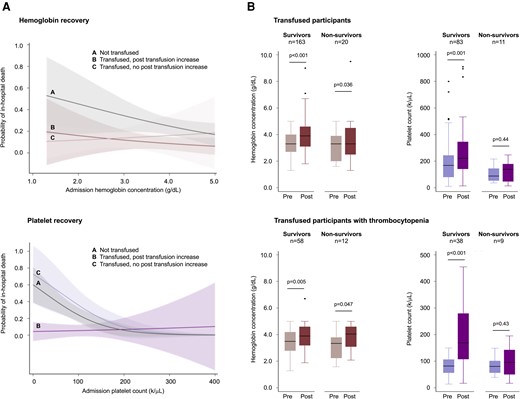
Hemoglobin and platelet recovery after whole blood transfusion. (A) Marginal probabilities of mortality as a function of the admission hemoglobin concentration or platelet count grouped according to transfused (red or purple curves) and nontransfused (gray curves) patients, further stratified according to whether the patient had a posttransfusion increase (dark color) or no increase (light color). Estimates are from the full logistic regression model. Patients who were transfused had a higher probability of survival than those who were not transfused whether or not the post-transfusion hemoglobin increased (top left). In contrast, patients who were transfused had a higher probability of survival than those who were not transfused only when the post-transfusion platelet count was observed to increase (bottom left). A post-transfusion increase was defined as a change in hemoglobin concentration of +1.0 g/dL or a change in the platelet count of +44 000/μL (the median difference between pre- and posttransfusion platelet counts). The median interval between tests was 2 days (IQR, 2–4 days), reflecting hospital policy for the timing of blood redraws. Shaded areas represent the 95% CI. (B) Box-and-whisker plots of pre- and posttransfusion values in patients with SMA who underwent whole blood transfusion and had pre- and posttransfusion laboratory data. Nonsurvivors differed from survivors with respect to the posttransfusion platelet count but not the posttransfusion hemoglobin concentration. Thrombocytopenia was defined here as a platelet count <150 000/μL to provide a sufficient sample size for statistical comparisons. P-values were calculated using Student paired t test on log normalized data. CI, confidence interval; IQR, interquartile range.
Transfusion using older blood was associated with higher mortality and poorer platelet recovery. Adjusted for age, sex, and hematologic covariates, transfusion using blood that was within a week of standard 35-day expiration (ie, stored ≥28 days) was associated with greater odds of death compared with transfusion with fresher blood (OR, 2.22; 95% CI, 1.26–3.89; P = .006) (Figure 4A). Longer storage times of whole blood were associated with a reduction in the posttransfusion increase of platelets (βstorage time −65 000/μL/wk, 95% CI, −21 000/μL/wk to −109 000/μL/wk; P = .006), but was not associated with the posttransfusion change in hemoglobin concentration (P = .95) (Figure 4B).
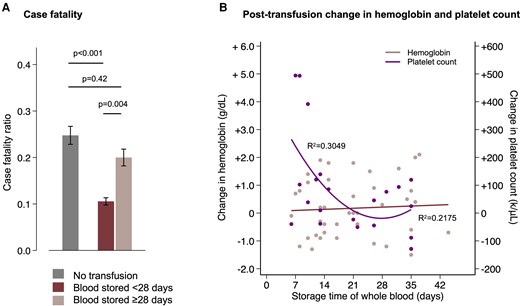
Time in storage of whole blood influences mortality and the posttransfusion platelet count but not the posttransfusion hemoglobin concentration. (A) Case fatality stratified by no transfusion (gray) or transfusion with fresher (dark red) or older (light red) blood. Mortality was lower in patients who were transfused with blood stored <28 days compared both to those who were not transfused and to those who were transfused with blood stored ≥28 days, whereas there was no significant difference in mortality between those transfused with older blood and those who were not transfused. The error bars are 95% CI of the point estimates from the full logistic regression model. (B) Posttransfusion change in the hemoglobin (red) and platelet count (purple). Data were normalized to the interval between the pre- and posttransfusion complete blood counts using data from nontransfused patients who had repeated measurements. Longer time in storage was associated with a reduction in the posttransfusion increase of platelets (P = .006) but was not associated with the posttransfusion change in hemoglobin concentration (P = .95). The R2 values are for the linear fit to the hemoglobin data and quadratic fit to the platelet data. CI, confidence interval.
Respiratory distress was significantly associated with mortality independent of age, sex, hemoglobin concentration, white blood cell count, or blood transfusion (OR, 1.91; 95% CI, 1.06–3.45; P = .031) but the association was partially confounded by thrombocytopenia (OR, 1.71; 95% CI, .93–3.13; P = .082 for respiratory distress and OR, 2.56; 95% CI, 1.41–4.63; P = .002 for thrombocytopenia in the full model). The median platelet count in children with respiratory distress was 89 000 compared to 122 000/μL in children without respiratory distress, and children with respiratory distress had twice the odds of thrombocytopenia than those without respiratory distress (OR, 1.93; 95% CI, 1.19–3.11; P = .007). Coma or convulsion was not associated with mortality or thrombocytopenia in unadjusted or adjusted models.
DISCUSSION
This was a retrospective study of whole blood transfusion for the treatment of SMA resulting from P. falciparum infection in children. Whole blood transfusion was associated with higher odds of survival mainly in those with concomitant thrombocytopenia, defined as ≤75 000 platelets/μL. Transfused patients who survived had higher post-transfusion platelet counts than those who did not survive. In contrast, the pre- and post-transfusion hemoglobin concentrations did not differ significantly between survivors and nonsurvivors. Transfusion with blood stored <28 days was associated with lower mortality and a greater rise in the post-transfusion platelet count than blood stored ≥28 days. In combination, these findings suggest a positive association between whole blood transfusion and survival in children with SMA that is modified by the presence or absence of thrombocytopenia.
The study population was typical of patients with SMA in a high malaria transmission setting. The median age was young (24 months), girls and boys were equally represented, and clinical presentations consistent with cerebral malaria were infrequent (7%). Case fatality (16%) was at the high end of the range for similar transmission settings in sub-Saharan Africa [10], with a large proportion (40%) of deaths occurring on the day of admission. We did not detect any seasonal variation in the number of daily admissions or case fatalities, reported in 1 previous study in a similar high-transmission setting [25].
The overall protective association of blood transfusion was similar in magnitude to previous studies that reported a survival benefit, which notably include studies that predated the advent of artesunate intravenous therapy [4, 6, 7, 17]. The estimated NNT to prevent one death in the total study population was 14 patients. For those with thrombocytopenia, the NNT was 5 patients.
The therapeutic benefit of blood transfusion for SMA is via several potential mechanisms: expansion of the circulatory volume, increased oxygen carrying capacity via donated erythrocytes, and infusion of immunoglobulins and other protein and cellular components of the donor immune system. Fluid management in severe malaria and pediatric febrile illness in Africa in general is notoriously challenging [26, 27] and relies on careful assessment of individual patient presentations. The hemoglobin threshold chosen for the stratified analysis (≤3 g/dL) was based on a secondary analysis of the AQUAMAT trial data, which found that hemoglobin concentration appeared to affect survival once below that threshold [12]. Restoration of oxygen carrying capacity appears to be one determinant of survival in patients with SMA, but perhaps only for those with profoundly low hemoglobin concentrations.
Prior studies of blood transfusion for SMA did not report on platelet counts. Thrombocytopenia is a common feature of severe falciparum malaria, independently associated with mortality in this study and others [28, 29]. Here, the association between respiratory distress and death, a frequent observation in prior studies [27], was partially confounded by thrombocytopenia. The cause of malarial thrombocytopenia is likely multifactorial: platelet consumption, splenic sequestration, impaired thrombogenesis, and the formation of platelet-erythrocyte complexes. Rarely is it associated with disseminated intravascular coagulation or hemorrhagic complications [27].
Thrombocytopenia may be an indirect marker of disease severity (eg, large parasite burden or a harbinger of worsening anemia). It has been shown to be correlated with higher parasitemia [30], although the nature and causal direction of the correlation is unclear. Thrombocytopenia has also been associated with cerebral malaria [31], although in the current study cerebral malaria was neither associated with thrombocytopenia nor mortality, perhaps because of an insufficient number of cases to power the analyses. Thus, platelet counts may serve a useful biomarker for informing the prognosis and clinical management of SMA. In practice, thrombocytopenia may help identify those patients for whom transfusion will be the most beneficial, or, conversely, its absence may identify patients for whom transfusion has little if any effect on survival.
Alternatively, the role of thrombocytopenia in severe malaria may be more direct. Current evidence supports both protective and deleterious roles of platelets in malaria immunopathophysiology [32–36]. Beyond their role in hemostasis, platelets are important actors in innate and adaptive immunity [37–43] and fortify against tissue injury [44, 45]. Platelets assist in the recruitment of immune effector cells and secrete microbicides [46]. In malaria, platelets preferentially bind parasitized erythrocytes and exhibit direct parasitoidal activity [33, 34]. Thrombocytopenia-associated immune impairment is therefore one possible explanation of the observed association between thrombocytopenia and mortality. The same phenomenon was recently described for melioidosis, caused by another intracellular pathogen [47].
There are limitations to this study. The retrospective observational design limits causal interpretations and cannot account for unmeasured confounders. Data for all variables were not available for every patient because of missing records, variation in clinical practice between providers, and intermittent downtime of laboratory instruments. There were notable baseline differences between the transfused and nontransfused groups: the nontransfused group had higher hemoglobin concentrations, which likely reflects provider practice variation in the decision to transfuse, and a lower median platelet count, although the proportion with thrombocytopenia was similar to the transfused group. Baseline differences were accounted for in adjusted regression models. The case definition for SMA in this study relied on written documentation and, where available, RDT results rather than microscopic confirmation, thus there is risk of misclassification bias (eg, bacterial sepsis with comorbid malaria or incidental parasitemia).
We considered the possibility of survivorship bias in the data: were children not transfused because they died before they had the opportunity? We minimized bias by restricting eligibility to patients with a hemoglobin measurement within the first 24 hours of admission by confirming that those who died within the first hospital day were similarly likely to receive transfusion as those who survived (64 vs 74%, χ2 test, P = .24) and by conducting the analysis in an intention-to-treat fashion: 2 deaths in the transfusion group occurred before transfusion could be completed and were retained in the transfused group for the analysis. We also examined available laboratory records to confirm dates of blood stockouts and crosschecked those with hospital admission dates of patients. In the nontransfused group, 88% were admitted during a complete (42%) or partial (46%) stockout, compared with 45% in the transfused group of whom only 4% were admitted on a day when a complete stockout was recorded. Lastly, the survivor functions of the transfused and nontransfused groups (Figure 2) show differences in mortality that extend beyond the first day of admission. The risk of survivorship bias in the data is therefore judged to be low.
Severe malaria has a complex and unresolved pathophysiology. These clinical observations point to a potential role for thrombocytopenia-informed transfusion strategies in the management of severe malaria and emphasize the need for maintaining a reliable blood donation network in sub-Saharan Africa. Freshly collected blood could be made a priority for patients with SMA, and perhaps the shelf life of whole blood in this context should be rethought. Whether these findings are generalizable to patients with malarial thrombocytopenia without SMA or to patients with severe malaria caused by non-falciparum Plasmodium spp. can be explored in future studies.
Supplementary Data
Supplementary materials are available at Clinical Infectious Diseases online. Consisting of data provided by the authors to benefit the reader, the posted materials are not copyedited and are the sole responsibility of the authors, so questions or comments should be addressed to the corresponding author.
Notes
Author contributions. M. M. I. conceived and designed the study, collected data, supervised data collection, analyzed and interpreted data, and authored the manuscript. J. B. K., L. K. K., and P. M. B. contributed to study conception, design, supervision, and interpretation of results. L. R. Y. and T. A. L. contributed to biostatistical methods, data analysis, and interpretation of results. M. H. contributed to data collection and interpretation of results. R. M. contributed to the literature review and interpretation of results. G. C. contributed to project execution and supervision. M. M. and J. A. B. contributed to literature review and data interpretation. T. A. S. contributed to interpretation of the data and project supervision. W. J. M. contributed to the conception and design of the study, data interpretation, and is the project director of Southern and Central Africa International Centers of Excellence for Malaria Research. All authors critically reviewed the paper and approved the final version of the manuscript.
Acknowledgments. The authors thank Dickson Phiri, Benjamin Kussin-Shoptaw, Dr. Albert Baschong, and Dr. Marco Rüegg for their assistance with data collection. They thank the administration and staff of Saint Paul’s General Hospital and the District Health Office.
Financial support. The work was supported by the Johns Hopkins Malaria Research Institute, Bloomberg Philanthropies, and the Division of Microbiology and Infectious Diseases, National Institute of Allergy and Infectious Diseases as part of the Southern and Central Africa International Centers of Excellence for Malaria Research (U19AI089680). J. B. K. is supported by The European and Developing Countries Clinical Trials Partnership. M. M. I. is supported by the National Institutes of Health (K23AI139343), the Sherrilyn and Ken Fisher Center for Environmental Infectious Diseases at Johns Hopkins University, and the Burroughs Wellcome Fund-American Society of Tropical Medicine and Hygiene Postdoctoral Fellowship in Tropical Infectious Diseases.
References
Author notes
Potential conflicts of interest. W. J. M. reports grants or contracts outside the scope of this work, all paid to Johns Hopkins University, from the National Institutes of Health, Bill & Melinda Gates Foundation, and Gavi, the Vaccine Alliance. T. A. L. reports book royalties from Taylor and Francis; consulting fees from the University of Massachusetts (payment to author for educational program review), the University of Minnesota (payment to author for educational program advisory board), and Annual Reviews (payment to author for editorial board); payment for expert testimony on Urban League et al. v Ross et al. (2020 Census issues) from the NYU Brennan Center; and participation on the NIDDK DSMB. T. A. S. reports grants or contracts outside the scope of this work from the National Institutes of Health and Unitaid, both paid to the institution, and Johns Hopkins Malaria Research Institute, paid within institution; multiple United States and international patents for antimalarial drug development (inventions and therapies unrelated to this manuscript); and stock or stock options (multiple in retirement accounts, managed stocks; none directly in pharmaceuticals and none in any way related to work in this manuscript). J. B. K. reports support for attending meetings and travel from the Science of Malaria Eradication in Barcelona. All other authors report no potential conflicts.
All authors have submitted the ICMJE Form for Disclosure of Potential Conflicts of Interest. Conflicts that the editors consider relevant to the content of the manuscript have been disclosed.

