


Abstract
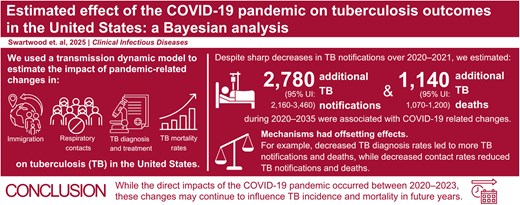
Tuberculosis (TB) notifications and deaths in the United States fluctuated substantially during the coronavirus disease 2019 (COVID-19) pandemic. We analyzed multiple data sources to understand the factors contributing to these changes and estimated future TB trends.
We identified 4 mechanisms potentially contributing to observed TB trends during 2020–2023: immigration, respiratory contact rates, rates of accurate diagnosis and treatment initiation, and mortality rates for persons experiencing TB disease. We employed a Bayesian approach to synthesize evidence on how these mechanisms changed during the pandemic and how they might have combined to produce observed 2020–2023 TB data, using a transmission-dynamic model to link mechanisms to TB outcomes. We also simulated a no-pandemic-counterfactual scenario that assumed mechanisms followed pre-pandemic trends. We estimated TB outcomes associated with the pandemic until 2035 to capture lagged effects. We evaluated additional scenarios to estimate the individual effect of each mechanism.
Over 2020–2035, we estimate an additional 2784 (95% uncertainty interval: 2164–3461) TB notifications and 1138 (1076–1201) TB deaths in the United States associated with changes occurring during the COVID-19 pandemic. Mechanisms had offsetting effects—decreases in TB diagnosis rates led to more TB deaths and notifications, while reductions in contact rates reduced TB deaths and notifications. Immigration changes initially reduced TB deaths, but increased deaths and notifications over time. Higher TB mortality rates increased TB deaths but decreased TB notifications.
Although direct impacts of the COVID-19 pandemic occurred between 2020 and 2023, these changes may continue to influence TB incidence and mortality in future years.
Preliminary tuberculosis (TB) surveillance data suggest that persons experiencing TB in the United States increased 16% in 2023 compared to 2022 [1]. This rise occurred 3 years after a 19% reduction in persons with reported TB in 2020 compared to 2019 [2]. These fluctuations represent notable departures from the slow decline in persons experiencing TB observed over the prior 8 years (2011–2019), during which annual percentage changes ranged from −5.4% to 1.7% [3]. Although TB deaths declined by 2% between 2018 and 2019, TB mortality increased sharply following 2019, with the number of persons dying with TB 17% and 21% higher in 2020 and 2021, respectively, compared to 2019 [4]. This variation in persons experiencing TB and TB deaths could have resulted from changes related to the COVID-19 pandemic.
The coronavirus disease 2019 (COVID-19) pandemic disrupted US health services [5, 6], including routine and preventive TB care [7, 8]. Resulting diagnostic delays and treatment interruptions might have increased the duration of infectiousness for TB disease and delayed therapy initiation, prolonging morbidity and leading to elevated mortality rates compared to the pre-pandemic period [9, 10]. COVID-19 coinfection might have also led to worse outcomes, including increased mortality, for persons experiencing TB [11, 12].
The pandemic might also have affected TB through changes in immigration. Since 2002 the majority of TB in the United States has occurred among non-US-born persons [3]. In 2022, non-US-born persons accounted for 72% of TB notifications, and 31% of these notifications occurred within 4 years since entry [3]. As such, TB rates in the United States are sensitive to the number and origin of migrants entering annually [13]. The initial federal response to COVID-19 included provisions that limited immigration into the United States [14]. These efforts led to fewer immigrants between March 2020 and February 2021, followed by a rebound during March 2021–September 2022 once pandemic measures were relaxed [15]. These immigration changes might also affect long-term TB incidence as 51% of TB notifications among non-US-born persons occur in persons who have been in the United States over 10 years [3].
Changes in TB transmission during the pandemic might have affected TB trends. Both severe acute respiratory syndrome coronavirus 2 (SARS-CoV-2) and Mycobacterium tuberculosis (Mtb) are spread through respiratory transmission [16]; therefore, the non-pharmaceutical interventions designed to limit SARS-CoV-2 transmission—such as stay-at-home orders, physical distancing, and face mask use—might have lowered respiratory contact rates and reduced TB transmission [17, 18].
As these factors changed simultaneously, it is difficult to estimate their individual impacts on TB dynamics in the United States based on observational data alone. However, understanding their potential effect on U.S. TB (collectively and individually) is important for predicting future trends and preparing for potential future pandemics. Mathematical models have proven a useful tool for investigating these types of questions, by allowing multiple evidence sources to be synthesized in an internally consistent framework, constraining estimated outcomes to align with existing epidemiological evidence, and allowing future trends to be forecast under multiple counterfactual scenarios [19, 20].
In this study, we used a transmission-dynamic model to investigate the potential impact of COVID-19-associated changes on US TB outcomes. We focused on 4 potential mechanisms through which COVID-19 might have impacted TB dynamics: changes in immigration, respiratory contact rates, rates of accurate TB diagnosis and treatment initiation (access to care), and mortality rates among persons experiencing TB, and synthesized available data describing these changes over 2020–2023. We estimated the individual and collective impact of these mechanisms on Mtb infections, TB notifications, and TB deaths, both during the pandemic period (2020–2023) and over future years (2024–2035), compared to a no-pandemic-counterfactual. We used these estimates to describe the potential long-term impacts of COVID-19 pandemic on TB in the United States.
METHODS
Reported TB Data
We collated annual data describing changes in US TB during 2020–2023: total TB notifications, the percentage of TB notifications occurring in non-US-born persons, the percentage of non-US-born TB notifications occurring in new arrivals (entered the United States <2 years before notification year), and TB deaths. We extracted data on TB notifications for 2020–2022 from the National TB Surveillance System (NTSS), which contains TB cases reported by the 50 US states and District of Columbia [3]. We retained variables describing the year the case was counted, origin-of-birth (US-born or non-US–born), and length of time in the United States. We defined new arrivals to ensure we captured elevated risks of TB progression during the first 2 years post-infection [21]. TB notification data for 2023 were extracted from preliminary reporting by the Centers for Disease Control and Prevention (CDC) [1]. Reported TB deaths during 2020–2023 were extracted from CDC's Multiple Cause of Death database [4]; all deaths with TB listed as a cause of death (underlying or non-underlying) on the death certificate were used. These are referred to as “TB deaths.”
Data on Epidemiological Mechanisms Affected by the COVID-19 Pandemic
We identified 4 epidemiological mechanisms potentially affected by the COVID-19 pandemic. Each mechanism had a plausible route-of-impact via host or environmental changes, consistent with the epidemiologic triad, and sufficient published data to inform the model. No evidence suggested a change in the etiologic agent, Mycobacterium tuberculosis, so we omitted this triad arm from our analysis. We collated available data on each mechanism between 2020 and 2023. Data describing changes in immigration during March 2020–September 2022 were extracted from Department of Homeland Security (DHS) reports [15]. We used data on numbers of Legal Permanent Resident New Arrival admissions and assumed rates of entry for other migrant categories changed proportionally to these values. An analysis of US Customs and Border Protection and DHS data suggests that the trend in the volume of uninspected entries mirrored that of Legal Permanent Residents during 2020–2023 [22]. Estimated changes in respiratory contact rates during the pandemic were informed by interpersonal contact rates estimated by a previous study [23]. To allow for changes during 2020–2023, we assumed that the overall reduction in contact rates was proportional to the Oxford Stringency Index, a time-varying composite measure of COVID-19 mitigation measures [24]. Data on reductions in access to care were collected from CDC's Research and Development Survey [25], and we assumed changes in the rate of TB diagnosis and treatment (for persons experiencing undiagnosed disease) were proportional to these values. We calculated mortality rates for persons experiencing TB using data on TB notifications from the NTSS [3] and TB deaths from CDC's Multiple Cause of Death database [4],
Mathematical Model and Parameter Calibration
We adapted a published mathematical model of TB [26], which simulates Mtb transmission and TB progression within the United States as a function of demographic trends, risk-factor distributions, immigration patterns, and the provision of TB prevention and treatment services, with a monthly timestep. The model was fit to data on US demography, reported TB epidemiological data, natural history evidence, and health services data spanning 1950–2019. Supplementary Figure 1 presents the model's structural schematic, showing model compartments and transitions. Further model assumptions are described in the Supplement.
We used this model to synthesize evidence describing changes in epidemiological mechanisms and reported TB outcomes (notifications and deaths) during 2020–2023 (Supplementary Figure 2). We incorporated this evidence using a Bayesian calibration approach, in which prior distributions were created to represent time trends in each of the epidemiological mechanisms over 2020–2023, and calibration targets created from the reported TB data. Details on calibration can be found in the Supplement.
We parameterized changes in each epidemiological mechanism as a step-function, with steps every six months during March 2020–March 2023 (approximating the expiration of the federal Public Health Emergency for COVID-19 [27]) (Supplementary Table 1). We assumed each mechanism would return linearly to projected pre-pandemic levels during March–December 2023.
We defined log-likelihood functions comparing model estimates to reported data for annual TB notifications, TB deaths, percentage of TB notifications occurring in non-US-born persons, and the percentage of non-US-born TB notifications among new arrivals. We used incremental mixture importance sampling to sample the posterior distribution for the step function parameters of each epidemiological mechanism [28]. This procedure yielded 1000 parameter sets consistent with the reported TB data while representing the joint uncertainty in the effects of the epidemiological mechanisms.
Analytic Scenarios
We used the calibrated model to create a “fitted-pandemic scenario,” representing actual TB outcomes during the COVID-19 pandemic, and used this scenario to project annual TB outcomes (incident Mtb infections, TB notifications, and TB deaths) through 2035. We also calculated outcomes for a counterfactual “no-pandemic” scenario, which assumed that the 4 epidemiological mechanisms followed pre-pandemic trends. For immigration, we assumed no net increase in immigration volume during the pandemic period, that is, cumulative immigration in the no-pandemic-counterfactual equaled that under the fitted-pandemic scenario. We ran additional scenario analyses exploring the impact of a ± 25% change in immigration during 2020–2023. For the remaining mechanisms, we assumed the pre-pandemic trends were a continuation of observed trends through 2019.
We calculated the difference in incident Mtb infections, TB notifications, and TB deaths between the fitted-pandemic scenario and the no-pandemic-counterfactual to quantify the impact of the COVID-19 pandemic on US TB outcomes (representing the combined effect of the epidemiological mechanisms) between 2020 and 2035.
We created additional scenarios to explore the contribution of each individual epidemiological mechanism to the overall pandemic effect. These scenarios were created by modifying the fitted-pandemic scenario such that a single epidemiological mechanism was assumed to follow its “no-pandemic” trend, whereas the other 3 followed the fitted-pandemic trend. We calculated the difference in TB outcomes under each alternative scenario and the fitted-pandemic scenario during 2020–2035 to estimate the TB notifications and TB deaths associated with each mechanism. As the mathematical model accounted for the non-linear interaction of epidemiological mechanisms, the sum of these 4 effects was not expected to sum to the total pandemic effect.
Statistical Analysis
We simulated outcomes for each of 1000 parameter samples. We calculated point estimates as the median of these simulated results and reported equal-tailed 95% uncertainty intervals as the 2.5th and 97.5th percentiles of the distribution of results. All analyses were conducted in R (v. 4.2.1) using the Rcpp and MITUS R packages [29–31].
RESULTS
Fitted-pandemic Scenario
Figure 1 shows the monthly modeled trend in the mechanism parameters compared with the reported data used to inform the model. Supplementary Figure 3 compares results of the fitted model to reported TB data over 2020–2023.
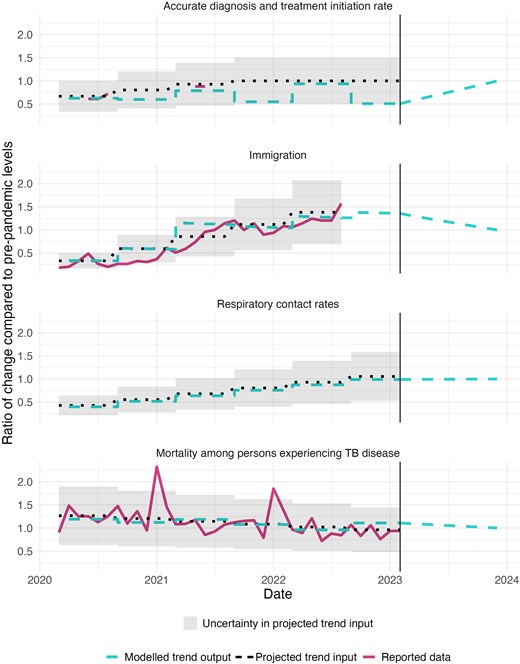
Comparison of reported trends in COVID-19 adjustment mechanisms to projected trend inputs and modelled trend outputs for each of the four examined mechanisms during 2020–2023. Note: that 1.0 represents equality with pre-pandemic projected levels. As respiratory contact trend is a synthesis of multiple data sources, no reported data is shown for that mechanism. Y-axis is different across parameters. Abbreviation: COVID-19, coronavirus disease 2019.
Future TB Outcomes
Figure 2 shows modeled TB outcomes projected to 2035 under the fitted-pandemic scenario and no-pandemic-counterfactual. During 2020–2035, cumulative notifications were estimated to be 132 417 (95% uncertainty interval: 128 670–137 403) under the no-pandemic-counterfactual and 135 187 (131 189–140 493) under the fitted-pandemic scenario, a difference of 2.1% (1.9%–2.3%), or 2784 (2164–3461) notifications. A majority (74.7% [74.0%–75.4%]) of the additional TB notifications associated with the pandemic were estimated to occur among non-US-born persons, consistent with pre-pandemic trends.
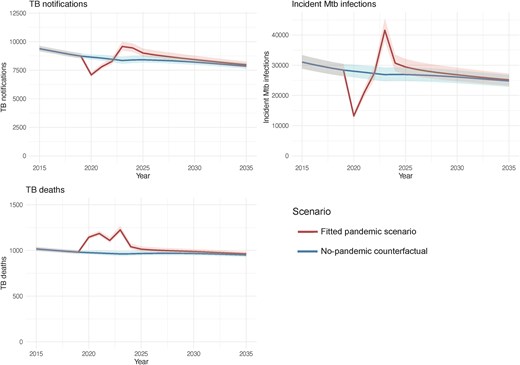
Model estimated annual TB outcomes under the fitted-pandemic scenario and the no-pandemic-counterfactual during 2015–2035. Solid lines represent point estimates. Shaded regions represent 95% uncertainty intervals. Abbreviations: Mtb, Mycobacterium tuberculosis; TB, tuberculosis.
Table 1 presents the estimated annual differences in TB outcomes between the fitted-pandemic scenario and the no-pandemic-counterfactual for selected years. Under the fitted-pandemic scenario, TB notifications were lower over 2020–2022 compared to the counterfactual (2500 [2333–2682] fewer TB notifications). Over 2023–2035, TB notifications were higher under the fitted-pandemic scenario compared to the no-pandemic scenario (5284 ([4845–5794]) additional TB notifications).
Net Changes in TB Outcomes Associated With the COVID-19 Pandemic in Selected Calendar Years, Stratified by Nativity
| Calendar Year | ||||||
|---|---|---|---|---|---|---|
| 2020 | 2021 | 2022 | 2023 | 2025 | 2035 | |
| TB notifications | ||||||
| Total | −1551 (−1,622, −1493) | −760 (−832, −691) | −189 (−227, −148) | 1228 (1,151, 1332) | 593 (542, 652) | 122 (106, −139) |
| US-born | −410 (−427, −392) | −251 (−276, −226) | −196 (−215, −174) | 228 (205, 252) | 282 (252, 311) | 28 (23, 31) |
| Non-US–born | −1141 (−1,244, −1077) | −509 (−573, −453) | 7 (−44, 52) | 1000 (935, 1093) | 311 (282, 349) | 94 (83, −107) |
| Incident Mtb infections | ||||||
| Total | −14 769 (−15,957, −13 672) | −6733 (−7,365, −6105) | 228 (59, 421) | 14 683 (13,437, 16,125) | 2513 (2,191, 2917) | 368 (307, 448) |
| US-born | −9075 (−9,729, −8492) | −3708 (−4,028, −3421) | 652 (561, 763) | 10 435 (9,650, 11,373) | 1173 (1,041, 1354) | 161 (127, 199) |
| Non-US–born | −5694 (−6,228, −5108) | −3025 (−3,338, −2685) | −424 (−502, −342) | 4248 (3,787, 4752) | 1340 (1,150, 1563) | 207 (180, 249) |
| TB deaths | ||||||
| Total | 169 (163, 174) | 215 (207, 222) | 143 (136, 149) | 263 (252 277) | 47 (43, 52) | 14 (13, 15) |
| US-born | 43 (41, 45) | 49 (46, 52) | 25 (23, 27) | 52 (50, 55) | 17 (15, 19) | 2 (2, 2) |
| Non-U.S.–born | 126 (122, 129) | 166 (161, 170) | 118 (113, 122) | 211 (202, 222) | 30 (28, 33) | 12 (11, 13) |
Numbers in parentheses represent 95% uncertainty intervals. A negative number represents lower TB outcomes estimated for the fitted-pandemic scenario compared to the no-pandemic-counterfactual.
Abbreviations: COVID-19, coronavirus disease 2019; Mtb, Mycobacterium tuberculosis; TB, tuberculosis.
During 2020–2035, 15,428 (15 095–15 844) cumulative TB deaths were estimated under the no-pandemic-counterfactual and 16 566 (16 203–17 016) deaths under the fitted-pandemic scenario. The estimated 1138 (1076–1201) additional deaths represented a 7.4% (7.2%–7.5%) increase compared with the no-pandemic-counterfactual. Under both the fitted-pandemic scenario and no-pandemic-counterfactual the majority of TB deaths were among non-US-born persons, comprising 80.3% (79.7%–80.9%) and 80.5% (80.0%–81.2%), respectively. Under the fitted-pandemic scenario, estimated annual TB deaths were elevated across the study period, compared with the no-pandemic-counterfactual.
During 2020–2035, an estimated 430 783 (396 390–467 892) incident Mtb infections occurred under the fitted-pandemic scenario and 422 752 (389 523–458 475) under the no-pandemic-counterfactual, representing a 1.9% (1.6%–2.3%) increase.
Impact of Individual Epidemiological Mechanisms
Figure 3A shows the cumulative changes in TB notifications and deaths attributable to the changes in each epidemiological mechanism during the pandemic, estimated over the 2020–2035 study period.
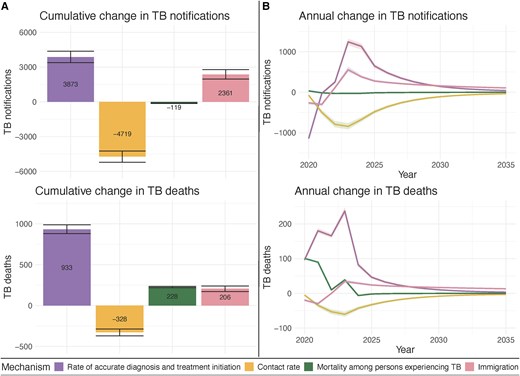
Estimated impact of each examined COVID-19 related mechanism on TB outcomes during 2020–2035. A, Cumulative difference in TB outcomes associated with each mechanism B, Annual difference in TB outcomes associated with each mechanism. Note: Error bars and shaded area represent 95% uncertainty intervals. Abbreviations: COVID-19, coronavirus disease 2019; TB, tuberculosis.
Figure 3B depicts time trends in TB notifications and deaths associated with each mechanism. For multiple mechanisms we estimated most cumulative mechanism-associated impacts on TB outcomes would occur during 2024–2035, after parameters returned to pre-COVID levels. During 2024–2035, an estimated 3545 (3230–3869) and 2255 (2029–2520) additional TB notifications were associated with pandemic-related changes in rates of accurate diagnosis and treatment initiation and immigration, respectively. In contrast, pandemic-related changes in respiratory contact rates were estimated to produce 2510 (2260–2797) fewer TB notifications during 2024–2035. Change in TB mortality had its effect on TB notifications concentrated during 2020–2023. The impact of pandemic-related changes in mechanisms on TB deaths followed similar trends to TB notifications. Supplementary Figure 4 shows similar trends in incident Mtb infections. The initial reduction in incident Mtb infections was driven by pandemic-related changes in respiratory contact rates.
Supplementary Figure 5 shows the differences in TB outcomes associated with COVID-19 pandemic under a sensitivity analysis that varied no-pandemic-counterfactual immigration.
DISCUSSION
The COVID-19 pandemic caused widespread disruption within the United States during 2020–2023. In this analysis, we examined pandemic impacts on TB outcomes—as mediated through changes in immigration, respiratory contact rates, access to TB care, and mortality among persons experiencing TB disease—during the 2020–2023 period and modeled long-term effects of the pandemic on TB outcomes in the United States. During 2020–2035, we estimated 2770 additional TB notifications and 1138 additional TB deaths due to pandemic-associated changes. TB notifications decreased sharply during 2020–2022, followed by an increase in TB notifications through 2035. The initial decrease was driven primarily by reduced accurate diagnosis and treatment initiation rates and, to a lesser extent, immigration. The initial estimated increase in TB notifications might be due, at least in part, to a “catch-up” in the diagnosis of TB notifications not diagnosed due to lack of access to TB care or changes in the timing of immigration [1]. Estimated additional TB deaths might reflect increased death among those with COVID-19 coinfection or increased disease severity at TB diagnosis, likely associated with delayed diagnoses [7, 12].
The United States provides a valuable case study of the impact of COVID-19 on TB in a setting where TB trends are largely driven by reactivation of Mtb infection among non-US-born persons [3]. Our analysis suggests that the COVID-19 pandemic influenced TB among U.S.-born and non-US-born persons through different mechanisms, demonstrating a mathematical relationship between immigration rates and TB incidence rates among non-U.S.-born persons. The sharp decrease in immigration in 2020 was associated with fewer TB notifications among non-US-born persons during 2020–2022. TB notifications among non-US-born persons subsequently increased as TB services returned to pre-pandemic levels and reported immigration rebounded. This positive relationship between migration volume and non-US-born TB rates reflects the disproportionate contribution of recent migrants to US TB notifications, with rates of TB diagnosis for migrants in the years immediately following US entry substantially higher than for US-born persons and long-term residents [32]. In 2023, modelled TB notifications totals among non-US-born persons surpassed their modelled no-pandemic-counterfactual projection, reflecting increased immigration during 2021–2022 [15].
Several studies have investigated the impact of COVID-19 on TB in high-incidence settings, but few studies have been published for the United States [7, 10, 12, 33, 34]. An analysis of the 2020–2021 Global Burden of Disease (GBD) estimates reported excess TB deaths among persons under 65 years-of-age, resulting in an observed to expected deaths ratio of 1.09 (0.983 to 1.20) across all ages [35]. Our model estimates suggest a ratio of 1.20, which falls at the high end of the reported range. This elevated estimate might be due to the exclusion of persons living with huma immunodeficiency virus (HIV) in the GBD estimate, a population that has been shown to have increased mortality among persons experiencing TB [12]. Furthermore, we can compare our fitted parameter estimates to empirical metrics. For instance, our estimates of reductions in accurate diagnosis and treatment initiation are consistent with an analysis which found a 37% decrease in sputum smear and culture samples collected during 2020 in 2 large Californian hospitals [36]. An analysis of emergency department claims among Medicare beneficiaries also found a decrease in TB claims during 2020 [34]. Additionally, the number of persons who were identified as a contact of a person experiencing TB declined in 2020 [37].
This analysis has limitations. First, our estimates are sensitive to the assumptions and data used for model fitting, the latter of which were not available for all mechanisms over the total 2020–2023 period. Data used to inform trends in the rates of diagnosis and treatment initiation were only available at a few timepoints. In contrast, our study benefited from the high quality of US TB surveillance data, which allowed us to calibrate the model to multiple epidemiological metrics and timepoints. Second, our model did not account for potential changes in TB burden among persons immigrating to the United States. Disruptions in TB care in sender countries might result in increased Mtb infection incidence among persons who immigrate to the United States [38]. Similarly, the pandemic might have shifted the types of individuals migrating to the United States [39], which could change TB rates after US entry. Third, our study explored each mechanism at a national-level. However, both TB outcomes and COVID-19 impacts vary substantially across subnational geographies [40, 41]. These differences are often driven by the distribution of risk-factors [42], many of which are shared between COVID-19 and TB [43]. Further research examining the sub-national impact of the pandemic on changes in population risks and TB outcomes could better inform future public health responses.
This study used mathematical modeling to explore the impact of COVID-19 pandemic on TB in the United States, finding increases in both TB notifications and TB deaths during 2020–2035. Although the direct impacts of the COVID-19 pandemic occurred between 2020 and 2023, our analysis suggests these changes might continue to influence TB incidence and mortality in future years.
Supplementary Data
Supplementary materials are available at Clinical Infectious Diseases online. Consisting of data provided by the authors to benefit the reader, the posted materials are not copyedited and are the sole responsibility of the authors, so questions or comments should be addressed to the corresponding author.
Notes
Author Contributions. N. A. S., N. A. M., and S. M. M. conceived the project. N. A. M. and J. A. S. acquired funding. N. A. S. wrote the model code, drafted the original manuscript, and visualized the results. N. A. S. curated the data and executed the analysis. All authors contributed to the development of the methodology and reviewed and edited the original manuscript.
Acknowledgments. The authors thank Stephanie Su and Teresa Puente for assistance in study coordination.
Disclaimer. The findings, conclusions, and views expressed are those of the authors and do not necessarily represent the official position of the Centers for Disease Control and Prevention (CDC).
Data availability statement. Apart from National TB Surveillance System data, all data used in this analysis represent deidentified publicly available datasets. National TB Surveillance System data contain information abstracted from the national tuberculosis case report form called the Report of Verified Case of Tuberculosis (RVCT) (OMB No. 0920-0728). These data have been reported voluntarily to CDC by state and local health departments and are protected under the Assurance of Confidentiality (Sections 306 and 308(d) of the Public Health Service Act, 42 U.S.C. 242k and 242m(d)), which prevents disclosure of any information that could be used to directly or indirectly identify patients. For more information, see the CDC/ATSDR Policy on Releasing and Sharing Data (at https://stacks.cdc.gov/view/cdc/7563). A limited dataset is available at http://wonder.cdc.gov/tb.html. Researchers seeking additional National TB Surveillance System data may request access through the National Center for Health Statistics’ Research Data Centers (https://www.cdc.gov/rdc/index.html). N. A. S. had full access to all the data in the study and takes responsibility for the integrity of the data and the accuracy of the data analysis.
Financial support. This work was supported by the CDC, National Center for HIV, Viral Hepatitis, STD, and TB Prevention Epidemiologic and Economic Modeling Agreement (NEEMA; grant number NU38PS004651 to N. A. S., N. A. M., T. C., J. A. S.), and the National Institutes of Health (grant number R01AI146555-02 to C. R. H.).
References
Author notes
Potential conflicts of interest. T. C. reported receiving grants from the National Institutes of Health (NIH) paid to his institution outside the submitted work. N. A. M. reported receiving grants from NIH, World Health Organization, US Council of State and Territorial Epidemiologists, the Bill and Melinda Gates Foundation, and the CDC; and personal fees from The Global Fund to Fight AIDS, Tuberculosis and Malaria outside the submitted work. All other authors report no potential conflicts.
All authors have submitted the ICMJE Form for Disclosure of Potential Conflicts of Interest. Conflicts that the editors consider relevant to the content of the manuscript have been disclosed.

