


Abstract
The locus coeruleus–norepinephrine system plays a key role in supporting brain health along the lifespan, notably through its modulatory effects on neuroinflammation. Using ultra–high field diffusion magnetic resonance imaging, we examined whether microstructural properties (neurite density index and orientation dispersion index) in the locus coeruleus were related to those in cortical and subcortical regions, and whether this was modulated by plasma glial fibrillary acidic protein levels, as a proxy of astrocyte reactivity. In our cohort of 60 healthy individuals (30 to 85 yr, 50% female), higher glial fibrillary acidic protein correlated with lower neurite density index in frontal cortical regions, the hippocampus, and the amygdala. Furthermore, under higher levels of glial fibrillary acidic protein (above ~ 150 pg/mL for cortical and ~ 145 pg/mL for subcortical regions), lower locus coeruleus orientation dispersion index was associated with lower orientation dispersion index in frontotemporal cortical regions and in subcortical regions. Interestingly, individuals with higher locus coeruleus orientation dispersion index exhibited higher orientation dispersion index in these (sub)cortical regions, despite having higher glial fibrillary acidic protein levels. Together, these results suggest that the interaction between locus coeruleus–norepinephrine cells and astrocytes can signal a detrimental or neuroprotective pathway for brain integrity and support the importance of maintaining locus coeruleus neuronal health in aging and in the prevention of age-related neurodegenerative diseases.
Introduction
The locus coeruleus (LC) is a small, elongated nucleus in the pons that provides norepinephrine (NE) to the entire brain through its widespread projections, and thus has important functions in normal physiology, including the regulation of arousal and the sleep–wake cycle, and the modulation of cognition and behavior (Samuels and Szabadi 2008; Sara 2009; Van Egroo et al. 2022). Despite its small size, several neuroimaging and autopsy studies have highlighted not only its critical role in supporting brain health through the lifespan, as reflected by brain micro- and macro-structure (Mather and Harley 2016; Bachman et al. 2021; Elman et al. 2022), but also its vulnerability to Alzheimer’s disease (AD)-related pathologic changes starting early in adulthood (Braak et al. 2011; Kang et al. 2022; Jacobs et al. 2023; Van Egroo et al. 2023). Thus, identifying processes that contribute to the impact of LC neurons on the neuroaxis will be critical in our attempt to promote brain health.
An important pathway contributing to brain health in aging is the involvement of the LC–NE system in the regulation of neuroinflammatory processes. Animal studies showed that endogenous NE exerts anti-inflammatory and neuroprotective effects onto the brain by downregulating the microglial functions and the transcription of pro-inflammatory genes in astrocytes (Heneka et al. 2010; Braun et al. 2014; Finnell et al. 2019). By contrast, destroying LC neurons with the selective noradrenergic neurotoxin N-(2-chloroethyl)-N-ethyl-2-bromobenzylamine (DSP-4) resulted in NE depletion, exacerbated neuroinflammatory responses and astrocyte reactivity (Heneka et al. 2006). When dysregulated, these reactive astrocytes are characterized by the overexpression of the intermediate filament glial fibrillary acidic protein (GFAP) and, if sustained, can have deleterious effects on overall brain health. Both animal studies as well as human neuropathology studies reported that GFAP levels increase with aging (Nichols et al. 1993) may contribute to reduced clearance of beta-amyloid (Heneka et al. 2010) and are associated with the presence of both neurofibrillary tangles and beta-amyloid plaques (Porchet et al. 2003). It is important to note that the DSP-4 neurotoxin used in animal studies destroys a high proportion of LC neurons (up to 80%), while in humans, loss of LC neurons is a less extensive, gradual, and delayed process. Autopsy studies demonstrated that LC neurons remain sturdy, even when early hyperphosphorylated tau accumulates (Ehrenberg et al. 2017; Theofilas et al. 2017). However, while neuronal death seems to occur later in the disease progression, LC cells do undergo morphological changes during aging and the earliest disease stages, including partial dendritic atrophy, sometimes combined with swollen dendritic trees, and a reduction in the density of their projections to the cortex (Chan-Palay and Asan 1989). These morphological changes are also detected in the precortical Braak stages of AD, with cell bodies and neurites staining positive for tau pathology starting at the precortical Braak stages of tau pathology (Gilvesy et al. 2022).
Thus, while animal studies suggest that loss of LC neurons contributes to greater AD-related pathology via increased astrocyte reactivity, autopsy data indicates that these events may already be occurring during normal aging with more subtle changes to cytoskeletal components of LC neurons. Detecting these early changes could facilitate the early detection of processes associated with declining brain health in aging and could open up opportunities to develop preventive interventions targeting the LC–NE system in age-related diseases, starting before the emergence of cognitive decline. Measuring the LC in vivo has been challenging due to its small size and hidden location deep in the brain. But with the development of specific magnetic resonance imaging (MRI) sequences sensitive to LC contrast, recent work revealed that, compared to younger individuals, older individuals retaining higher LC integrity presented a larger cortical thickness in parietal, frontal, and occipital regions (Bachman et al. 2021). Such macrostructural associations were not observed within an older male population of a narrow age range, but better microstructural cortical gray matter properties in the salience network and frontoparietal regions were associated with higher LC integrity (Elman et al. 2022). These findings suggest that microstructural brain properties, as measured with diffusion-weighted imaging (DWI), provide more sensitivity to detect early LC–related brain structural changes in healthy individuals. So far, only a handful of studies examined diffusion in the LC and reported unexpected lower diffusivity and higher fractional anisotropy in the LC in older individuals relative to younger ones (Langley et al. 2020; Porat et al. 2022). These unexpected findings in LC diffusion metrics may result from partial volume effects due to the large voxel size or a slightly biased delineation of the LC due to the use of nonstudy specific templates in standard space that do not take into account individual anatomic variability (Engels-Domínguez et al. 2023).
Ultra-high field (UHF) MRI has ushered in an era of more detailed visualization of the brain, allowing to image the LC in great detail at the individual level (Priovoulos et al. 2018). The implementation of the aforementioned LC-specific sequences at UHF MRI in combination with advanced biophysical diffusion models such as neurite orientation dispersion and density imaging (NODDI) allows for detailed assessment of complex microstructural properties within the LC. Compared to standard diffusion models, NODDI provides a more sensitive detection of subtle age–related microstructural changes in neurite density and organization that are preceding volumetric changes (Schiavone et al. 2009; Kamiya et al. 2020). Taking advantage of these new UHF MRI developments, we set out to relate microstructural NODDI properties of the LC to those extracted in cortical gray matter and subcortical brain regions in 60 individuals across the adult lifespan. We further investigated the moderating effect of reactive astrocytes, indexed by plasma GFAP levels, on these relationships. Finally, because the LC can shape cognitive functions through its interactions with the cortex and subcortex, we also explored potential associations with cognition. Guided by the literature, we hypothesized that lower LC microstructural properties will be associated with both lower cortical and lower subcortical microstructural properties, and that this effect will be more pronounced under elevated plasma GFAP levels.
Materials and methods
Participants
Our study population is composed of a subgroup of cognitively unimpaired individuals across the adult lifespan (n = 62, age range = 30 to 85 yr; 30 women [50%]) from the 7T adult lifespan study (Van Egroo et al. 2021; Van Egroo et al. 2023). Individuals were included into the current study if they had availability of the diffusion scan. Participants were right-handed and recruited from the Dutch population through advertisements in the South of the Netherlands. Exclusion criteria included contraindications for UHF MRI scanning, history of major psychiatric or neurological disorders, history of cardiac disorders, use of drugs or psychoactive medication, and excessive alcohol consumption (>15 units/wk). All participants provided written informed consent, and the experimental protocol was approved by the local Medical Ethics Committee of the Maastricht University Medical Center.
MRI data acquisition
The imaging protocol was performed on a 7T MAGNETOM whole-body MR system (Siemens Healthineers, Erlangen, Germany) with a 32-channel (1TX/32RX) head coil (Nova Medical, Wilmington, MA, United States). A whole-brain structural T1-weighted image was acquired using a magnetization prepared 2 rapid gradient echoes (MP2RAGE) sequence (Marques et al. 2010; TR = 5,000 ms, TE = 2.47 ms, flip angle = 5°/3°, voxel size = 0.7 mm isotropic, number of slices = 240). The LC was imaged at high resolution with an in–house developed magnetization transfer–weighted turbo flash (MT-TFL) sequence (Priovoulos et al. 2018), consisting of a multi-shot 3D readout (TR = 538 ms, TE = 4.08, flip angle = 8°, voxel size = 0.4 × 0.4 × 0.5 mm3, number of slices = 60) with center-out k-space sampling, preceded by 20 long off-resonant Gaussian sinc pulses (pulse length = 5.12 ms, bandwidth = 250 Hz, B1 = 0.25 μT). The field of view of the MT-TFL sequence was placed perpendicular to the dorsal surface of the pons and covered an area between the inferior colliculi and the caudal border of the pons. Diffusion data were acquired using a multi-shell DWI sequence (66 directions, b = 2,000 s/mm2; 35 directions, b = 700 s/mm2; 6 directions, b = 20 s/mm2; b = 0 in opposite phase-encoding direction; TR = 5000 ms, TE = 60.8 ms, voxel size = 1.25 mm3 isotropic, number of slices = 72). Because of our focus on the brainstem, the field of view of the DWI acquisitions excluded the most dorsal portion of the frontoparietal lobe (Supplementary Fig. 1).
Structural MRI processing
Whole-brain structural MR images were processed in FreeSurfer version 6.0 (Fischl 2012) using the default cortical and subcortical reconstruction protocol as previously described (Dale et al. 1999) with the appropriate configuration for 7T data, i.e. including the “-highres” flag and the expert options file. In brief, this processing pipeline entails intensity normalization, bias field correction and skull stripping of each individual T1-weighted image. White and pial surfaces were delineated and the resulting cortical area was parcellated in 34 distinct regions per hemisphere, according to the Desikan–Killiany atlas (Desikan et al. 2006). Six subcortical structures labeled according to the Aseg atlas were included in the analysis: amygdala, caudate, hippocampus, pallidum, putamen, and thalamus. Note that we follow the labeling of FreeSurfer even though hippocampus is cytoarchitectonically allocortex. All processed images were visually inspected for over- or under-estimation of the gray/white matter boundaries and, if necessary, manually corrected. Finally, the parcellated cortical and subcortical regions were registered to the MP2RAGE space using the function Estimate and Reslice with the nearest neighbor interpolation option in SPM12 software (https://www.fil.ion.ucl.ac.uk/spm/software/spm12/), under Matlab R2023a (version 9.14.0, MathWorks, Natick, MA).
The MT-TFL images were pre-processed following our in–house developed 7T LC pipeline, as described previously (Van Egroo et al. 2021). All LC scans were intensity-normalized using the subject–specific mean intensity of a 10 × 10 voxels reference region located in the pontine tegmentum. A study-specific template was created using an iterative diffeomorphic warp estimate in ANTs software. The LC mask was then manually delineated on the template by an expert (MVE), based on voxel intensities and prior knowledge on LC anatomy. Subject-specific median LC MRI signal intensity values across each slice were extracted per hemisphere by applying the LC mask onto each individual intensity-normalized MT-TFL images registered to the study-specific template. An illustration of the delineated LC mask in the standard MNI space (0.5 mm resolution) together with its overlap on the published meta-mask (Dahl et al. 2022b) is presented in Supplementary Fig. 2.
Diffusion MRI processing
Diffusion-weighted images were preprocessed to correct for B0 susceptibility-induced and eddy current–induced distortions, as well as participant’s motion, using topup and eddy tools of the FSL software version 5.0.9 (Jenkinson et al. 2012). Whole-brain NODDI parameter maps of neurite density index (NDI) and orientation dispersion index (ODI) were then computed using the Microstructure Diffusion Toolbox (v1.2.6, https://github.com/robbert-harms/MDT). NDI values range from 0 to 1, with 0 reflecting low neurite density (i.e. mostly extracellular diffusion) and 1 reflecting high neurite density (i.e. mostly intracellular diffusion). ODI values range from 0 to 1, with 0 reflecting low arborization (i.e. parallel neurites) and 1 reflecting high arborization (i.e. highly dispersed neurites; Zhang et al. 2012). Axial and coronal views of NODDI maps with and without the LC mask overlaid are presented in Supplementary Fig. 3 for illustrative purposes.
Cortical, subcortical, and LC NODDI parameters extraction
Individual structural MP2RAGE images were registered to the individual mean diffusion–weighted b0 volume using SPM12 Estimate and Reslice function with the nearest neighbor interpolation option. The resulting transformation matrices were subsequently applied to the individual LC masks and the parcellated cortical and subcortical regions, previously resliced to the MP2RAGE space. For each individual, registrations of the LC mask and the parcellated cortical and subcortical regions to the diffusion space were visually inspected, and data was excluded in case of poor registration quality (n = 2). To prevent a calculation bias due to the partial diffusion field of view, cortical regions for which at least 80% of their voxels in at least 80% of the participants were not mapped into the diffusion space were excluded from the analyses. As a result, 11 cortical regions were excluded: caudal middle frontal, cuneus, inferior parietal, paracentral, postcentral, posterior cingulate, precentral, precuneus, superior frontal, superior parietal, and supramarginal.
Microstructure NODDI estimates (i.e. NDI and ODI) were computed by taking the median of values from each region of interest, i.e. the LC and the parcellated cortical and subcortical regions. As we had no a priori hypothesis on asymmetry, median diffusion metric estimates were averaged across left and right hemispheres.
Plasma measurements
Fasted EDTA plasma samples were obtained in the morning through venipuncture from the antecubital vein and processed according to the SOP stipulated by the central biobank of Maastricht University Medical Center. Samples were centrifuged at 2000 × g, aliquoted in polypropylene tubes, and stored at −80°C in our biobank within 60 min of collection. Plasma GFAP levels were analyzed in randomized order using a commercially available ultra-sensitive Single molecule array (Simoa) assay kit on an HD-X instrument (Quanterix, Inc.) at the University of Gothenburg, Sweden. Intra- and inter-assay coefficients of variation for GFAP in this study were 5.6% and 7.8%, respectively. Apolipoprotein E (APOE) genotyping was performed using polymerase chain reaction on deoxyribonucleic acid extracted from whole blood samples. Participants’ APOE status was defined as “ε4 carrier” if they carried at least 1 ε4 allele. Technicians handling the blood samples were blinded to the participant cognitive and imaging data, and staff collecting cognitive or imaging data were blinded to blood results.
Neuropsychological assessment
Participants underwent a comprehensive neuropsychological test battery including the mini-mental state examination (MMSE), the logical memory delayed recall test, the digit symbol substitution test, the Rey auditory–verbal learning test (total and delayed free recall), and the category fluency test. From these 5 available cognitive tests, we derived the preclinical Alzheimer’s cognitive composite (PACC), sensitive to cognitive change among individuals with preclinical AD, by averaging the z-scores of the tests’ performance (Papp et al. 2017).
Statistical analyses
All analyses were performed using R statistical software (version 4.1.2, http://www.r-project.org/). Group characteristics are represented in mean and standard deviation for continuous variables and proportions for dichotomous variables. Zero-order correlations across all relevant variables were examined with Pearson’s correlations for continuous variables and point–biserial correlations for dichotomous variables. All the following regression models were bootstrapped (5,000 iterations) to approximate a normal distribution for our statistical testing.
First, we examined associations between our key variables for demographics (age, sex, or APOE status) and plasma GFAP, LC intensity, and NODDI parameters in the LC, in the averaged 23 cortical regions and in the averaged 6 subcortical regions using bootstrapped linear regression.
Following our main hypotheses, we then examined the relationship between NODDI metrics in the LC to NODDI metrics in each of the 23 included cortical regions or in each of the 6 subcortical regions using bootstrapped linear regression analyses. In a second step, we related GFAP plasma concentrations to NODDI metrics in each cortical or subcortical region. We then combined these models, by examining the interactive effect between LC NODDI parameters and GFAP plasma concentrations on NODDI metrics in each individual cortical or subcortical region. Models were corrected for age and sex and statistical results were adjusted for multiple comparison per model (across cortical or subcortical regions) using a false discovery rate (FDR) approach with a statistical significance threshold set to P < 0.05. Using the FDR corrected Johnson–Neyman approach, we determined the range of values where the plasma GFAP marker modified the relationship between LC NODDI metrics and cortical or subcortical region–specific NODDI metrics. To reduce the number of comparisons and the risk for Type I errors in the Johnson–Neyman analyses, we averaged all regions where we found significant associations in the model interacting LC NODDI parameters by GFAP plasma concentrations on (sub)cortical NODDI parameters. Regions of interest were displayed using the ggseg package (Mowinckel and Vidal-Piñeiro 2020). In order to test for potential shared method-related variance effects in models involving LC NODDI parameters, we performed specificity analyses replicating the previous models yielding significant associations but replacing LC NODDI metrics by LC intensity, as this represents a distinct imaging method, but is still closely related to our original aim. Sensitivity analyses were performed by repeating our initial models in individuals of age 50 or older, and by adding APOE status, or LC intensity (used as a proxy of LC structural integrity) as covariate to the interaction model to control for AD–related genetic risk and for LC MRI integrity.
Finally, to examine the associations with cognition, we used bootstrapped linear regression to examine the main and interactive associations of GFAP and our imaging NODDI metrics (in the LC, the cortex, and the subcortex) with PACC-score, while correcting for age, sex, and education.
Results
Sample characteristics
Our study cohort consisted of 60 participants with a mean age of 59 yr (range 30 to 85 yr), 30 (50%) were female and 17 (28%) carried at least 1 APOE ε4 allele. All participants were cognitively healthy (mean MMSE score: 28.95) and had a mean plasma GFAP level of 152 pg/mL (Table 1).
Demographics.
| n = 60 | |
|---|---|
| Age (yr) | 58.90 (14.70), range: 30 to 85 |
| Female (no. (%)) | 30 (50%) |
| Education (yr) | 14.58 (2.24) |
| MMSE (score) | 28.95 (1.14) |
| PACC (z-score) | 0.09 (0.70) |
| Plasma GFAP (pg/mL) | 152 (65) |
| APOE ε4 carrier (No. (%)) | 17 (28.33%) |
| LC intensity (a.u.) | 0.12 (0.04) |
| NDI LC | 0.54 (0.05) |
| ODI LC | 0.10 (0.03) |
| NDI cortex# | 0.53 (0.02) |
| ODI cortex# | 0.39 (0.04) |
| NDI subcortex# | 0.59 (0.04) |
| ODI subcortex# | 0.35 (0.05) |
Note: Participants’ characteristics are presented as mean and standard deviation, or proportion. #: These values refer to the average of median NODDI parameters values in the 23 cortical or in the 6 subcortical regions included in the analyses.
Zero-order correlations between demographics, GFAP, LC intensity, and NODDI parameters in the LC and in the averaged cortical or subcortical regions are provided in Supplementary Table 1. We first assessed the effect of age, sex, or APOE status on plasma GFAP, LC intensity, and NODDI metrics in the LC and in the averaged cortical and subcortical regions (Fig. 1). Older age was associated with higher plasma GFAP (β = 2.463, CI = [1.486; 3.399], P < 0.001), lower cortical NDI (β = −0.0005, CI = [−0.0009; −0.0002], P = 0.0028), lower cortical ODI (β = −0.0015, CI = [−0.0020; −0.0009], P < 0.001), lower subcortical NDI (β = −0.0017, CI = [−0.0023; −0.0012], P < 0.001), and lower subcortical ODI (β = −0.0021, CI = [−0.0028; −0.0015], P < 0.001). As compared to males, females exhibited higher cortical ODI (β = 0.037, CI = [0.020; 0.055], P < 0.001), higher subcortical ODI (β = 0.044, CI = [0.023; 0.066], P < 0.001) and at trend-level higher subcortical NDI (β = 0.0198, CI = [−0.0006; 0.0406], P = 0.0562). Carrying at least 1 ε4 allele was associated with lower plasma GFAP (β = −38.507, CI = [−71.645; −2.061], P = 0.042) and with higher subcortical NDI (β = 0.028, CI = [0.006; 0.049], P = 0.013). No other age-, sex-, or APOE-relationships were detected (all P > 0.105).
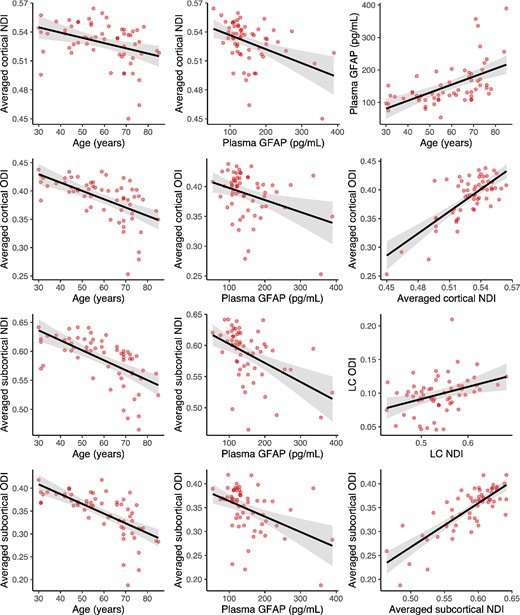
Associations between NODDI parameters, plasma GFAP, and demographics.
Note: regression lines and boxplots depicting the significant associations between variables in the entire cohort. Cortical and subcortical NODDI parameters are computed as the average of the NODDI estimates in the 23 cortical or in the 6 subcortical regions included in the analysis. Shaded areas surrounding the regression lines represent the 95% confidence interval of the regression fit. See also Supplementary Table 1 for zero-order correlation coefficients between all variables.
As for the imaging variables, higher plasma GFAP was associated with both lower NDI (β = −0.00015, CI = [−0.00023; −0.00007], P < 0.001) and lower ODI (β = −0.00020, CI = [−0.00036; −0.00007], P = 0.0036) in the cortex, and both lower NDI (β = −0.0003, CI = [−0.0005; −0.0002], P < 0.001) and lower ODI (β = −0.0003, CI = [−0.0005; −0.0002], P < 0.001) in the subcortex. Higher ODI in the LC was associated with higher ODI in the subcortex (β = 0.467, CI = [0.028; 0.872], P = 0.037). NDI and ODI metrics were positively correlated in the cortex (β = 1.287, CI = [0.989; 1.588], P < 0.001), in the subcortex (β = 0.920, CI = [0.747; 1.101], P < 0.001), and also in the LC (β = 0.181, CI = [0.056; 0.304], P = 0.004), such that higher NDI was associated with higher ODI. In addition, higher cortical NDI was associated with both higher NDI (β = 1.442, CI = [1.133; 1.767], P < 0.001) and ODI (β = 1.508, CI = [1.104; 1.907], P < 0.001) in the subcortex, and similarly higher cortical ODI was associated with both higher NDI (β = 0.754, CI = [0.557; 0.963], P < 0.001) and ODI (β = 1.104, CI = [0.956; 1.253], P < 0.001) in the subcortex. We observed a negative trend-level association between LC intensity and LC ODI (β = −0.277, CI = [−0.589; 0.063], P = 0.092). No other association between plasma GFAP, LC intensity, or NODDI parameters in the cortex, subcortex, and LC were detected (all P > 0.137).
Region-based relationships between cortical or subcortical and LC microstructural properties
We found that higher NDI in the rostral anterior cingulate region was associated with higher NDI in the LC (pFDR = 0.028, Supplementary Fig. 4a). No other cortical or subcortical regions survived adjustment for multiple comparisons (Supplementary Table 2 and 3). We further observed that higher LC ODI estimate was associated with higher ODI in the pallidum (pFDR = 0.042, Supplementary Fig. 4b), and no other cortical or subcortical regions survived correction for multiple comparisons (Supplementary Table 4 and 5). Our specificity analyses, replacing LC NODDI metrics by LC intensity in models that showed significant associations in our previous analyses, revealed no association surviving correction for multiple comparisons between NDI metrics in the cortex and LC intensity and between ODI metrics in subcortical regions and LC intensity (Supplementary Table 6 and 7).
Region-based relationships between cortical or subcortical microstructural properties and plasma GFAP levels
Higher NDI and ODI cortical diffusion estimates were both associated with lower plasma GFAP levels (Supplementary Table 8 and 9). While none of the 4 significant regions survived FDR correction in the ODI model, 7 regions survived adjustment for multiple comparisons in the NDI model (all pFDR < 0.01, Fig. 2A). These regions were mainly located in the frontal cortex. To limit the number of figures, we provide a scatterplot relating GFAP to the average of the 7 significant regions in Fig. 2B. For the subcortical models, lower NDI in the hippocampus and the amygdala was associated with higher GFAP (pFDR = 0.042, Supplementary Table 10, Fig. 2C to E). We further observed that lower ODI in the amygdala was associated with higher plasma GFAP, although not surviving adjustment for multiple comparisons (Supplementary Table 11).
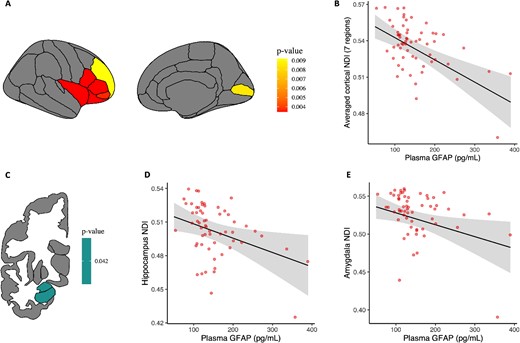
Plasma GFAP associations with regional cortical and subcortical NDI values. Note: A) illustrative map of cortical regions with significant associations (pFDR < 0.05) between cortical NDI values and plasma GFAP levels. Left and right hemispheres values were averaged for each cortical region. B) Relationship between the average of NDI values in the 7 significant cortical regions surviving correction for multiple comparisons and plasma GFAP levels. C) Illustrative map of subcortical regions showing significant associations (pFDR < 0.05) between subcortical NDI values and plasma GFAP levels. Left and right hemispheres values were averaged for each subcortical region. D and E) Relationships between NDI in the hippocampus/amygdala and plasma GFAP (pFDR = 0.042). All models used bootstrapped (5,000 iterations) linear regression analyses and were corrected for age and sex. Raw data points are overlaid to the predicted regression line. Shaded areas surrounding the regression lines represent the 95% confidence interval of the regression fit.
Region-based interactive relationships of LC microstructural properties and plasma GFAP levels on (sub)cortical microstructural properties
Finally, we investigated whether the interaction between LC NODDI and plasma GFAP concentrations was associated with cortical or subcortical NODDI parameters. First, looking at the cortical regions, no interaction effect survived correction for multiple comparisons when considering the NDI models (Supplementary Table 12). In contrast, at levels of plasma GFAP above 150.84 pg/mL, a positive LC-cortical ODI association emerged in 13 frontal-temporal regions (all pFDR < 0.04, Fig. 3A and B, Supplementary Table 13). Above the GFAP threshold, lower LC ODI was associated with lower cortical ODI in frontotemporal cortical regions and conversely, higher ODI in the LC was associated with higher ODI in the same regions. Interestingly, similar patterns emerged when looking at the subcortical regions. While no interaction effect of LC NDI and GFAP on subcortical NDI was observed (Supplementary Table 14), all 6 subcortical regions showed significant ODI interaction effects at levels of plasma GFAP above 145.55 pg/mL such that lower LC ODI was associated with lower subcortical ODI and conversely, higher LC ODI was associated with higher subcortical ODI above the GFAP threshold (all pFDR < 0.036, Fig. 3C and D, Supplementary Table 15). In our specificity analyses, replacing LC NODDI metrics by LC intensity in the significant cortical and subcortical ODI models in interaction with GFAP, we observed that no cortical or subcortical region survived correction for multiple comparisons (Supplementary Table 16 and 17).
![Interactive effects among ODI in the (sub)cortex, ODI in the LC, and plasma GFAP. Note: left: illustrative maps of A) cortical and C) subcortical regions with significant interactive effects (pFDR < 0.05) between LC ODI values and plasma GFAP on (sub)cortical ODI values using bootstrapped linear regression models (5,000 replicates) corrected for age and sex. Left and right hemispheres were averaged for each ROI. Right: scatterplots showing the interactive relationship between LC ODI and plasma GFAP on B) the average of ODI in all 13 significant cortical regions and d) the average of ODI in all 6 significant subcortical regions. The gray area represents the range of GFAP values [above B) 150.84 pg/mL or above D) 145.55 pg/ml] where LC ODI was positively associated with (sub)cortical ODI. For visualization purposes, LC ODI values are shown as mean, + and −1 standard deviation, but analyses were performed continuously. Raw data points are overlaid to the predicted regression line. Shaded areas surrounding the regression lines represent the 95% confidence interval of the regression fit.](https://oup.silverchair-cdn.com/oup/backfile/Content_public/Journal/cercor/34/6/10.1093_cercor_bhae261/1/m_bhae261f3.jpeg?Expires=1750207118&Signature=bPy4FHjHMwHD0EEZqdih~jO6kyEdNXQ29l9lO8MhNALbLYVZendbIcObaFLGSYeq795Gf5ZMXiYT5Yz3pRFjpv2UAM8SCDrka1aMunuITqen2uh9qEDzVJ1zjxay~FHKm3znxrBbCdo~uzu-ZUhP4wL7sXMDFTac2itLtJL-NlJqlHgP5X96dwHUOl9vkSVI1SI-RMJhDPQj37viGsfkoQWyzGwA9n~~zCOIrce2vA19CMcLj7Htdl8ylidJAYbN~IwUWbE5vc~nEXaKwbvmM6K0yyXsI1Ugk7aWovI~ny5FGR-x7QWWIt9j4IvotHSjDENTWH0VPg83sQUWFh3PFw__&Key-Pair-Id=APKAIE5G5CRDK6RD3PGA)
Interactive effects among ODI in the (sub)cortex, ODI in the LC, and plasma GFAP. Note: left: illustrative maps of A) cortical and C) subcortical regions with significant interactive effects (pFDR < 0.05) between LC ODI values and plasma GFAP on (sub)cortical ODI values using bootstrapped linear regression models (5,000 replicates) corrected for age and sex. Left and right hemispheres were averaged for each ROI. Right: scatterplots showing the interactive relationship between LC ODI and plasma GFAP on B) the average of ODI in all 13 significant cortical regions and d) the average of ODI in all 6 significant subcortical regions. The gray area represents the range of GFAP values [above B) 150.84 pg/mL or above D) 145.55 pg/ml] where LC ODI was positively associated with (sub)cortical ODI. For visualization purposes, LC ODI values are shown as mean, + and −1 standard deviation, but analyses were performed continuously. Raw data points are overlaid to the predicted regression line. Shaded areas surrounding the regression lines represent the 95% confidence interval of the regression fit.
Sensitivity analyses confirmed these interaction results for both NODDI cortical and subcortical parameters when controlling for LC intensity, except for the banks region becoming significant in the ODI cortical model (Supplementary Table 18, 19, 20 and 21), or when controlling for APOE ε4 carriership (Supplementary Table 22, 23, 24 and 25). Running all the previous models in a subsample of individuals aged 50 and older yielded similar results, although in a more restricted set of regions likely due to the smaller sample size (n = 43): plasma GFAP was negatively associated to cortical NDI in 2 regions (pericalcarine and insula). However, no association was observed between plasma GFAP and subcortical NODDI metrics after adjusting for multiple comparisons. The interaction between LC ODI and plasma GFAP was associated with cortical ODI in the same regions, and in 2 additional regions (lingual and frontal pole), and with subcortical ODI in the same regions but the thalamus.
Independent and interactive relationships of imaging metrics and GFAP on PACC
After averaging the NODDI metrics across the 23 cortical or the 6 subcortical regions included, higher PACC-score was associated with higher NDI in the cortex (P = 0.009) and subcortex (P = 0.001), and with higher subcortical ODI (P = 0.016; Fig. 4). We observed trend-level associations between cortical ODI and PACC (P = 0.05), and between GFAP and PACC (P = 0.09), such that higher PACC was associated with higher cortical ODI and lower GFAP levels. We found no association between the LC NODDI metrics or LC intensity and PACC performance (all P > 0.47). Given that the cortical and subcortical NODDI relationships with LC NODDI metrics were dependent on GFAP, we also explored the interactive relationships of GFAP with cortical, subcortical, and LC NODDI metrics and found no evidence for GFAP moderating the NODDI measures to cognition relationships (all P > 0.53; Supplementary Table 26).
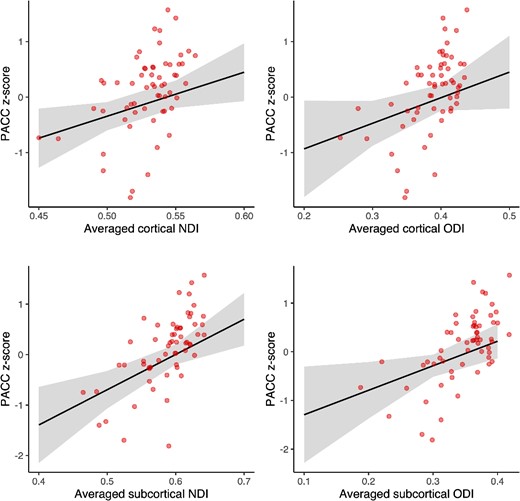
Association between (sub)cortical NODDI metrics and PACC-score. Note: relationships between the averaged cortical (23 regions) or subcortical (6 regions) NODDI metrics and PACC z-score: higher PACC is associated with higher NDI in the cortex (P = 0.009) and the subcortex (P = 0.001), and higher ODI in the subcortex (P = 0.016) and the cortex at a trend-level (P = 0.05). Bootstrapped (5,000 iterations) linear regression models are corrected for age, sex, and education. Raw data points are overlaid to the predicted regression line. Shaded areas surrounding the regression lines represent the 95% confidence interval of the regression fit.
Discussion
Accumulating evidence implicates the LC–NE system in age–related brain changes, in particular through its modulation of neuroinflammation (Feinstein et al. 2002; Heneka et al. 2010; Mather and Harley 2016). Furthermore, morphological changes to the LC neurons and projections, and the associated loss in noradrenergic input have been related to advanced brain aging processes, reduced neuroimmune mechanisms, and the progression of pathologic changes associated with neurodegenerative diseases such as AD (Feinstein et al. 2016; Evans et al. 2022). Here, we related indices of neurite density (i.e. NDI) and organization (i.e. ODI) in the LC to those of cortical and subcortical regions using 7T MRI and examined the impact of astroglial activation on these relationships. Consistent with previous animal studies, lower arborization complexity (as indexed by ODI metrics) in LC neurites was associated with lower arborization complexity in frontotemporal cortical regions and in all the 6 subcortical regions, in particular, under elevated astrocyte reactivity (above ~ 150 or ~ 145 pg/mL). Interestingly, among individuals with higher LC neurite arborization complexity, the negative effect of elevated astrocyte reactivity on (sub)cortical microstructure was attenuated. These findings support that the health of LC neurites play a critical role in supporting cortical and subcortical regions, even in the context of elevated astrocyte reactivity. While we cannot establish causality, animal studies suggest that the health of LC neurites may possibly modulate astrocyte profiles toward a deleterious or protective signal. These findings underscore the importance of supporting LC neuronal health in adulthood before the emergence of age–related neurodegenerative processes.
We confirmed previous animal and human studies that older age was associated with worse microstructural properties in the brain (Pannese 2011; Dickstein et al. 2013) and with higher astrocyte reactivity (Nichols et al. 1993). Astrocytes interact directly with neuritic processes and are involved in neuroinflammatory mechanisms. They play an important role in pruning synapses and maintaining the connections between presynaptic terminals and dendritic spines, but can become reactive during aging and in response to pathology (Price et al. 2021). This overexpression of GFAP is considered an early process in the preclinical stages of AD (Asken et al. 2020; Benedet et al. 2021; Chatterjee et al. 2021). Recently, Bettcher et al. (2021) showed that among the entire spectrum of cognitively normal individuals to AD patients, elevated plasma GFAP levels were associated with lower white matter integrity as indexed by FA in a medial temporal white matter aggregate and a white matter AD vulnerable aggregate, consisting of the hippocampal portion of the cingulum, dorsal portion of the cingulum, fornix crus, sagittal stratum, and corpus callosum (Bettcher et al. 2021). Given that astrocyte reactivity has been associated with dendritic damage (Price et al. 2021), we evaluated the relationship between gray matter neurites and astrocyte reactivity and observed that higher astrocyte reactivity was associated with lower density of neurites (i.e. NDI) in the hippocampus, the amygdala and frontal brain regions. Interestingly, Thaker et al. (2023) reported that higher GFAP levels were related to lower neurite orientation dispersion (i.e. ODI) in regions vulnerable to AD, an effect strongly driven by women, but found no association with neurite density (Thaker et al. 2023). Astrocyte reactivity was also related to a steeper increase in temporal and parietal mean diffusivity, possibly reflecting the microstructural changes occurring during AD-related neuroinflammatory processes (Spotorno et al. 2023). While our dispersion metrics demonstrated the opposite, a negative relationship—higher GFAP was associated with lower neurites orientation dispersion in the parahippocampus and frontal regions, these models did not survive correction for multiple comparisons. Importantly, these regions are well known for their structural and functional vulnerability in aging (Salat et al. 2004). Astrocytes can exhibit both aberrant disease-related as well as beneficial changes in the earliest stages of the disease, and thus it is possible that these opposing relationships reflect different functional aspects of GFAP or disease stages. This will require a more in-depth investigation in larger cohorts covering the entire spectrum of the disease. Together, our results are largely consistent with the previous AD literature and extend these findings to the adult lifespan, showing that astrocyte reactivity is linked to microstructural brain damage during aging.
It is possible that these astrocyte-related microstructural brain changes may reflect, spur, or interact with other early AD-related processes (Jacobs et al. 2021b). One of the earliest sites of hyperphosphorylated tau pathology in early adulthood is the LC. While several studies have investigated LC integrity using dedicated MRI techniques, only a handful of them have investigated microstructural properties of the LC, such as neurite morphology and organization during aging or the preclinical stages of AD. Studies using standard diffusion methods demonstrated that diffusivity was lower and FA higher in the LC of older individuals compared to younger individuals (Langley et al. 2020; Porat et al. 2022). They speculated that this association reflected increased neuroinflammation, as microglia activation and therefore increased microglia density is known to restrict diffusivity. Even though we did not observe a direct relationship between LC integrity and astrocyte reactivity, we indeed found a synergistic effect between the LC NODDI metrics and microglial activation, as lower arborization complexity in the LC was associated with lower arborization complexity in widespread frontal and temporal cortical regions, when GFAP level was above ~ 150 pg/mL. Similar interactive relationships were found in the hippocampus, caudate, amygdala, putamen, pallidum, and thalamus, when GFAP level was above ~ 145 pg/mL. When the LC displays a higher arborization complexity, we find that arborization complexity in the (sub)cortex remains high despite the presence of elevated levels of astrocyte reactivity. The fact that both the LC and the (sub)cortex exhibit higher levels of arborization complexity indicates that astrocyte reactivity has no instantaneous negative effect on brain health or that the LC is able to provide neural resilience. Animal work demonstrated that LC–NE neurons can alter cortical responses and neural network dynamics via its influence on astrocytes (Bekar et al. 2008). Whether the LC–NE system counterbalances the deleterious effects of elevated astrocyte reactivity, possibly through glutamate-related co-activation, or may steer astrocyte signaling in neuroprotective pathways remains unclear (Garwood et al. 2017). Topographically, these GFAP-dependent associations between the LC and (sub)cortex were observed in the prefrontal, temporal, entorhinal cortices, hippocampus, thalamus and amygdala regions that are known to be highly connected to and regulated by the LC–NE system (Samuels and Szabadi 2008; Chandler et al. 2014; Dahl et al. 2022a). In addition, these regions are specifically vulnerable to aging and the earliest stages of AD (Eustache et al. 2016; Jacobs et al. 2021a; van der Velpen et al. 2023). Importantly, these findings highlight the neuroprotective effects the LC–NE system can have on brain health and stress the importance of maintaining LC neuronal health early in adulthood and in the prevention of age-related neurodegenerative diseases (Wilson et al. 2013; Mather and Harley 2016; Dahl et al. 2019).
It is worth noting that these findings were independent of both APOE ε4 status and LC macrostructural integrity, as measured with the MT-TFL sequence, indicating that they are capturing different underlying biological processes. The negative trend-level relationship between LC integrity and LC neurite orientation dispersion was unexpected, but may indicate that higher neuronal integrity is associated with dendrites in a less sprawling, more organized pattern. The distribution of neurons in the LC is characterized by a densely packed clustering of dendrodendritic opposed neurons (Totah et al. 2018). It is conceivable that, under the influence of pathologic processes, this organization becomes more dispersed due to neuronal swelling or changes in dendritic arborization. In gray matter, the ODI parameter is thought to reflect dendritic arborization complexity, while the source of the commonly used structural LC contrast scans remains largely unknown, with hypothesized contributions from neuromelanin cells density, copper, water, and tau pathology (Priovoulos et al. 2020; Jacobs et al. 2021a). As our cohort consists of cognitively normal individuals along the adult lifespan, we are not able to examine how the contribution of these different LC markers evolves from healthy aging to AD. However, as our findings are similar in the entire cohort as in the ≥50-year-old individuals, and our GFAP threshold was equivalent to that identified in larger cohorts examining preclinical AD (Benedet et al. 2021), we speculate that the NODDI parameters in the LC capture earlier, subtle changes compared to the LC macrostructural integrity metrics, and may presage the earliest processes related to age–related neurodegenerative diseases.
The LC is known to shape cognition through its modulatory effect on the cortex and subcortex. While we found no direct associations between LC NODDI metrics and cognition, we did see that higher cortical NDI values (and ODI at trend-level) and higher subcortical NDI and ODI values were associated with higher PACC performance. Cortical neurite density has been reported to be a sensitive marker of cortical changes that precede cognitive impairments (Vogt et al. 2022). The patterns for ODI versus NDI that we observed between the LC and supratentorial regions were very similar for the cortex and the subcortex. Even though GFAP modulated the relationship between LC and (sub)cortical NODDI metrics, we did not see an interaction between GFAP and NODDI metrics in association with cognition. This is not surprising given the moderate size of our sample and the fact that all our individuals are cognitively normal. Detecting complex behavioral associations may require longitudinal observations, as cognitive changes are expected to occur downstream of the AD–related brain changes. Future studies should also include cognitively impaired individuals as well as longitudinal data to better understand the temporal ordering of the brain-behavior events in aging and disease-related processes.
The strengths of our study include innovative in vivo investigation of the LC microstructure through the combination of a LC-specific sequence at UHF MRI and advanced NODDI, providing more sensitive detection of subtle age-related changes. However, our study has limitations. First, the sample size is relatively moderate due to the strict inclusion criteria at 7T and only includes cognitively healthy individuals, limiting the generalizability of our findings. Considering larger cohorts with patients at different stages of AD and longitudinal follow-up will provide replication of our findings and more insight into the evolution of these LC-astrocyte relationships with cortical health across disease progression. Second, DWI is limited by its spatial resolution and its partial field of view. While the use of 7T NODDI MRI along with the MT-weighted sequence increased the reliability of our anatomic localization of the LC, 11 cortical regions out of 34 had to be excluded from the analyses. Enlarging the field of view would be at the cost of increased acquisition time and could introduce motion artifacts but would allow for a complete investigation of the cortex. Finally, we measured GFAP in blood and not in the cerebrospinal fluid. It has been reported that blood measures of GFAP exhibit a low variability and were superior in predicting AD-pathology in preclinical AD, compared to its cerebrospinal fluid (CSF) counterpart (Benedet et al. 2021; Simrén et al. 2022). Furthermore, the GFAP marker only stains sub-population of astrocytes, limiting the generalizability of our findings to the entire astrocyte population.
Conclusion
To conclude, our findings show that lower neurite arborization complexity of the LC was associated with lower cortical and subcortical arborization complexity in the context of astrocyte reactivity. Interestingly, individuals with higher neurite arborization in the LC also displayed higher (sub)cortical arborization, despite the presence of astrocyte reactivity, indicating that the LC–NE cells and astrocytes are closely intertwined, and their interaction may set off either a detrimental or neuroprotective pathway in aging. These findings signal the importance of maintaining LC neuronal health early in adult life and suggest that microstructural measures of the LC may detect potentially very early age–related neurodegenerative disease changes. Future research is needed to elucidate the temporal sequence of these processes and how the support of the LC–NE system could be used in interventions delaying the progression of AD.
Author contributions
Elise Beckers (Conceptualization, Formal analysis, Methodology, Software, Visualization, Writing—original draft, Writing—review & editing), Maxime Van Egroo (Resources, Software, Supervision, Writing—review & editing), Nicholas J Ashton (Resources, Writing—review & editing), Kaj Blennow (Resources, Writing—review & editing), Gilles Vandewalle (Supervision, Writing—review & editing), Henrik Zetterberg (Resources, Writing—review & editing), Benedikt A Poser (Resources, Writing—review & editing), and Heidi IL Jacobs (Conceptualization, Formal analysis, Funding acquisition, Methodology, Project administration, Supervision, Writing—original draft, Writing—review & editing).
Funding
This work was supported by the Alzheimer Nederland (major award WE.03-2019-02 to HILJ), the National Institutes of Health (R01AG062559, R01AG06806, R01AG082006, and R21AG074220 to HILJ), the BrightFocus Foundation (A20211016F to MVE), the Marie Skłodowska-Curie Actions (101109451-ADEEPSLEEP to MVE), and the University of Maastricht—ULiège Imaging Valley (to EB, HILJ, and GV). GV is supported by the Belgian Fonds de la Recherche Scientifique (FRS-FNRS; CDR J.0222.20 and PDR T.0242.19) and the University of Liège (ULiège). HZ is a Wallenberg Scholar and a Distinguished Professor at the Swedish Research Council supported by grants from the Swedish Research Council (#2023-00356, #2022-01018, and #2019-02397), the European Union’s Horizon Europe Research and Innovation Program under grant agreement number 101053962, Swedish State Support for Clinical Research (#ALFGBG-71320), the Alzheimer Drug Discovery Foundation (ADDF), USA (#201809-2016862), the AD Strategic Fund and the Alzheimer’s Association (#ADSF-21-831376-C, #ADSF-21-831381-C, #ADSF-21-831377-C, and #ADSF-24-1284328-C), the Bluefield Project, Cure Alzheimer’s Fund, the Olav Thon Foundation, the Erling–Persson Family Foundation, Stiftelsen för Gamla Tjänarinnor, Hjärnfonden, Sweden (#FO2022-0270), the European Union’s Horizon 2020 Research and Innovation Program under the Marie Skłodowska-Curie grant agreement number 860197 (MIRIADE), the European Union Joint Programme—Neurodegenerative Disease Research (JPND2021-00694), the National Institute for Health and Care Research University College London Hospitals Biomedical Research Centre, and the UK Dementia Research Institute at UCL (UKDRI-1003). KB is supported by the Swedish Research Council (#2017-00915), the ADDF, USA (#RDAPB-201809-2016615), the Swedish Alzheimer Foundation (#AF-930351, #AF-939721, and #AF-968270), Hjärnfonden, Sweden (#FO2017-0243 and #ALZ2022-0006), the Swedish state under the agreement between the Swedish government and the County Councils, the ALF-agreement (#ALFGBG-715986 and #ALFGBG-965240), the European Union Joint Program for Neurodegenerative Disorders (JPND2019-466-236), the National Institute of Health, USA, (#1R01AG068398-01), and the Alzheimer’s Association 2021 Zenith Award (ZEN-21-848495).
Conflict of interest statement: HILJ is chair of the neuromodulatory subcortical systems professional interest area of Alzheimer’s Association International Society to Advance Alzheimer’s Research and Treatment (ISTAART) and advisory board member of ISTAART. NJA has given lectures in symposia sponsored by Eli Lily. HZ has served at scientific advisory boards and/or as a consultant for Abbvie, Acumen, Alector, Alzinova, ALZPath, Amylyx, Annexon, Apellis, Artery Therapeutics, AZTherapies, Cognito Therapeutics, CogRx, Denali, Eisai, Merry Life, Nervgen, Novo Nordisk, Optoceutics, Passage Bio, Pinteon Therapeutics, Prothena, Red Abbey Labs, reMYND, Roche, Samumed, Siemens Healthineers, Triplet Therapeutics, and Wave, has given lectures in symposia sponsored by Alzecure, Biogen, Cellectricon, Fujirebio, Lilly, Novo Nordisk, and Roche, and is a co-founder of Brain Biomarker Solutions in Gothenburg AB (BBS), which is a part of the GU Ventures Incubator Program (outside submitted work). KB has served as a consultant, at advisory boards, or at data monitoring committees for Abcam, Axon, BioArctic, Biogen, JOMDD/Shimadzu, Julius Clinical, Lilly, MagQu, Novartis, Ono Pharma, Pharmatrophix, Prothena, Roche Diagnostics, and Siemens Healthineers, and is a co-founder of Brain Biomarker Solutions in Gothenburg AB (BBS), which is a part of the GU Ventures Incubator Program. All other authors report no conflict of interest.
Data availability
Participants did not explicitly consent to their data being made public and, therefore, access to their demographic, raw, or processed imaging data is restricted.
Requests for the anonymized data should be made to Heidi Jacobs (www.heidijacobs.nl; [email protected] or [email protected]) and will be reviewed by an independent data access committee, taking into account the research proposal and intended use of the data. Requestors are required to sign a data sharing agreement to ensure participants’ confidentiality is maintained prior to release of any data and that procedures conform to the EU legislation on the general data protection regulation and local ethical regulations.