


Abstract
Type I Interferon (IFN) induced gene expression analysis (“IFN signature”) is employed to categorize pathological conditions that exhibit Type I IFN dysregulation and to direct customized therapeutic strategies. For instance, it is used to differentiate patients with IFN-related inflammation from those with conditions primarily mediated by other cytokines, such as juvenile idiopathic arthritis and periodic fevers. Nevertheless, there is currently no standardized method available for clinical practice, and comparing values at different time points or between centers poses a challenge. In this work, we described a standardized method based on the development and validation of a synthetic control to solve the problem of test comparison.
Inter-assay and inter-laboratory variability were assessed by multiple repeated analyses within the same laboratory, and between two different laboratories involved in the study. The method has been validated by evaluating the IFN signature of 39 patients with inflammatory disorders known to be related or not to Type I IFN (i.e. monogenic interferonopathies, systemic lupus erythematosus, juvenile dermatomyositis, periodic fevers, and juvenile idiopathic arthritis).
The proposed method proved to be highly reproducible among centers and able to discriminate among IFN-related or non-IFN-related inflammation.
The use of a synthetic control minimized the inter-assay and inter-laboratory variability, and thus facilitate data sharing among centers to improve knowledge of IFN-related inflammation and patient’s care.
Introduction
Type I interferon (IFN) production is a conserved defense mechanism of the innate immune system triggered by the activation of specific nucleic acids receptors mostly during viral and bacterial infections [1]. After the identification of IFNs (the 1950s–60s) [2], the first evidence of the role of IFN inflammation in non-infectious disorders arose from studies in systemic lupus erythematosus (SLE) in the late 1970s [3].
The observation that SLE is characterized by the over-expression of genes related to the IFN pathway (IFN-stimulated genes, ISGs) led to the identification of a specific subset of genes correlating to the activation of Type I IFN, referred to as “Type I IFN signature (IFN signature)” [4]. More recently, the characterization of a new group of mendelian disorders with dysregulated IFN-driven inflammation, named Type I interferonopathies (T1I), shed light on the regulatory mechanisms of IFN response. It is worth noting that some T1I display significant clinical and biological overlap on one side with inborn TORCH (Toxoplasmosis, Rubella, Cytomegalovirus, and Herpes simplex) and HIV infections, and on the other side with rheumatological disorders like SLE [3, 5, 6]. Similar to SLE, T1I is characterized by a Type I IFN signature in peripheral blood [7].
Due to technical challenges in the direct measurement of serum Type I IFNs, IFN signature soon became a valuable surrogate biomarker of IFN inflammation. Thus, after studies in SLE [8, 9], the IFN signature analysis is increasingly used in biomedical centers for the biological classification of disorders characterized by a Type I IFN dysregulation like monogenic T1I, SLE, and juvenile dermatomyositis (JDM), compared with inflammatory disorders driven by other cytokines, such as TNFɑ or IL-1β, for periodic fevers (PF) and juvenile idiopathic arthritis (JIA) [6, 10, 11].
Even though IFN signature assessment has become diffusely available at research hospitals, several sets of ISGs (more or less numerous) and analytical methods are currently used to evaluate and quantify IFN-mediated inflammation [11–17]. Despite existing research emphasizing the benefits and applications of robust methodologies for analyzing the IFN signature via both Real Time-quantitative PCR (RT–qPCR) and Nanostring (whose practical advantages primarily consist in the automation of the analytical process and multiplexing capacities), the reproducible integration of this technique into standard clinical practice continues to pose significant challenges.
The most used approach is based on the relative quantification of the expression of six ISGs using a healthy donor control (calibrator) as a reference. However, the calibrator variability between centers and even between different samples in the same centers makes it difficult to compare values at different time points or between different centers. An IFN signature based on hybridization techniques non-requiring gene amplification and the use of calibrators has been validated [13]; however, its use is currently limited by the scarce availability of the required instrumentation in the clinical setting and in non-research centers.
To overcome these limitations and facilitate data comparison, we developed a standardized strategy based on the use of a synthetic control to quantify the expression of ISGs by RT–qPCR without the need for an internal biological calibrator.
Materials and methods
Study design
Patients referred to the Rheumatology and Autoinflammatory Diseases Unit of IRCCS Istituto Giannina Gaslini of Genoa (reported as Unit 1, U1) and to the Pediatric Rheumatology Unit of the IRCCS Burlo Garofolo of Trieste (Unit 2, U2) from 2017 to 2023 were considered for the study. Subjects’ enrolment was directed toward patients with a diagnosis of juvenile SLE (JSLE), JDM, monogenic T1I, or other classified inflammatory diseases (such as PF and JIA).
Forty healthy donors (HD) from U1 (N = 26, 10 female, age range 30–55 years) and U2 (N = 14, 11 female, age range 25–55 years) were used as controls.
The study has been carried out in accordance with The Code of Ethics of the World Medical Association (Declaration of Helsinki). For all participants, a written informed consent was obtained in accordance with the study protocol BI01 approved by the local Institutional Review Board for IRCCS Istituto Giannina Gaslini, and protocol RC24/17 and RC30/22 approved by the local Institutional Review Board for IRCCS Burlo Garofolo.
Sample collection, RNA isolation, cDNA preparation, and RT-qPCR amplification
Peripheral blood samples of patients and HD were collected in PAXgene Blood RNA Tubes and total RNA was purified using the PAXgene Blood RNA Kit (PreAnalytiX, CH). RNA samples were quantified and stored at –80°C until analysis. After retro-transcription of RNA (up to 1 μg, The SuperScript VILO cDNA Synthesis Kit, Thermo Fisher Scientific, USA), cDNAs were stored at –20°C. Real-time PCR was performed on a ViiA 7 Real-Time PCR System (Applied Biosystems, Thermo Fisher Scientific, USA) in Genoa center and CFX Opus Real-Time PCR System (Bio-Rad, USA) in Trieste.
Bioinformatics evaluation of housekeeping genes
A panel of possible reference genes including ALAS1, TUBB, TBP, HPRT1, and G6PD was evaluated in terms of expression stability as follows: whole blood of 25 patients and 10 HD were collected in Trieste Hospital and for RNA sequencing analysis. Given IFI27 gene expression variability between patients and HD, the gene was used as a positive control.
RNAseq raw data workflow analysis has been conducted as follows: quality control by FastQC (https://www.bioinformatics.babraham.ac.uk/projects/fastqc/), quality filtering by Trimgalore, read alignment to hg38 using annotation from GENECODE (https://www.gencodegenes.org/) with STAR aligner software, reads counting into genes by featureCounts package. Data has been normalized using the function vst (variance stabilizing transformations) in DESeq2 (Bioconductor R package).
Variance across subjects was calculated using the coefficient of variation. Genes with a coefficient of variation lower than 0.05 were considered stable.
Synthetic control design and production
A synthetic oligonucleotide was designed containing the regions of the eight genes (IFI27, IFI44L, IFIT1, ISG15, RSAD2, SIGLEC1, TBP, and HPRT1) recognized by commercially available RT-qPCR primers and probes used in the original description of the six-genes IFN signature method [7] (gBlocks, IDT, USA) and NotI and XhoI sequence at 5′ and 3′, respectively. The oligonucleotide was cloned into pCR 2.1 plasmid (Invitrogen, Thermo Fisher Scientific, USA) after digestion with NotI and XhoI. The plasmid is available at Addgene (#231488).
Validation of the synthetic control: assessment of inter-assay and inter-laboratory variability
To assess the technical variability: (i) 3 dilutions of the synthetic control (106, 104, and 102 copies) were replicated 10 times by the same operator from U1; (ii) 3 dilutions of the synthetic control (106, 104, and 102 copies) were run by two different operators, each from U1 and U2; (iii) patient and HD samples were assayed by two operators, each from U1 and U2 respectively, to calculate and compare the resulting IFN score.
IFN signature analysis with the synthetic control
IFN Signature was assessed by calculating the expression of six ISGs (IFI27, IFI44L, IFIT1, ISG15, RSAD2, and SIGLEC1). RT-qPCR was performed in duplicate using prefilled standardized plates (TibMolBiol, Roche, Germany) containing gene-specific primers and TaqMan probes. Gene copy numbers were calculated as follows: (1) in each run standard curves were prepared for each gene with 10-fold serial dilutions of the synthetic control; (2) curves were generated by linear regression analysis, using the function Y = mX + b, where Y is the Ct, m is the slope of the regression line (calculated as where x and y are the sample means AVERAGE(known_x’s) and AVERAGE(known_y’s)) and b is the estimated intercept plotting the Ct value in the Y-axis vs the logarithm of the starting RNA dilutions in the X-axis; (3) values representing gene expression, extrapolated from the standard curve, were normalized with the geometric means of two controls (TBP and HPRT1) and expressed as gene score (GS) concurrently analyzed on the same plate; (4) IFN score (IS) is calculated as the geometric mean of the GS of the six ISGs. The IS cut-off value was determined based on 40 HD (using the mean + 2 standard deviations of their IFN scores) to classify as positive/negative the IFN signature analysis (normal values < 0.66).
Statistical analyses
Data analysis was performed using Prism 8 software (GraphPad, USA); P-values < 0.05 will be considered statistically significant.
Data will be reported as mean ± standard error of the mean (SEM).
Results
Subjects
Thirty-nine patients with various inflammatory disorders known to be related or not to type I IFN were included in the study: JSLE (n = 8), JDM (n = 9), T1I (n = 7), PF (n = 7) and JIA (n = 8). Patients’ data and genetics details are displayed in Tables 1 and 2.
data of patients classified by diagnosis
| Diagnosis | Female/male | Age (years mean; min–max) |
|---|---|---|
| JSLE (n = 8) | 6/2 | 12 (7–17) |
| JDM (n = 9) | 2/7 | 9 (4–15) |
| Interferonopathy (n = 7) | 5/2 | 10 (3–15) |
| COPA (n = 3) | 3/0 | 8 (3–15) |
| AGS (n = 2) | 0/2 | 8 (5–10) |
| SAVI (n = 2) | 2/0 | 15 (14–15) |
| PF (n = 7) | 3/4 | 5 (2–8) |
| JIA (n = 8) | 6/2 | 7 (1–18) |
Abbreviations: AGS: Aicardi–Goutières syndrome; COPA: coatomer protein complex subunit alpha; JDM: juvenile dermatomyositis; JIA: juvenile idiopathic arthritis; JSLE: juvenile systemic lupus erythematosus; PF: periodic fevers; SAVI: STING (stimulator of interferon genes) associated vasculopathy with onset in infancy.
genetic details for patient classification
| Patient n | Sex | Age (years) | Diagnosis | Gene | Genetics | Inheritance |
|---|---|---|---|---|---|---|
| 18 | F | 6 | COPA | COPA | c.841C > T; p.Arg241Trp | het |
| 19 | F | 3 | COPA | COPA | c.841C > T; p.Arg241Trp | het |
| 20 | M | 5 | AGS | ADAR1 | c.3019G > A; p.Gly1007Arg | het |
| 21 | M | 10 | AGS | RNASEH2B | c554T > G, p.Val185Gly | homo |
| 22 | F | 15 | COPA | COPA | c.698G > A; p.Arg233His | het |
| 23 | F | 15 | SAVI | STING | c.842G > A; p.Arg281Gln | het |
| 24 | F | 14 | SAVI | STING | c.463G > A; p.Val155Met | het |
Abbreviations: ADAR1: adenosine deaminase RNA specific 1; AGS: Aicardi–Goutières syndrome; COPA: coatomer protein complex subunit alpha; het: heterozygosis; homo: homozygous; RNASEH2B: ribonuclease H2 subunit B; SAVI: STING associated vasculopathy with onset in infancy; STING: stimulator of interferon genes.
Housekeeping genes choice
HPRT1 and TBP genes were chosen based on the low expression variability in 10 HD samples and 25 patients affected by various inflammatory disorders known to be related or not to Type I IFN (Supplementary Tables 1 and 2).
Inter-assay and inter-laboratory variability of the test
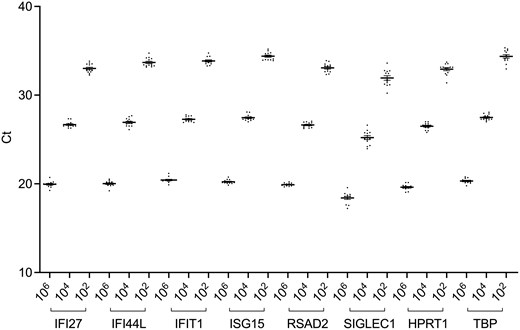
The inter-assay variability has been evaluated by running three dilutions of the synthetic control (106, 104, and 102 copies) 13 times by the same operator in U1. Both visually (Fig. 1) and statistically (coefficient of variation for all repetitions is <0.03) the method shows strong reproducibility.

inter-assay variability of the synthetic control (106, 104, and 102 copies). The graph shows the analysis for each of the eight genes (Ct: cycle threshold)
To assess the inter-laboratory variability, 3 dilutions of the synthetic control (106, 104, and 102 copies) were run 10 times by one operator from U1, and one from U2. Figure 2 displayed data reproducibility by linear regression.
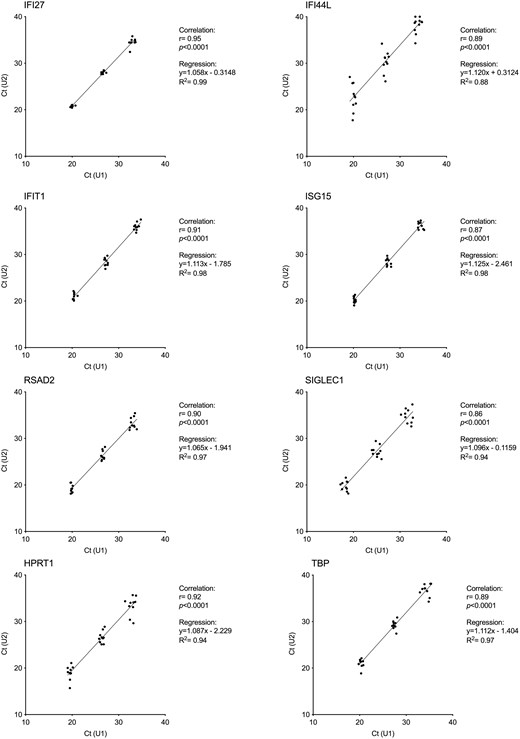
inter-laboratory variability of the synthetic control (106, 104, and 102 copies) between U1 and U2. The graph shows the analysis for each of the eight genes (Ct: cycle threshold)
The test demonstrated a high reproducibility as proven by multiple analyses of the same sample (R2 > 0.94 for all genes except IFI44L, R2 = 0.88).
We calculated the HD IS limit (0.66, Fig. 3) based on 40 healthy controls, a sample size above what we proved to be appropriate for the peripheral blood six-genes IFN score [18], and compared the results obtained in U1 and U2, showing a robust correlation, for each of the eight genes (Fig. 4) (R2 > 0.95).
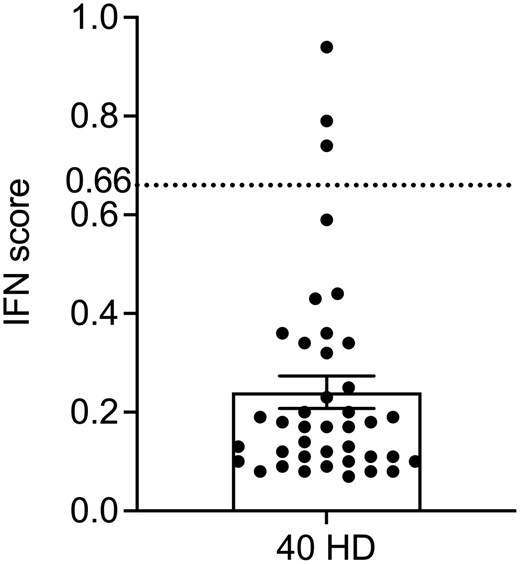
IFN score cut-off value (0.66) was calculated on 40 healthy donors (HD) as the mean + 2 standard deviations of the HD’s IFN scores (dashed line)

inter-laboratory comparison of gene scores (GS) of the eight genes calculated in U1 and U2 for the same four patients with juvenile systemic lupus erythematosus (JSLE) and three patients with juvenile dermatomyositis (JDM)
Moreover, Fig. 5 showed that all samples with a negative score (4 HD and 1 JDM) resulted in negative in both labs and samples with a positive score (4 JSLE and 2 JDM) tested positive. The mean variability among positive samples between the two Units was ±1% (Supplementary Table 3).

inter-laboratory comparison of IFN scores calculated in U1 and U2 of the same subjects (4 healthy donors and 7 patients). The dashed line represents the cut-off value
IFN Score in patients with inflammatory conditions
As expected, the IFN score resulted in positive (>0.66) in IFN-related inflammatory diseases such as T1I, JSLE and JDM with active disease (Fig. 6). All patients affected by the first two conditions present a positive IS, while JDM displayed more variability (60% of IS-positive patients), as reported in Table 3.
IS results (percentage of the positive test, mean IS values, min–max) in patients classified by diagnosis
| Diagnosis | % of positive IS (>0.66) | Mean IS (min–max) |
|---|---|---|
| Interferonopathy (n = 7) | 100 | 6.99 (1.66–13.63) |
| COPA (n = 3) | 100 | 3.41 (1.66–5.23) |
| AGS (n = 2) | 100 | 12.08 (10.53–13.63) |
| SAVI (n = 2) | 100 | 7.28 (6.07–8.48) |
| JSLE (n = 8) | 100 | 6.75 (2.35–10.36) |
| JDM (n = 9) | 60 | 3.43 (0.07–8.92) |
| PF (n = 7) | 28.6 | 0.45 (0.08–1.60) |
| JIA (n = 8) | 0 | 0.19 (0.06–0.39) |
Abbreviations: AGS: Aicardi–Goutières syndrome; COPA: coatomer protein complex subunit alpha; IS: interferon score; JDM: juvenile dermatomyositis; JIA: juvenile idiopathic arthritis; JSLE: juvenile systemic lupus erythematosus; PF: periodic fevers; SAVI: STING (stimulator of interferon genes) associated vasculopathy with onset in infancy.
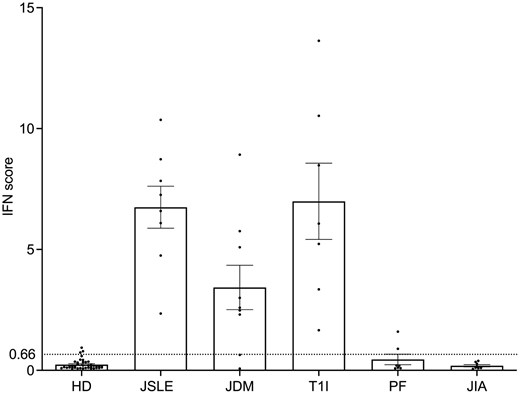
IFN score of 40 healthy donors (HD) and 39 patients with different inflammatory conditions: N = 8 with juvenile systemic lupus erythematosus (JSLE), N = 9 with juvenile dermatomyositis (JDM), N = 7 with Type 1 interferonopathy (T1I), N = 7 with periodic fevers (PF), N = 8 with juvenile idiopathic arthritis (JIA). The dashed line represents the cut-off value (0.66)
Other inflammatory disorders (PF and JIA) resulted in negative, unlike a few PFs, which showed a modest positivity.
Discussion
The demonstration of the activation of a Type I Interferon (IFN) pathway in a subset of sporadic [19] and inherited [7] diseases has led to the implementation and study of analytical methods able to discriminate the presence of Type IIFN activation. The early recognition of IFN-related biomarkers in affected individuals is of clinical relevance considering the recent introduction of specific anti-IFN treatments, with long term clinical efficacy potential [20].
Detection of Type I IFN proteins in plasma is technically challenging, due to their biological potency at concentrations below the threshold of standard techniques used in most diagnostic laboratories. For this reason, several indirect tests have been developed, with gene expression-based ones (commonly named “Type I IFN signatures”) being the most used in recent years. The IFN signature analysis takes advantage of the characteristic overexpression of IFN-stimulated genes (ISGs) in IFN-driven disorders, and it is currently used in many centers as a surrogate biomarker of IFN inflammation to differentiate and classify patients with IFN-related inflammation [11, 20–23].
Several sets of ISGs have been employed to assess IFN inflammation, and differences in gene set and/or internal controls make data comparison between centers difficult, thus increasing the need for a standardized method that minimizes inter-assay and inter-laboratory variability. The six-genes IFN signature described in 2013 for the identification of Aicardi–Goutières syndrome [7] has been used in our centers for several years and applied to help to discriminate several inflammatory conditions.
The main disadvantage of quantitative PCR-based (RT–qPCR) IFN signatures is that they reflect a relative quantification of the six ISGs between the sample analyzed and an internal control sample. The result is therefore strictly dependent on the specific control sample. When using a small number of healthy controls for data normalization, it is important to consider the natural variability in gene expression even in the absence of external factors, such as asymptomatic infections. The same samples might therefore have different IFN score results when using different controls.
We already reported an initial attempt to standardize the method using a pool of healthy individuals as a control to minimize variability and obtain comparable results across centers [18]. This strategy, however, is still based on a relative quantification and it is therefore dependent on the healthy controls selected as calibrators.
To overcome these limit we focused on a standardization approach that could be used in most clinical centers: a synthetic control represented by a plasmid containing an insert with the sequences of the tested genes. The possibility of obtaining a standard curve for each test run allows quantifying the sample’s gene expression without the need for a biological internal control, thus overcoming the limitation represented by the use of a calibrator.
Overall, the system proved to be reproducible between our two centers, with low variability likely resulting from both the operator and the instrument used. We validated its use in 39 patients, obtaining results consistent with the patient’s clinical diagnosis: subjects with inflammatory disorders known to be related to Type I IFN (juvenile systemic lupus erythematosus, juvenile dermatomyositis, and monogenic interferonopathies) showed positive IFN signatures, differently from those conditions driven by other cytokines (juvenile idiopathic arthritis and periodic fevers).
While other quantitative tests have been developed to assess Type I IFN, they require technologies not present in most centers [13, 24].
Our innovative method described in the present study only requires standard RT–qPCR instruments, which are available in most diagnostic labs. It also helps overcome the limitation of existing strategies to assess Type I IFN activation. The synthetic control used in this publication is available to all interested centers, can be validated on internal case series and used reproducibly in laboratory practice since it represents a standardized analysis for the identification and classification of IFN-driven diseases.
Conclusion
The analysis of the expression of a predefined set of ISGs, IFN signature, has helped clinicians for several years to identify, stratify and determine treatment responses in patients with suspected IFN-related inflammation.
The use of a standardized synthetic control might overcome the limitation of using healthy controls for the relative quantification of ISGs, minimize inter-assay and inter-laboratory variability encountered by working with different instrumentations, and represent a validated attempt to standardize RT–qPCR-based IFN signature analysis for data comparison, with the potential of increasing its clinical use and improving knowledge on IFN-related inflammation and finally patients’ care.
Abbreviations
- ADAR1
Adenosine Deaminase RNA specific 1
- AGS
Aicardi-Goutières syndrome
- ALAS1
5'-Aminolevulinate Synthase 1
- COPA
Coatomer protein complex subunit alpha
- G6PD
Glucose-6-Phosphate Dehydrogenase
- GS
Gene Score
- HD
Healthy Donors
- HPRT1
Hypoxanthine Phosphoribosyltransferase 1
- IFI27
Interferon Alpha Inducible Protein 27
- IFI44L
Interferon Induced Protein 44 Like
- IFIT1
Interferon Induced Protein with Tetratricopeptide Repeats 1
- IFN
Interferon
- IL-1β
Interleukin 1β
- IS
IFN Score
- ISG15
ISG15 Ubiquitin Like Modifier
- ISGs
IFN-stimulated genes
- JDM
Juvenile dermatomyositis
- JIA
Juvenile Idiopathic Arthritis
- JSLE
Juvenile SLE
- PF
Periodic Fevers
- RNASEH2B
Ribonuclease H2 subunit B
- RSAD2
Radical S-Adenosyl Methionine Domain Containing 2
- RT-qPCR
Real Time-Quantitative PCR
- SAVI
STING (stimulator of interferon genes) associated vasculopathy with onset in infancy
- SIGLEC1
Sialic Acid Binding Ig Like Lectin 1
- SLE
Systemic Lupus Erythematosus
- T1I
Type I interferonopathies
- TBP
TATA-Box Binding Protein
- TNFɑ
Tumor Necrosis Factor ɑ
- TORCH
Toxoplasmosis, Rubella, Cytomegalovirus, and Herpes simplex
- TUBB
Tubulin Beta Class I
Acknowledgments
The authors would like to thank patients and their families for participating in the study.
Ethical approval
The study has been carried out in accordance with The Code of Ethics of the World Medical Association (Declaration of Helsinki). A signed informed consent was obtained from patients’ parents/guardians, according to the IRB-approved protocols (BI01 approved for IRCCS Istituto Giannina Gaslini, and RC24/17 and RC30/22 for IRCCS Burlo Garofolo). An institutional consent form is available.
Conflict of interest: Speaker fees SOBI for R. C., M. G. and S. V. M. U. is an employee of TIBMolBiol that developed a commercial test related to the data presented in this manuscript.
Funding
The work was funded by “5x1000 2019 23680430” for IRCCS Istituto Giannina Gaslini of Genoa, "FIS 2021 grant 2235" for University of Genoa and “RC24/2017” and “RC30/2022” for IRCCS Burlo Garofolo of Trieste.
Author contributions
A. Te., M. U., F. C., M. G., A. To. and S. V.: study design; A. Te., P. B., M. U., A. P., C. P., D. C., E. S. and E. D.: methodology and software; R. C., F. C., M. G., A. To. and S. V.: patient data acquisition; A. Te., P. B., A. P., C. P. and E. S.: writing-original draft; A. Te., M. U. and S. V.: writing-review & editing; M. G., A. To. and S. V.: project administration and funding acquisition. All authors have read and approved the final version of the manuscript.
Permission to reproduce
Not applicable.
Clinical trial registration
Not applicable.
Data availability
Data is available from the corresponding author on request. Plasmid is available on Addgene (#231488).
References
Author notes
Alessandra Tesser and Paola Bocca contributed equally.
