


Abstract
Immune checkpoint inhibition (ICI) is highly effective for the treatment of melanoma, but intrinsic resistance is present in a subgroup of patients. TGF-β pathway activity may play a role in this resistance by preventing T-cells from entering the tumor microenvironment, causing immune escape. We investigated the association of TGF-β signal transduction pathway activity with resistance to ICI treatment in advanced melanoma. Furthermore, other pathway activities were analyzed to better understand their potential role in ICI resistance.
The activity of 8 signaling pathways (TGF-β, Hedgehog, MAPK, AR, NOTCH, PI3K, JAK/STAT1-2, and NFkB) was analyzed from tumor tissue from patients with advanced melanoma. Pathway activity scores (PAS) were explored for associations with survival and response to ICI in 34 patients (19 non-responders and 15 responders). A second, independent method to investigate the predictive value of TGF-β pathway activation was conducted by determining levels of phosphorylated SMAD2.
The mean TGF-β PAS of responders vs non-responders was 53.9 vs 56.8 (P = 0.265). No significant relation with progression-free survival was detected for TGF-β activity (P = 0.078). No association between pSMAD2 staining and treatment response or survival was identified. In contrast, Hedgehog scores of responders versus non-responders were 35.7 vs 41.6 (P = 0.038). High Hedgehog PAS was the sole significant predictor of resistance to ICI (OR 0.88, P = 0.033) and worse progression-free survival (HR 1–1.1, P = 0.012).
TGF-β pathway activation showed no significant relation with treatment response to ICI or survival in patients with advanced melanoma. Hedgehog PAS was identified as a possible biomarker associated with both treatment response and survival.
Introduction
Malignant melanoma is an aggressive form of skin cancer arising from melanocytes. In 2020 alone, melanoma was the cause of death for at least 57 000 patients globally [1]. For patients with distant metastatic disease, treatment with immune checkpoint inhibition (ICI) is the cornerstone together with BRAF/MEK inhibitors. Nivolumab and pembrolizumab, agents targeting programmed cell death 1 (PD-1), are first-line treatment. They are registered as monotherapy, or in combination with ipilimumab, an agent blocking cytotoxic T-lymphocyte-associated antigen 4 (CTLA-4) in both the metastatic and (neo)adjuvant setting [2, 3].
The introduction of ICI has significantly prolonged the survival of patients with metastatic melanoma, inducing durable responses in some patients [4, 5]. However, only up to half of patients respond to treatment with ICI, with response rates varying between 45% and 58% [4–6]. Treatment with checkpoint inhibition comes with a risk of adverse events, mainly immune-mediated phenomena, that can cause significant morbidity and sometimes lead to death. Grades 3–4 adverse events are reported in 10–17% of the patients treated with monotherapy anti-PD-1 agents and in up to 55% of the patients with combined treatment with anti-PD1 and anti-CTLA-4 agents [4, 5]. With a high risk of toxicity and a limited number of patients responding, there is a need for both a predictive biomarker to select patients who can obtain a durable response to ICI and ways to overcome primary treatment resistance.
So far, unambiguous biomarkers to predict response to ICI are lacking. The tumor microenvironment (TME), especially the interplay between the tumor and the immune system, has emerged as a key factor in melanoma metastasis. Preclinical data indicate that TGF-β pathway activity mediates immune evasion by T-cell exclusion from the tumor and may therefore be predictive for response [7–10]. TGF-β is a pleiotropic cytokine that plays key roles during embryogenesis and in tissue homeostasis. It can also exhibit both tumor-suppressor and -promoting roles, affecting proliferation and growth, angiogenesis, extracellular matrix remodeling, and immune evasion [11, 12]. The TGF-β pathway is activated through ligand binding to the type II receptor (TGF-βR2) and recruitment of the type I receptor (TGF-βR1). A hetero-oligomeric complex is formed with TGF-βR2 and TGF-βR1. This initiates phosphorylation of the downstream target proteins SMAD2 and SMAD3, which allows them to form a complex with SMAD4 and regulate expression of target genes, such as ID1, SERPINE1, and inhibitory Smads (SMAD6 and SMAD7) [13, 14]. SMAD7 interacts with TGF-βR1 and interferes with the activation of SMAD2 and SMAD3, functioning as a negative feedback loop to prevent continuous activation [15, 16].
The hypothesis that TGF-β activation in the TME represents a primary mechanism of immune evasion is supported by preclinical data in diverse tumor types including melanoma [17]. It has been reported in melanoma cell lines that cross-talk between programmed death ligand 1 (PD-L1) and TGF-β exists, which could possibly affect ICI response [18]. Blocking TGF-β signaling in mice, either by deleting SMAD4 or using small molecule TGF-β inhibitors like Galunisertib, inhibits tumor growth and formation of metastases and renders tumors more susceptible to ICI [7, 19]. Underlying mechanisms are thought to be the impaired migration of regulatory T-cells and restricted cytotoxic CD8 + T-cell function [9, 20]. In addition, deletion of the negative feedback loop by SMAD7 resulted in increased tumor growth and metastasis formation [19]. The data support the correlation between low SMAD7 transcript levels with poor survival in patients with melanoma or pancreatic cancer [19, 21]. Elevated TGF-β signaling was also suggested to counteract anti-tumor immunity by restricting the movement of T-cells into the TME, in patients with metastatic urothelial cell carcinoma treated with an anti-PD-L1 agent [9]. Moreover, high TGFBR1 and TGFBR2 expression were significantly associated with treatment resistance and reduced OS [9].
With the development of agents blocking the TGF-β signaling pathway, the role of TGF-β in treatment resistance to ICI becomes of clinical relevance [11]. Therefore, this study investigated the hypothesis that an elevated level of activity of the TGF-β pathway is associated with ICI treatment resistance in melanoma and might be used as a predictive biomarker for response to ICI. We investigated TGF-β signal transduction pathway activity by means of quantitative target gene expression and also by assessment of SMAD2 phosphorylation. Furthermore, the role of other signal transduction pathways associated with tumor immunity was investigated, such as the Hedgehog (Hh) pathway [22, 23]. Understanding the mechanisms of resistance to ICI could help develop strategies to overcome resistance and more personalized treatment.
Methods and materials
Patients and treatment
In this retrospective cohort study, patients were included with cutaneous metastatic melanoma who received monotherapy with an anti-PD-1 agent as first-line treatment. To increase the chance of finding clinically relevant differences, tumor samples were retrospectively collected, selecting responders and non-responders based on the presence and duration of a response. Response to ICI was based on the Response Evaluation Criteria in Solid Tumors (RECIST) version 1.1 [24]. Patients were treated with either Nivolumab or Pembrolizumab between January 2016 and November 2021 at the Radboudumc, a large academic hospital in the Netherlands. All data were retrieved from the electronic patient files. Formalin-fixed paraffin-embedded (FFPE) material of primary tumor and metastatic lesion (both pre-treatment) and follow-up data were obtained for all included patients. Patients treated with an anti-PD-1 agent that reached either a partial response (PR) or complete response (CR), with a duration of response exceeding 6 months were classified as responders. Patients with progressive disease (PD) within 6 months after starting treatment were classified as non-responders. We selected 20 responders and 20 non-responders. Because of the exploratory nature of biomarker discovery in this study, no formal sample size calculation was performed.
Study design
The relation between TGF-β signaling activity and treatment resistance to ICI was the primary outcome measure. Secondary aims were the relation among progression-free survival (PFS) and overall survival (OS) and TGF-β activity. The difference in TGF-β pathway activity was explored in both primary tumors and matched metastatic lesions. Variables taken into account were age, sex, ICI agent, BRAF mutation status, presence of brain metastasis, lactate dehydrogenase (LDH) level, location of metastatic lesions, ECOG performance score, and melanoma subtype (i.e. superficial spreading, acral lentiginous or nodular). TGF-β was assessed in two separate ways. First, by calculating TGF-β PAS using OncoSIGNal (InnoSIGN, Eindhoven, the Netherlands), and secondly, by using a recombinant monoclonal anti-phospho-SMAD2 antibody staining. The OncoSIGNal signal transduction pathway activity test also provided a PAS for seven other oncogenic pathways: mitogen-activated protein kinase (MAPK), androgen receptor (AR), Notch, Hedgehog (Hh), phosphoinositide 3-kinase (PI3K), nuclear factor kappa B (NFκB), and Janus kinase/signal transducer and activator of transcription (JAK-STAT1/2). The study complied with the relevant national regulations, institutional policies, and the Helsinki Declaration. The medical ethical board of Radboudumc approved the study (METC-2017-3164).
Signaling pathway activity score (PAS)
FFPE slides were annotated by a dedicated melanoma pathologist for areas with at least 50% tumor content from which mRNA was isolated. From these samples, PAS were measured using the OncoSIGNal pathway activity profiling PCR test (InnoSIGN). The OncoSIGNal test quantitatively measures functional activity using RT-qPCR to determine the mRNA expression of selected target genes of the pathway, as well as a number of housekeeping genes for normalization and quality control. Computational algorithms translate the mRNA expression into an activity score for each pathway on a scale from 0 to 100 where 0 indicates the lowest probability of an active pathway, and inversely, 100 is the highest probability of an activity pathway [25]. This Bayesian approach of expressing the odds of a pathway being active or inactive based on quantitative measurements of target gene sets has previously been validated and published in multiple tumor types for different pathways [26–33].
Immunohistochemistry
Immunohistochemistry analysis was performed on 4 µm-thick FFPE tissue sections of melanoma primary tumor and metastatic lesions to investigate pSMAD2 expression. Colon carcinoma samples served as positive controls. Sections were deparaffinized in xylol and rehydrated through graded ethanol into water series. Antigen retrieval was performed by heating the slides in 10 mM sodium citrate buffer pH6 for 20 minutes at 100°C. Endogenous peroxidase activity was blocked with 3% H2O2 in distilled water for 10 minutes at RT. Next, sections were incubated with monoclonal rabbit anti-phospho-SMAD2 (Ser465/467) (1:50, clone 138D4, #3108, Cell Signaling Technology, Danvers, MA, USA) in SignalStain Antibody Diluent (#8112, Cell Signaling Technology) in a humidified chamber overnight at 4°C. Subsequently, a 15 minutes incubation step at RT with EnVision FLEX + Rabbit LINKER (Agilent, Santa Clara, CA, USA) was performed, followed by 30 minutes incubation at RT with EnVision FLEX/HRP (Agilent, Santa Clara, USA). Antibody binding was visualized using the Envision Flex Dab + Substrate Chromogen System (Agilent) for 10 minutes at RT. Finally, slides were counterstained with hematoxylin, dehydrated, and mounted with a covereslip. pSMAD2 staining’s were scored by two independent observers. In case of observer discrepancies a dedicated melanoma pathologist was consulted. Stainings were scored based on the percentage of cells stained and the intensity of the staining as described in Table 1. Only tumor cells with a nuclear staining were counted. A mean score of 0 or 1 point was considered negative and a mean score of 2 or 3 was considered positive [34].
scoring system for pSMAD2 staining.
| Percentage of cells stained | ||||
|---|---|---|---|---|
| Intensity | <10% | 10–30% | 30–50% | >50% |
| No staining | 0 | 0 | 0 | 0 |
| Weak staining | 0 | 0 | 1 | 1 |
| Moderate staining | 0 | 1 | 2 | 3 |
| Strong staining | 1 | 2 | 3 | 3 |
| Percentage of cells stained | ||||
|---|---|---|---|---|
| Intensity | <10% | 10–30% | 30–50% | >50% |
| No staining | 0 | 0 | 0 | 0 |
| Weak staining | 0 | 0 | 1 | 1 |
| Moderate staining | 0 | 1 | 2 | 3 |
| Strong staining | 1 | 2 | 3 | 3 |
Statistical analysis
Descriptive statistics were used to describe baseline patient characteristics. Means or medians were used as applicable. χ² tests, t-tests, and Mann–Whitney U tests were used. Values were found statistically significant with a P value < 0.05. Crude survival is estimated using the Kaplan–Meier method, with survival differences between patient subgroups being assessed through log-rank testing. Univariate Cox proportional hazard regression was performed to identify factors associated with PFS and OS. Individual pathway scores were included as continuous variables. Furthermore, age, WHO-ECOG performance status, neutrophil-lymphocyte ratio, LDH value (normal vs abnormal), BRAF mutation status (mutated vs wildtype), presence of brain metastasis, number of organs involved, the anatomic site of metastasis, presence of ulceration, dermal mitosis or satellite lesions, and Breslow thickness were included as covariates. Variables with a P value < 0.1 in the univariate analysis were subjected to multivariate regression analysis. Statistical analyses were performed using IBM SPSS Statistics, version 22.0.0.1, and R studio, version 3.6.2.
Results
Patient characteristics
Forty patients were selected for PAS analysis from a metastatic lesion; in six patients PAS analysis was unsuccessful. A total of 34 patients with melanoma treated with immunotherapy had sufficient tumor tissue available from a metastatic lesion for PAS analysis. Of these 34 patients, a matched primary tumor sample was available in 31 patients. In total 19 patients were classified as non-responders and 15 as responders. Of the 15 responders, four patients (26.7%) had a PR and 11 patients (73.3%) had a CR. Patient and tumor characteristics were comparable between responders and non-responders except for the number of cycles of immunotherapy administered (P < 0.001), treatment duration (P < 0.001), and the best overall response (p < 0.001) (Table 2).
patient characteristics, sorted for responders and non-responders
| Number of patients (N = 34) | |||
|---|---|---|---|
| Characteristics, N (%) | Responder (N = 15) | Non-responder (N = 19) | P-value |
| Median age at initial diagnosis (range) | 65 (28–75) | 64 (46–80) | 0.391 |
| Gender | 0.724 | ||
| -Male | 9 (60) | 13 (68) | |
| - -Female | 6 (40) | 6 (32) | |
| Primary melanoma | |||
| Median Breslow thickness, mm (range) | 2.8 (0.7–4.2) | 4.5 (0.5–9.5) | 0.157 |
| Ulceration present | 0.087 | ||
| - Yes | 3 (21) | 10 (53) | |
| - No | 11 (79) | 9 (47) | |
| Metastatic melanoma | |||
| Time between initial diagnosis and distant metastasis, months (range) | 24 (5–133) | 16 (2–206) | 0.430 |
| LDH elevated | 1.00 | ||
| Yes | 3 (20) | 4 (21) | |
| - No | 12 (80) | 15 (79) | |
| BRAF mutation | 1.00 | ||
| Yes | 8 (53) | 10 (53) | |
| No | 7 (47) | 9 (47) | |
| Brain metastasis present | 0.613 | ||
| Yes | 1 (7) | 3 (16) | |
| No | 14 (93) | 16 (84) | |
| Location metastases at diagnosis | |||
| Bone | 2 (13) | 9 (47) | |
| Lung | 9 (60) | 16 (84) | |
| Lymph node | 12 (80) | 12 (63) | |
| GI | 2 (13) | 2 (11) | |
| Adrenal gland | 0 (0) | 2 (11) | |
| Liver | 2 (13) | 4 (21) | |
| Cutaneous | 7 (47) | 4 (21) | |
| -Subcutaneous | 1 (7) | 4 (21) | |
| -Spleen | 1 (7) | 1 (5) | |
| WHO ECOG | 0.471 | ||
| 0 | 7 (47) | 8 (42) | |
| 1 | 7 (47) | 11 (58) | |
| 2 | 1 (7) | 0 (0) | |
| Cycles immunotherapy, median (range) | 19 (6–18) | 4 (1–9) | <0.001 |
| Best overall response | <0.001 | ||
| PD | 11 (57.9) | ||
| SD | 8 (42.1) | ||
| PR | 4 (26.7) | ||
| CR | 11 (73.3) | ||
| Progressive disease | <0.001 | ||
| Yes | 4 (27) | 19 (100) | |
| No | 11 (73) | 0 (0) | |
Differences in pathway activity between primary tumor samples and matching metastasis
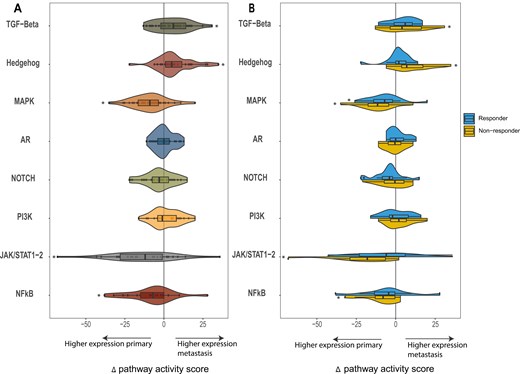
To determine the PAS, all samples were analyzed using the OncoSIGNal test, measuring the functional activity of the TGF-β, Hh, MAPK, AR, NOTCH, PI3K, JAK/STAT1-2, and NFκB pathways. PAS were significantly higher in the metastatic tumor samples (n = 31) for TGF-β (P = 0.010) and Hh (P < 0.010) compared to the primary tumor samples. Looking at the responders and non-responders in a subgroups analysis, this PAS increase was only statistically significant for non-responders, for both TGF-β (P = 0.044) and Hh (P = 0.003). For MAPK (P < 0.01), JAK/STAT1-2 (P < 0.01), and NFκB (P = 0.03) the mean PAS was significantly lower in the metastases compared to the primary tumor samples. This decrease was predominantly seen in non-responders in the JAK/STAT1-2 (P = 0.01) and NFκB (P = 0.023) pathway. In the MAPK pathway, a decrease in PAS was observed in both the responders (P = 0.024) and non-responders (P = 0.002) (Fig. 1).

the mean change in pathway activity score (PAS) is reflected for the selected pathways (TGF-Beta, Hedgehog, MAPK, AR, NOTCH, PI3K, JAK/STAT1-2, and NFkB). The change in pathway score is shown as the delta of the pathway scores, calculated by subtracting the PAS of the primary tumor from that of the matching metastatic tumor sample. A The delta pathway activity score for the entire patient cohort and B for responders and non-responders
Predictive value of pathway activity scores on treatment response
To investigate the predictive value of the TGF-β pathway, the mean PAS for both responders and non-responders to ICI was determined (Table 3 and Supplementary Figs. S1 and S2). Pathway scores from the primary tumor samples were comparable among responders and non-responders for all pathways. No association between PAS and survival in the primary tumor samples was found. For the metastatic tumor samples, the mean TGF-β PAS was also comparable between responders and non-responders (53.9 vs 56.8, P = 0.265). Univariate cox-regression analysis showed no significant association between TGF-β PAS and PFS (HR 1.047, 95%CI, 0.995–1.101, P = 0.078) (Supplementary Fig. S3). No association with OS was detected.
mean PAS for responders and non-responders to immune checkpoint inhibition
| Primary tumor tissue (n = 31) | Metastatic tumor tissue (n = 34) | |||||
|---|---|---|---|---|---|---|
| Pathway (mean [range]) | Responder (n = 14) | Non-responder (n = 17) | P-value | Responder (n = 15) | Non-responder (n = 19) | P-value |
| TGF-β | 50.86 [36–60] | 50.00 [32–63] | 0.751 | 53.87 [42–68] | 56.84 [45–77] | 0.265 |
| Hh | 33.64 [24–49] | 32.06 [19–48] | 0.569 | 35.73 [27–45] | 41.63 [31–58] | 0.038 |
| MAPK | 55.71 [25–66] | 56.53 [43–73] | 0.810 | 47.47 [35–69] | 46.21 [34–59] | 0.664 |
| AR | 28.43 [20–37] | 27.41 [20–35] | 0.542 | 28.47 [21–37] | 27.84 [20–39] | 0.721 |
| NOTCH | 67.50 [52–85] | 64.53 [53–74] | 0.301 | 63.27 [50–76] | 62.79 [43–84] | 0.880 |
| PI3K | 37.71 [25–49] | 38.59 [30–56] | 0.741 | 39.60 [30–50] | 40.26 [31–54] | 0.784 |
| JAK/STAT1-2 | 54.23 [20–77] | 56.25 [28–84] | 0.784 | 45.53 [14–80] | 41.17 [16–79] | 0.562 |
| NFκB | 65.92 [35–82] | 69.45 [51–80] | 0.476 | 58.15 [35–79] | 61.94 [40–79] | 0.441 |
The mean Hh score was significantly higher for non-responders compared to responders (41.6 vs 35.7, P = 0.038) (Table 3 andSupplementary Figs. S1andS2). High Hh PAS was associated with resistance to ICI in the metastatic tumor samples (OR 0.904 95% CI 0.817–1.00, P = 0.049) in the univariate analysis. This association was confirmed by multivariate analysis, where Hh came out as the sole (negative) predictor associated with response (OR 0.884, 95% CI 0.789–0.990, P = 0.033). In the metastatic samples, a higher Hh PAS was associated with shorter PFS (HR 1.077, 95%CI 1.016–1.141, P = 0.012) in the multivariate analysis. OS was comparable for Hh and all other PAS.
pSMAD2 levels not associated with treatment response
As a second method to investigate the predictive value of the TGF-β pathway, the expression of SMAD2 was evaluated. In an enlarged cohort, largely overlapping with the PAS analysis, sixty-five melanoma samples were immunohistochemically stained using a recombinant monoclonal anti-phospho-SMAD2 antibody. This cohort encompassed 30 primary and 35 metastatic tumor samples, of whom 25 and 32 overlapped with the cohort for the PAS analysis. Fig. 2 shows an example of a positive and a negative pSMAD2 staining and the corresponding hematoxylin and eosin (H&E) stain.
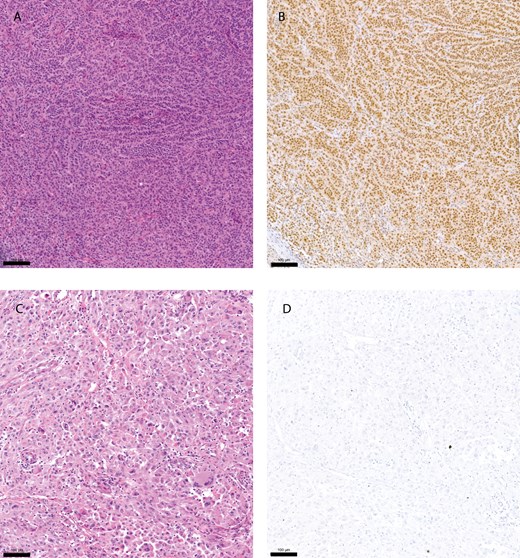
pSMAD2 immunohistochemistry staining. Hematoxylin and eosin (H&E) stain of a primary melanoma tumor sample (A), and corresponding sample with a positive immunohistochemistry (IHC) staining using a pSMAD2 antibody (B). (C and D) showing an H&E stain of a small intestine melanoma metastasis and corresponding negative IHC staining using a pSMAD2 antibody. Yardstick represents 100 µm
Of the primary tumor samples, 16 (53%) tumors showed a positive staining (36% responders vs 69% non-responders (P = 0.141)). Of the metastatic tumor samples, 17 (51%) metastases showed a positive staining (47% responders vs 53% non-responders (P = 1.00)) (Table 4). No association between pSMAD2 staining and treatment response in either the primary tumor samples or metastasis was identified. Neither was a significant association between pSMAD2 staining and survival found. Mean TGF-β PAS were comparable for the pSMAD2 positive and negative samples in both the primary tumors (0.221) and metastasis (P = 0.261) (Supplementary Fig. S4).
anti-phospho-SMAD2 scores by immunohistochemistry
| pSMAD2 score | |||
|---|---|---|---|
| Negative | Positive | P-value | |
| Primary tumor samples | 0.141 | ||
| Non-responder | 9 | 5 | |
| Responder | 5 | 11 | |
| Metastatic tumor samples | 1.00 | ||
| Non-responder | 9 | 9 | |
| Responder | 9 | 8 | |
| pSMAD2 score | |||
|---|---|---|---|
| Negative | Positive | P-value | |
| Primary tumor samples | 0.141 | ||
| Non-responder | 9 | 5 | |
| Responder | 5 | 11 | |
| Metastatic tumor samples | 1.00 | ||
| Non-responder | 9 | 9 | |
| Responder | 9 | 8 | |
Discussion
In this study, the predictive role of the TGF-β pathway to treatment response with ICI in patients with melanoma was studied. No association between treatment response and TGF-β pathway activity in both primary tumor samples and metastases was found, and neither could we identify a clear association with survival. Although significant changes in PAS between primary tumor samples and metastasis were identified in multiple pathways including TGF-β only a consistent association between high Hh pathway scores and resistance to ICI was detected.
Several studies have successfully investigated the value of quantification of PAS using the OncoSIGNal test to predict treatment response and clinical benefit in various cancer types. In salivary duct cancer, the AR pathway predicts clinical benefit, and in patients treated with androgen deprivation therapy the TGF-β and NOTCH pathways could have a prognostic value [26, 28]. In metastatic castration-resistant prostate cancer low AR and NOTCH activity and increased Hh pathway activity were associated with resistance to androgen receptor inhibitors [35]. In primary breast cancer, it was reported that immunosuppressive regulatory T-cells were characterized by a high TGF-β and NOTCH PAS [33]. In this study we measured TGF-β pathway activity in patients with melanoma, using the OncoSIGNal pathway analysis. The results were validated using immunohistochemistry for an anti-phospho-SMAD2 antibody, as SMAD2 is a hallmark protein in the TGF-β pathway, and elevated SMAD2 levels have been associated with an immune-suppressive microenvironment in melanoma mouse models [36]. No significant association between a positive pSMAD2 IHC staining and elevated TGF-β pathway activity measured by means of mRNA target gene expression was found. In non-small cell lung cancer, SMAD2 was positively associated with PD-L1 expression, suggesting its use as a biomarker for treatment response [37]. Some studies in colorectal cancer and urothelial cell carcinoma suggest a predictive role of the TGF-β pathway for treatment response to ICI [7, 9]. However, the current results in this study do not support the hypothesis that the activity of the TGF-β pathway is predictive of treatment response to ICI in patients with melanoma.
Several studies are currently investigating the effect of agents blocking TGF-β signaling. This includes agents affecting the TGF-β signaling pathway as monotherapy or in combination with anti-PD-(L)1 inhibitors [11, 12, 38–40]. Up to now, clinical trials showed only limited effect in treating patients with TGF-β blocking agents and reported substantial toxicity in some cases [39, 41]. Fresolimumab (GC1008), a human IgG4 monoclonal antibody, showed reasonable toxicity, most frequently inducing keratoacanthomas and hyperkeratosis but also squamous cell carcinoma of the skin. However, its effectiveness was limited, with an overall response rate of 3.5% in a study that included mostly patients with advanced melanoma [42]. Bifunctional agents combining TGF-β/PD-L1 inhibition, of which Bintrafusp alfa is the most well-studied, have shown a more favorable toxicity profile, although fatal adverse events such as interstitial lung disease have been reported [43]. The efficacy of Bintrafusp alfa is currently under investigation in several phase I–III trials [43, 44]. Overall, clinical trials blocking TGF-β signaling are in an early stage and require further investigation. In melanoma, studies investigating TGF-β blocking agents are scarce and response rates are low, which is in line with the lack of correlation between response and TGF-β pathway activity in this study.
Disease characteristics, e.g. LDH level and presence of brain metastases, impact the chance of response but are unable to select responders from non-responders. While specific biomarkers such as PD-L1, tumor mutational burden (TMB), and the composition of the TME may to some extent predict response in specific tumor types, this might not be the case in others. Within the tumor, programmed cell death ligand 1 (PD-L1) is the most studied biomarker, based on its mechanism of interaction with PD-1. T-cells can be deactivated when engagement between PD-1 and PD-L1 occurs. Blocking PD-(L)1 can prevent cancer cells from inactivating T-cells. High (TMB) is associated with response and survival to ICI [45]. Samstein et al. found that patients with the 20% highest TMB in various cancer types had significantly better survival after treatment with ICI [46]. In melanoma specifically, a T-cell infiltrated TME, PD-L1 expression on peripheral T-cells, abundance of specific gut-microbiome genera, and an interferon-gamma signature have been associated with response to ICI [47–50]. However, it has become increasingly clear that these biomarkers do not unequivocally predict response to ICI [51]. For example, the European Medicine Agency (EMA) declined approval of pembrolizumab for TMB-H due to concerns about the large variability in response rates among different tumor types in the KEYNOTE-158 trial [52]. This could also be the case for TGF-β activity, where its use as a predictive biomarker might be of value in urothelial cell carcinoma and colorectal cancer, but not melanoma. Marathesian et al. described that enrichment of the fibroblast TGF-β response results in immune evasion by restricting T-cells in the TME, thereby creating non-responding tumors [9]. One could hypothesize that the lack of predictive value of TGF-β in melanoma is related to the composition of the TME, with a relatively lower frequency of cancer-associated fibroblasts in melanoma compared to colorectal or urothelial cell carcinoma [53].
We identified Hh PAS as a potential predictive biomarker associated with treatment response to ICI in patients with melanoma. An elevated Hh PAS activity correlated with a shorter PFS and resistance to ICI. Furthermore, in line with previous studies investigating the role of the Hh pathway in metastasis development, we reported a significant increase in Hh PAS between primary tumor samples and metastasis. The Hh pathway is a highly conserved and essential signaling pathway in embryonic development and tissue maintenance. It regulates various processes including cell differentiation, proliferation, and tissue patterning [54]. Hh signaling has also been reported to promote tumor-associated macrophage polarization to suppress cytotoxic T-cell recruitment. Furthermore, Hh pathway activation has been described to cause the accumulation of regulatory T-cells and increased expression of PD-(L)1 [22, 55]. In basal cell carcinoma, genetic alterations resulting in aberrant activation of the Hh PAS are frequently present. Protein patched homolog 1 (PTCH1), a transmembrane receptor protein acting as a tumor suppressor, and transmembrane protein smoothened (SMO) are often affected. SMO activation leads to a signaling cascade that involves the transcription of Hh target genes, initializing cell proliferation and leading towards tumor growth [56]. Two Hh inhibitors, Sonidegib and Vismodegib, are approved by the Food and Drug Administration and European Medicines Agency (EMA) for treatment in (metastatic) basal cell carcinoma. Both drugs are inhibiting SMO with response rates ranging between 45% and –60% for locally advanced disease [57]. Due to the absence of Hh pathway-associated driver mutations, Hh inhibition has no place in the treatment for melanoma [58]. Unfortunately, Hh inhibition has not been successful in other cancer types besides basal cell carcinoma, possibly due to several factors such as the non-canonical activation of the Sonic hedgehog pathway and gene amplifications [59, 60]. Based on our results linking an elevated Hh pathway activity and resistance to ICI, Hh inhibition might positively impact the TME. Therefore further exploration of the combination therapy with Hh inhibitors and ICI seems opportune.
This study has some limitations. The study was retrospectively designed and focused exclusively on patients receiving monotherapy ICI. This limits the generalizability of the findings to those treated with dual ICI. While our results provide initial insights into the relationship between TGF-β signaling and ICI resistance in melanoma, and although a clear distinction was defined between responders and non-responders, the relatively small sample size in this exploratory study may limit the detection of significant trends. To provide further confirmation, future studies should be directed at extending this cohort, preferably in a prospective clinical trial.
In conclusion, despite the pathophysiological rationale, TGF-β pathway activation showed no significant relation with treatment response to ICI monotherapy or survival in patients with melanoma. Based on this finding, we expect limited efficacy of agents blocking TGF-β signaling in melanoma. Prospective trials will shine a light on the clinical effect of these agents. In contrast, the Hedgehog pathway activity was identified as a possible predictive biomarker associated with both treatment response and survival and warrants further investigation.
Supplementary data
Supplementary data is available at Clinical and Experimental Immunology online.
Abbreviations:
- AR
androgen receptor
- CTLA-4
cytotoxic T-lymphocyte-associated antigen 4
- CR
complete response
- FDA
Food and Drug Administration
- FFPE
formalin-fixed paraffin embedded
- Hh
Hedgehog
- ICI
immune checkpoint inhibition
- LDH
lactate dehydrogenase
- MAPK
mitogen-activated protein kinase
- NFkB
nuclear factor kappa B
- OS
overall survival
- PAS
pathway activity score
- PD
progressive disease
- PD-1
programmed cell death 1
- PD-L1
programmed death ligand 1
- PFS
progression free survival
- PI3K
phosphoinositide 3-kinase
- PR
partial response
- RECIST
response evaluation criteria in solid tumors
- TGF-β
transforming growth factor-beta
- TME
tumor microenvironment
- WHO-ECOG
World Health Organization Eastern Cooperative Oncology Group
Ethical approval
The study complied with the relevant national regulations, institutional policies, and the Helsinki Declaration. The medical ethical board of Radboudumc approved the study (METC-2017-3164).
Conflict of interests
K.F. Bol: consultancy fees (all paid to institute) from MSD and Pierre Fabre. Yvonne Wesseling: Fulltime employee InnoSIGN. Anne van Brussel: Fulltime employee InnoSIGN. Diederick Keizer: Fulltime employee InnoSIGN. The other authors report no conflict of interest.
Funding
There are no funders to report for this paper.
Data availability
The data that support the findings of this study are available from the corresponding author upon reasonable request.
Author contributions
Stefanus Gerardus van Ravensteijn (Conceptualization, Data curation, Formal analysis, Investigation, Methodology, Project administration, Visualization, Writing—original draft), Avital Amir (Investigation, Writing—original draft), Daniele Tauriello (Investigation, Writing—original draft), Carla van Herpen (Investigation, Resources, Supervision, Writing—original draft), Marye Boers-Sonderen (Investigation, Writing—original draft), Yvonne Wesseling (Data curation, Writing—original draft), Anne van Brussel (Data curation, Writing—original draft), Diederick Keizer (Investigation, Writing—original draft), H.W.M. Verheul (Conceptualization, Funding acquisition, Investigation, Project administration, Supervision, Writing—original draft), and Kalijn Bol (Conceptualization, Data curation, Investigation, Methodology, Resources, Supervision, Writing—original draft)
