


Dear Editor,
We have read with great interest the article by Chu et al. regarding the discriminating traits between neuromyelitis optica spectrum disorder (NMOSD) antibody (Ab) subgroups. We would like to share our own experience in seronegative NMOSD particularly on the discrepancy of laboratory profiles and offer an explanation for enhanced serum IL-17 levels in NMOSD patients [1]. As reviewed by the authors, NMOSD is an autoimmune demyelinating disease of the central nervous system. Aquaporin-4 (Aqp-4)-Ab can be found in around two-thirds of NMOSD patients and has been implicated in the pathogenesis of the disease. While remaining NMOSD patients may display anti-myelin oligodendrocyte glycoprotein (MOG)-Ab, a subset of NMOSD patients is negative for both antibodies [1, 2]. Seronegative NMOSD patients may occasionally pose a challenge since they may give variable response to immunotherapy implying the presence of different potential disease mechanisms in this NMOSD subtype [2]. As a matter of fact, seronegative NMOSD patients have been shown to exhibit reduced cerebrospinal fluid (CSF) IL-6 levels and lower serum IL-9 and IL-17 levels, as compared to Aqp-4-Ab+ NMOSD patients [1, 3, 4]. Also, seronegative patients display relatively lower complement activity and complement factor consumption than Aqp-4-Ab+ patients [5].
To better understand the differences in the immunological profile of seronegative and Aqp-4-Ab+ NMOSD, we assessed the peripheral blood immunophenotypes of 8 seronegative (44.9 ± 6.4-year old; 6 women) and 10 Aqp-4-Ab+ NMOSD (43.8 ± 8.9-year old; 7 women) patients, as well as age- and gender-matched relapsing-remitting multiple sclerosis (RRMS) patients (n = 40; 43.6 ± 9.2-year old; 23 women) and healthy controls (HC; n = 20; 44.7 ± 8.2-year old; 14 women). All NMOSD [6] and RRMS [7] patients satisfied the relevant criteria. All patients were in remission, had not received immunomodulating or immunosuppressive medications in the last 3 months, and did not have any coexisting autoimmune/infectious disorders, malignancy, or pregnancy. All NMOSD patients had the typical clinical core features of long extensive transverse myelitis and optic neuritis. Serum Aqp-4 and MOG-Abs were assessed by a live cell-based assay in all participants and double-negative NMOSD patients were included in the seronegative NMOSD group. None of the recruited patients displayed MOG-Ab. In the NMOSD group, disease duration was 12.2 ± 6.9 years, age at disease onset was 36.3 ± 15.6, EDSS during blood collection was 3.8 ± 2.7, and progression index was 0.4 ± 0.1. The study was approved by the local ethics committee and written informed consent was obtained from all participants.
Peripheral blood samples were obtained between 8.00 and 10.00 a.m. Peripheral blood mononuclear cells (PBMCs) were isolated from blood samples with an EDTA tube by density gradient centrifugation using Ficoll–Paque. PBMCs were then stained with fluorescently labeled monoclonal antibodies [anti-human CD3-FITC, CD16/CD56-PE, CD45-PerCP, CD19-APC (Becton Dickinson, Franklin Lakes, NJ, USA), CD27-FITC, CD24-PerCP, CD38-Alexa Fluor 700, IgD-APC/Cy7, and CD138-PE (Biolegend, San Diego, CA, USA)] and, then six color immunofluorescence staining was utilized (BD FACS Aria II, Becton Dickinson). Data were analyzed using Cell Quest (BD) and FlowJo7.6.5 software. Immune cell subset frequencies were compared by ANOVA and Tukey’s post hoc test. Correlation analysis between frequencies and clinical parameters was done by Pearson correlation test.
Frequencies of major peripheral blood cell groups, CD3+ T cell, CD19+ B cell, NK, and NKT cell, were identical among groups. Likewise, all participants showed comparable frequencies of memory B cell, plasmablast, helper T cell, CD3+CD20+ T cell, CD3+CD4+CXCR5+PD1+ follicular helper T cell, Th1, and Th17 cells. Aqp-4-Ab+ NMOSD patients showed significantly increased CD19+CD38+CD138+ plasma cell frequencies than HC. On the other hand, seronegative patients showed significantly elevated CD3+CD8+ cytotoxic T-cell frequencies than Aqp-4-Ab+ NMOSD and RRMS patients but not HC. Although total regulatory T-cell (Treg) frequencies were not significantly different, CD3+CD4+CD25++CD127−CD49d+ Treg subtype was significantly reduced in seronegative NMOSD, Aqp-4-Ab+ NMOSD and RRMS patients, as compared to HC. Furthermore, both seronegative and Aqp-4-Ab+ NMOSD patients showed trends toward displaying reduced regulatory B-cell (Breg) frequencies. Notably, seronegative NMOSD patients showed significantly higher CD3+CD4+CXCR5-PD1+ peripheral helper T (PHT) cell frequencies than other study groups (Table 1; Figure 1). The only significant correlation was found between PHT-cell frequency versus EDSS score of the entire NMOSD cohort (P < 0.0001, R = 0.857). PHT-cell frequencies of Aqp-4-Ab+ (P = 0.002, R = 0.838) and seronegative NMOSD (P < 0.0001, R = 0.964) subgroups also positively correlated with EDSS scores.
Comparison of prevalence (%) peripheral blood immune cell subsets among HC, patients with Aqp-4 Ab-positive and seronegative NMOSD and RRMS
| Percentage | Seronegative NMOSD | Aqp-4 Ab+ NMOSD | RRMS | HC | P value |
|---|---|---|---|---|---|
| CD3−CD16+CD56+NK cell | 6.9 (4.1–12.6) | 5.8 (3.4–9.0) | 11.2 (8.2–14.0) | 11.8 (8.9–16.2) | ns |
| CD3+CD16+CD56+ NKT cell | 9.4 (4.3–11.6) | 5.7 (1.5–12.8) | 4.5 (3.3–11.5) | 8.0 (6.1–13.3) | ns |
| CD19+ B cell | 4.9 (3.5–7.2) | 5.6 (2.8–10.7) | 5.3 (2.8–8.4) | 6.5 (4.9–8.2) | ns |
| IgD−CD27+ (in B cell) memory B cell | 35.0 (13.8–54.7) | 40.8 (34.7–46.7) | 28.6 (18.4–44.3) | 29.0 (20.2–34.3) | ns |
| CD38++CD138- (in B cell) plasmablast | 2.5 (1.5–3.8) | 2.1 (1.5–2.4) | 2.9 (2.7–3.5) | 2.6 (1.8–3.9) | ns |
| CD38+CD138+ (in B cell) plasma cell | 2.5 (1.5–3.8) | 3.1 (2.3–5.3) | 2.4 (1.8–3.0) | 1.7 (0.9–2.3) | 0.013 |
| CD24++CD38++ (in B cell) Breg | 2.7 (0.7–5.2) | 1.3 (0.8–3.9) | 4.7 (2.8–7.1) | 3.7 (2.6–5.2) | ns |
| CD3+ T cell | 70.3 (63.1–75.6) | 74.3 (66.6–81.2) | 68.7 (62.7–76.2) | 74.6 (68.7–79.0) | ns |
| CD3+CD8+ cytotoxic T cell | 38.7 (35.7–48.9) | 26.3 (22.0–32.8) | 30.8 (24.5–37.1) | 30.5 (23.6–37.7) | 0.011 |
| CD3+CD4+ helper T cell | 36.4 (18.9–56.3) | 34.5 (26.4–60.1) | 26.4 (20.7–37.7) | 31.8 (25.7–46.8) | ns |
| CD3+CD4+CD25++ Treg | 1.0 (0.7–2.2) | 0.9 (0.6–1.3) | 0.9 (0.5–1.6) | 1.6 (0.9–1.9) | ns |
| CD127−CD49d+ Treg (in CD3+CD4+CD25++) | 39.5 (32.5–47.3) | 46.2 (31.8–51.5) | 51.8 (45.5–59.3) | 65.5 (56.0–75.3) | 0.0002 |
| CD3+CD20+ T cell | 0.8 (0.5–1.7) | 0.6 (0.2–1.1) | 1.7 (0.3–3.6) | 1.2 (0.6–1.7) | ns |
| CXCR5+PD1+ (in CD3+CD4+) follicular helper T cell | 1.9 (0.9–3.0) | 1.2 (0.8–4.1) | 1.3 (0.8–1.9) | 1.2 (0.4–2.2) | ns |
| CXCR5−PD1+ (in CD3+CD4+) PHT cell | 13.0 (9.5–15.0) | 7.0 (4.7–10.2) | 6.0 (3.5–8.1) | 8.6 (6.0–9.8) | <0.0001 |
| CXCR3+CCR6− (in CD3+CD4+) Th1 | 16.5 (11.9–31.4) | 21.8 (12.5–30.9) | 20.1 (11.0–29.6) | 22.0 (11.4–29.5) | ns |
| CXCR3−CCR6+ (in CD3+CD4+) Th17 | 7.6 (3.8–11.1) | 4.9 (3.9–13.7) | 5.4 (3.2–8.0) | 4.1 (2.5–5.8) | ns |
All data are presented as median (25–75% percentile). Breg, regulatory B cell; Treg, regulatory T cell; ns, not significant. P values are obtained by ANOVA; significant P values are denoted with bold characters. Post hoc analysis of immune cell variables with statistically significant differences was depicted in Figure 1.
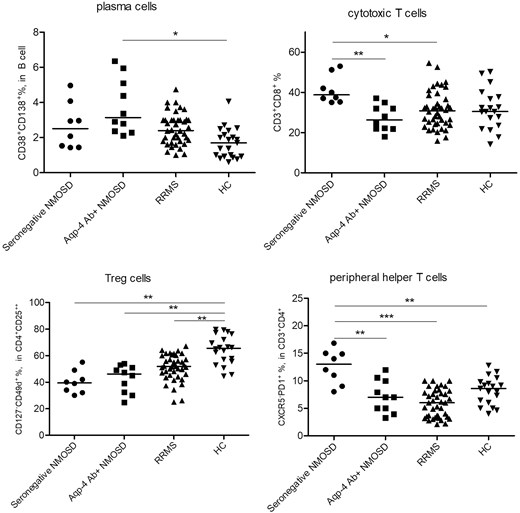
Distribution of frequencies (%) of peripheral blood plasma cells, cytotoxic T cells, CD49d+ Treg and PHT cells among patients with seronegative and Aqp-4 Ab-positive NMOSD, RRMS and HC. *P < 0.05; **P < 0.01; ***P < 0.001 by post hoc Tukey’s test.
Our results confirm previous reports indicating that Ab-secreting cells including plasma cells are elevated in peripheral blood samples of Aqp-4-Ab+ NMOSD patients [8]. This finding is congruent with the Ab-mediated physiopathology of the disease as well as with the observation that Aqp-4-Ab+ NMOSD patients exhibit higher serum IgG levels than seronegative ones [5]. Our results also agree with previous reports showing Breg frequency reduction in the peripheral blood [9]. Additionally, we have shown for the first time that not the total Treg population but a specific CD49d+ subset of Tregs is significantly reduced in the peripheral blood of both NMOSD and RRMS patients indicating the significance of this subset in autoimmune demyelinating disorders. Since CD49d+ cells are proinflammatory cells showing high migratory capacity and increased expression of cytokines such as IFN-γ and IL-17A, reduced frequencies of CD49d+ Tregs might be explained by enhanced allocation of these cells into the brain parenchyma from the peripheral blood in NMOSD and RRMS patients [10].
A notable finding was significantly increased peripheral blood PHT frequencies in seronegative (but not Aqp-4-Ab+) NMOSD. Moreover, PHT frequency was strongly correlated with the disability status of NMOSD patients implying the involvement of this cell subset in NMOSD pathogenesis. Increased peripheral blood PHT frequency has been previously reported [8]; however, the discrepancy between PHT frequencies of seronegative and Ab-positive NMOSD has never been mentioned. PHT has been implicated as a pathogenic factor in immune complex diseases (e.g. systemic lupus erythematosus and rheumatoid arthritis), T-cell-mediated diseases (e.g. type 1 diabetes mellitus) and IgG4-related disorders [11]. PHT expresses high levels of CXCL13 and IL-21 and promotes the formation of tertiary lymphoid structures, which may show features of functional germinal centers and are believed to influence disability progression and cortical lesion formation in multiple sclerosis (MS). Moreover, the function of PHT cells on naïve B cells is limited and they promote production of the IgM isotype rather than IgG and IgA isotypes [11]. Thus, it is tempting to speculate that PHT cells might contribute to the immunopathology of seronegative NMOSD. This assertion needs to be further delineated in future studies.
In disagreement with the article of Chu F et al. [1], reporting increased IL-17 levels in sera of NMOSD patients, we failed to show a significant difference among frequencies of peripheral blood Th17 cells. Other authors have also shown that peripheral blood Th1, Th17, and Treg populations of NMOSD patients are comparable to those of MS patients and HC [10]. This discrepancy may be explained by the elevation of other IL-17-producing cell types such as CD8+ cytotoxic cells and PHT cells [12, 13]. In line with this notion, PHT frequency has been shown to be positively correlated with IL-17 levels in NMOSD [14].
In brief, our results confirm and emphasize the deficiency of certain specific regulatory immune cell subsets in NMOSD. Accumulating evidence suggests that non-Ab-mediated pathogenic factors might be involved in seronegative NMOSD. An improved understanding of disease mechanisms is required for the effective treatment of this NMOSD subtype. PHT and other IL-17-producing immune cells may serve as diagnostic and prognostic biomarkers for seronegative NMOSD.
Abbreviations
- Ab
antibody
- Aqp-4
Aquaporin-4
- MOG
myelin oligodendrocyte glycoprotein
- NMOSD
neuromyelitis optica spectrum disorder
- PBMCs
peripheral blood mononuclear cells
- PHT
peripheral helper T
- RRMS
relapsing-remitting multiple sclerosis
- Treg
regulatory T cell
Ethical approval
The study was approved by the Regional Ethical Review Board of Istanbul University. Informed consent was signed by all the participants.
Funding
This study was supported by the Turkish Scientific and Technical Research Council (Project ID: 216S497).
Conflict of interests
The authors declare no conflict of interest.
Data availability
Data will be available upon request.
Author contributions
All authors contributed to this letter to the editor.
