


Abstract
First-line immune checkpoint inhibitors (ICIs) have greatly ameliorated outcomes in non-small cell lung cancer (NSCLC). However, approximately a quarter of patients receiving ICIs demonstrate long-term clinical benefit, and the true responders have not been fully clarified by the existing biomarkers. To discover potential biomarkers treatment-related outcomes in plasma, mass spectrometry assay for the data-independent acquisition was analyzed plasma samples collected before the anti-PD-1 treatment. From July 2019 to January 2020, 15 patients with EGFR/ALK-negative NSCLC receiving first-line anti-programmed cell death protein 1 (PD-1) inhibitors were enrolled, and six healthy individuals have collected the plasma samples as control. We explored plasma proteome profiles and conducted stratified analyses by anti-PD-1 responders and non-responders. To validate the target proteins by ELISA, we recruited 22 additional independent patients and 15 healthy individuals from April 2021 to August 2021. By identifying biomarkers to predict better efficacy, we performed differential expression analysis in 12 responders and three non-responders. Compared with healthy individuals, hierarchical cluster analysis revealed plasma proteome profiles of NSCLC were markedly changed in 170 differentially expressed proteins. Furthermore, we discovered that SAA1, SAA2, S100A8, and S100A9 were noticeably increased among non-responders than responders, which may serve as predictive biomarkers with unfavorable responses. The validated results from all samples via ELISA have confirmed this observation. Identified a set of plasma-derived protein biomarkers (SAA1, SAA2, S100A8, and S100A9) that could potentially predict the efficacy in cohorts of patients with NSCLC treated with first-line anti-PD-1 inhibitors and deserves further prospective study.
Introduction
Following the introduction of immune checkpoint inhibitors (ICIs) in clinical practice, a new therapeutic era of cancer has seen the light in the last decade. The novel therapies with ICIs, that is, anti-PD-1/PD-L1 (programmed cell death protein; programmed death-ligand 1) [1, 2] and CTLA-4 (cytotoxic T-lymphocyte-associated protein) [3] have greatly ameliorated the survival outcome for patients with non-small cell lung cancer (NSCLC) [4], melanoma [5, 6], and squamous cell carcinoma of the head and neck [7]. Among NSCLC patients with ICIs as first-line therapy, pembrolizumab significantly prolongs the median overall survival (OS) to 20.0 months, while chemotherapy is 12.2 months (HR = 0.69, P = 0.0003) [8]. A chemotherapeutic combination of the anti-PD-1 inhibitors has further improved the objective response rate (ORR) and OS. The ORR of pembrolizumab plus chemotherapy was 47.6%, which reflected in the 2-year OS up to 45.7%; however, the ORR and 2-year OS of chemotherapy alone were 18.9% and 27.3%, respectively [9, 10].
Although ICIs treatment was effective, approximately a quarter of NSCLC patients respond and present long-term clinical benefits [11, 12]. It is necessary to predict the efficacy, so far, there is no robust biomarker to identify the response to PD-1 blockade therapies for NSCLC patients in clinical practice. To spare patients from ineffective therapy, there is an urgent need for predictive biomarkers of clinical efficacy. PD-L1 expression [13], tumor mutational burden (TMB) [14, 15], gut microbiota [16], genomic markers [17–19], and tumor-infiltrating lymphocytes [20, 21] are familiar examples of ICIs’ biomarkers that have been widely studied in NSCLC, especially PD-L1 expression. The high expression of PD-L1 on tumor cells is closely associated with the clinical outcomes of anti-PD-1 treatment, but the actual responders have not been fully clarified [22]. Additionally, due to the different antibodies and the presence of high heterogeneity within tumor tissues, it is hard to compare and standardize [23–25].
Different from histology–based tests, growing evidence of liquid biopsy has demonstrated that the efficacy and drug resistance of treatment are affected by intra- and inter-tumor heterogeneity [26–28]. Since plasma is transporting tissue-derived molecules such as secreted proteins throughout the body, an exhaustive analysis of the plasma proteome provides unique insights to capture tumor heterogeneity more thoroughly compared to regional biopsies. With the high throughput capabilities proteomics method, data-independent acquisition (DIA) offers unbiased and comprehensive protein quantitation of plasma without protein depletion. To date, in addition to ongoing research, there are no relevant studies using DIA to detect respond-related to ICIs treatment in NSCLC. To discover potential plasma biomarkers, we are aiming to explore and validate circulating and tumor-derived proteins related to the efficacy of anti-PD-1 treatment to select the optimal NSCLC patients for immunotherapy.
Materials and methods
Patient characteristics and plasma samples
From July 2019 to January 2020, a cohort of 15 EGFR/ALK-negative NSCLC patients was recruited at the Department of Pulmonary Medicine, Zhongshan Hospital, Fudan University, Shanghai, China. This research was ethically approved by the ethics committee at Zhongshan Hospital (B2020-431R). Peripheral blood was collected before the administration of the anti-PD-1 inhibitor from each patient in Vacutainer EDTA tubes (Becton Dickinson), and the blood sample was promptly centrifuged and the aspirated plasma was frozen at − 80°C until analysis. Clinical information, including age-at-treatment, sex, histology, performance status, TNM stage according to the eighth edition of the American Joint Committee on Cancer [29], date of disease progression, and date of death was obtained from each patient.
The following inclusion criteria should be fulfilled: age 18–80 years; performance status ≤1 according to the ECOG scale; anti-PD-1 used as first-line treatment; adequate liver, renal, and bone marrow function. All the patients were confirmed by histopathology examination, and none of the patients had received chemotherapy, immunotherapy, radiation therapy, or surgery before sample collection. Based on the following exclusion criteria, the following patients were excluded: autoimmune diseases; interstitial lung disease; corticosteroid use; systemic immunosuppression; used antitumor agents, including traditional Chinese medicine. Response to treatment was assessed with Response Evaluation Criteria in Solid Tumors 1.1 [30], and no complete response was observed in this patient cohort. OS was defined as the number of months between the start of treatment and the date of death or last follow-up. PFS was determined as the date of the initial treatment to disease progression or death. The follow-up period ended on January 29, 2022.
Patients receiving anti-PD-1 treatment with durable clinical benefit were classified as responders which is defined as no progression event or death within the first six months of anti-PD-1 inhibitors. Conversely, if disease progression or death within the first 6 months of anti-PD-1 inhibitors, patients were classified as non-responders [17]. Additionally, six normal controls were enrolled as healthy individuals without disease of any kind.
Mass spectrometry-based proteomics analysis
Sample preparation and protein digestion
The plasma samples from different samples were transferred to an appropriate volume and mixed into plasma pools for generating the spectral library. Plasma pools were processed with the Human 14 Multiple Affinity Removal System Column according to the manufacturer’s protocol (Agilent Technologies). The supernatant was quantified with BCA Protein Assay Kit (Bio-Rad, USA). To evaluate extraction, 20 μg protein from each sample was loaded and subjected to SDS–polyacrylamide gel electrophoresis (Supplementary Fig. S1). Protein digestion of high abundant proteins and low abundant proteins was modified from the filter-aided sample preparation (FASP) method described previously [31].
Digested pool peptides of low-abundance proteins were fractionated to 10 fractions using high pH reversed-phase peptide fractionation kit (Thermo Scientific). Each fraction was concentrated by vacuum centrifugation and reconstituted in 15 µl of 0.1% (v/v) formic acid. Collected peptides were desalted on C18 Cartridges (Empore™ SPE Cartridges C18 (standard density), bed I.D. 7 mm, vol. 3 ml, Sigma) and reconstituted in 40 µl of 0.1% (v/v) formic acid. In addition, the iRT-Kits (Biognosys) were added with volume proportion 1:3 for iRT standard peptides versus sample peptides to calibrate between the relative retention time and indexed retention.
DDA mass spectrometry assay
The peptide separation was carried out using an Easy nLC 1200 chromatography system (Thermo Scientific). Analysis of all fractions generated from the DDA library by the Thermo Scientific Orbitrap Exploris 480 mass spectrometer. Mass spectrometric detection was performed in positive ion mode in the m/z range 300–1800, the resolution used in the MS1 scan event was 60 000 at 200 m/z, and the target automatic gain control (AGC) was set as 3e6 ions with a 50 ms maximum (IT). After each full MS scan, the 20 ddMS2 scans were followed.
Mass spectrometry assay for DIA and data analysis
The LC–MS/MS was operated in DIA mode with one full MS scan followed by 30 DIA scans for each cycle, and the mass spectrometric parameters were as follows: positive ion mode in the m/z range 350–1650, full scan with resolution 60 000 at 200 m/z, AGC value of 3e6, and maximum IT of 50 ms; DIA scanning parameters were set to 30 000 resolution at 200 m/z, AGC was set at 3e6, maximum IT auto, normalized collision energy of 30, and spectral data collected in profile mode. To monitor MS performance throughout the analysis, a quality control sample consisting of an equal aliquot of all samples was run at the beginning of the MS study and the subsequent injections in DIA mode.
Processing DDA library data with Spectronaut (V. 14.4.200727.47784, Biognosys), the spectral library was constructed and searched against the Uniprot Human FASTA database. For extraction of DIA data and protein quantification, DIA data was processed in Spectronaut for the spectral library search. Results were filtered with Q value cutoff of 0.01 (= FDR < 1%).
Enzyme-linked immunosorbent assay (ELISA) verification of efficacy biomarkers
To validate the proteomic results of SAA1, SAA2, S100A8, and S100A9, we quantified them by ELISA kits (Shanghai Enzyme-linked Biotechnology, China). We further recruited 22 additional independent patients with the same criteria as above and 15 healthy individuals from April 2021 to August 2021.
Statistical analysis
The protein quantifications in DIA data were normalized, and the identified proteins were annotated with the names of the corresponding genes. To identify protein biomarkers related to the efficacy of anti-PD-1 treatment, we analyzed changes in the levels of plasma proteins compared in responders and non-responders by using a Student’s t-test, at α = 0.05. Survival was estimated using Kaplan–Meier curve analysis, with statistical comparison using the Log-rank statistic. All analyses were performed in SPSS 19.0 (SPSS Inc., Chicago, IL, USA) and R, V.4.0.2.
Results
Patients and treatment
A total of 15 patients with NSCLC receiving first-line anti-PD-1 treatment, and the clinical characteristics at baseline are summarized in Table 1 and the detailed treatment history is shown in Supplementary Table S1. Among them, 12 patients were responders to anti-PD-1 treatment (PD-1-R) and three non-responders to anti-PD-1 treatment (PD-1-NR); moreover, PD-1-R achieved significantly longer PFS and OS compared to PD-1-NR (Fig. 1). The median follow-up time was 20 months with a range from 13 months to 21 months. In addition, 22 patients were recruited for the validation by ELISA (Table 1).
Patient and clinical characteristics of all patients with non–small cell lung cancer receiving anti-PD-1 inhibitors as first-line treatment
| Patient characteristics at baseline | DIA discovery cohort | Validation cohort |
|---|---|---|
| N (%) | N (%) | |
| Age | ||
| ≤65 | 8 (53.3) | 12 (54.5) |
| >65 | 7 (46.7) | 10 (45.5) |
| Sex | ||
| Male | 14 (93.3) | 19 (86.4) |
| Female | 1 (6.7) | 3 (13.6) |
| Histology | ||
| Adenocarcinoma | 13 (86.7) | 9 (40.9) |
| Squamous cell carcinoma | 2 (13.3) | 10 (45.5) |
| Other | 0 (0) | 3 (13.6) |
| ECOG performance status | ||
| 0–1 | 15 (100) | 22 (100) |
| >1 | 0 (0) | 0 (0) |
| Treatment line | ||
| 1 | 15 (100) | 22 (100) |
| >1 | 0 (0) | 0 (0) |
| Anti-PD-1 agent | ||
| Pembrolizumab | 10 (66.7) | 10 (45.5) |
| Nivolumab | 3 (20.0) | 2 (9.1) |
| Other | 2 (13.3) | 10 (45.5) |
| Response to anti-PD-1 treatment | ||
| Responders (anti-PD-1-R) | 12 (80.0) | 18 (81.8) |
| Non-responders (anti-PD-1-NR) | 3 (20.0) | 4 (18.2) |
PD-1-NR: patients treated without durable clinical benefit for anti-PD-1 treatment; PD-1-R: patients treated with durable clinical benefit for anti-PD-1 treatment.
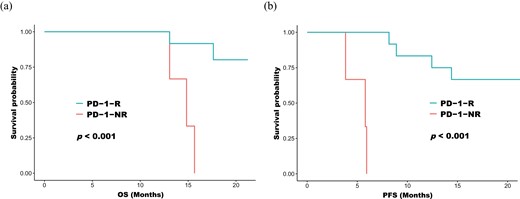
Kaplan–Meier curves on progression-free survival (a) and overall survival (b) in patients receiving anti-PD-1 treatment. PD-1-R: patients treated with durable clinical benefit with anti-PD-1 treatment; PD-1-NR: patients with no durable clinical benefit with anti-PD-1 treatment.
Plasma proteome profiles
To build comprehensive profiles of plasma proteins, we employed DIA which provides the unbiased, high-throughput identification and quantification of proteomic strategy [32]. Overall, DIA detected 835 unique proteins. Performing principal component analysis on plasma proteome profile, patients with NSCLC could be distinguished from healthy control (Fig. 2). The differentially expressed proteins (DEPs) between NSCLC cohorts and healthy individuals were further analyzed, and 170 DEPs were identified (Fig. 3a). These DEPs were annotated by InterProScan and mapped to pathways according to the Kyoto Encyclopedia of Genes and Genomes (KEGG) database to identify potentially anti-tumor immune pathways. We found enrichment of several immune-related pathways, including Rap1 signaling pathway, cytokine–cytokine receptor interaction, chemokine signaling pathway in the NSCLC cohort. Cancer-related pathways, the Hippo signaling pathway, was also enriched in the NSCLC cohort. In conclusion, the plasma proteomic expression profiles were distinguished healthy controls from patients with EGFR/ALK-negative NSCLC, and the differentially expressed proteins were associated with immune-related and cancer-related pathways.
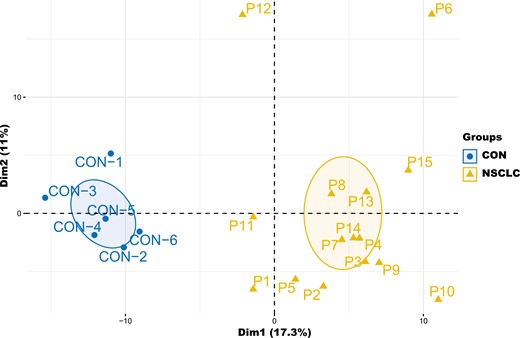
Principal component analysis of the plasma proteome profiles clearly distinguished EGFR/ALK negative non-small cell lung cancer from healthy control. CON: healthy control.
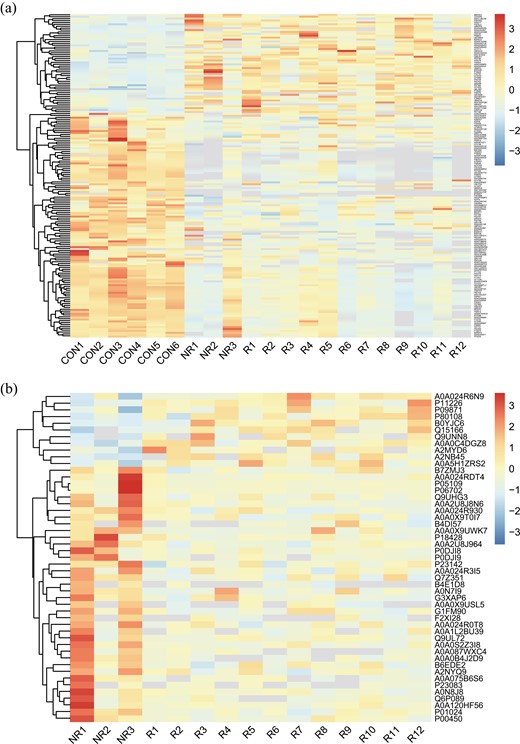
Differential protein clusters. a: CON vs. NSCLC; b: PD-1-NR vs. PD-1-R.
Analysis proteome profiles in anti-PD-1 treatment
To discover the potential efficacy biomarkers for anti-PD-1 treatment, the NSCLC patients were divided into responders (PD-1-R) and non-responders (PD-1-NR). Then we compared the proteome profile between PD-1-R and PD-1-NR using Student’s t-test (Fig. 3b). With cut-off at P <0.05 and log2 fold change ≥2 (Fig. 4), s100 calcium-binding protein A9 (S100A9) was considered as the most significant DEPs followed by serum amyloid A2 (SAA2), s100 calcium-binding protein A8 (S100A8), and serum amyloid A1 (SAA1) (Table 2).
Identification of plasma proteome profiles as potential efficacy biomarkers for anti-PD-1 treatment in non-small cell lung cancer patients.
| Protein | PD-1-NR | PD-1-R | Fold change | P value |
|---|---|---|---|---|
| S100A9 | 920094.8594 | 82799.32178 | 11.11234778 | 0.031385696 |
| SAA2 | 926826.2458 | 114108.5322 | 8.122322036 | 0.005804857 |
| S100A8 | 1798688.333 | 297069.791 | 6.054766886 | 0.043812289 |
| SAA1 | 1463064.109 | 343305.8711 | 4.261692655 | 0.006033998 |
| TNN | 154398.5605 | 46105.61792 | 3.348801459 | 0.023515524 |
| GP1BA | 45493.11654 | 98612.38184 | 0.461332702 | 0.010979697 |
| PON3 | 19781.77979 | 45370.44815 | 0.436005827 | 0.022172662 |
| PROZ | 36393.13932 | 149952.9984 | 0.242696977 | 0.022183389 |
| MBL2 | 76501.56966 | 319314.7513 | 0.239580443 | 0.032534972 |
| PROCR | 6369.072754 | 29230.80545 | 0.217889061 | 0.030248433 |
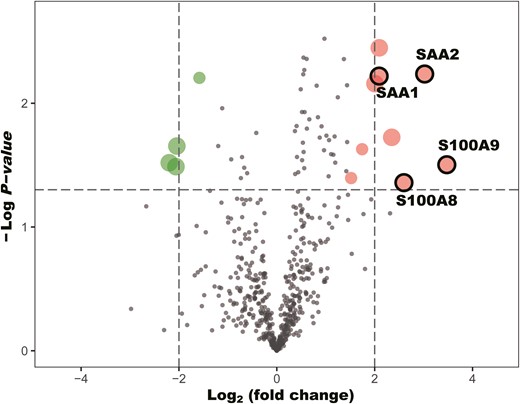
Volcano plots on comparing the change (log2 fold change) in protein plasma levels between responders and non-responders of non-small cell lung cancer receiving first-line anti-PD-1 treatment. Proteins above the dotted line (P value < 0.05).
We further assessed the proteomic expression of SAA1, SAA2, S100A8, and S100A9 in NSCLC patients and healthy control. As shown in Fig. 5, SAA1 and SAA2 in PD-1-NR demonstrated significant differences in proteome profiles relative to PD-1-R. The S100 family, S100A8 and S100A9, also significantly decreased in PD-1-R than PD-1-NR. Moreover, compared with healthy control and PD-1-R, SAA1, SAA2, S100A8, and S100A9 showed upregulation in PD-1-NR (Fig. 5). In conclusion, a high level of SAA1, SAA2, S100A8, and S100A9 might associate with poor efficacy, and these four proteins could constitute a predictive panel for anti-PD-1 treatment.
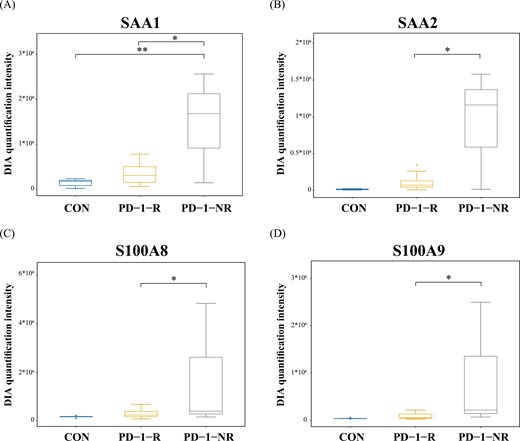
Box plot showing protein abundances of SAA1 (a), SAA2 (b), S100A8 (c), and S100A9 (d) in DIA quantification intensity in each sample group. *P < 0.05 and **P < 0.01 using a Student’s t-test. .
Different proteomic expression profiles between responders and non-responders
According to the above analysis, 49 DEPs were identified between PD-1-R and PD-1-NR. To understand the biological relevance of the alternating proteins, the gene ontology (GO) was used to cluster DEPs according to their associated biological processes. The DEPs involved in immune system processes, due to the responsive anti-PD-1 treatment (Fig. 6a). Among these DEPs, through KEGG, are related to Toll-like receptor signaling pathway, NF-kappa B signaling pathway, and IL-17 signaling pathway involved in immune response, and further, reveal the potential molecular mechanism of non-responding immunotherapy to tumor-induced up-regulation proteins (Fig. 6b).
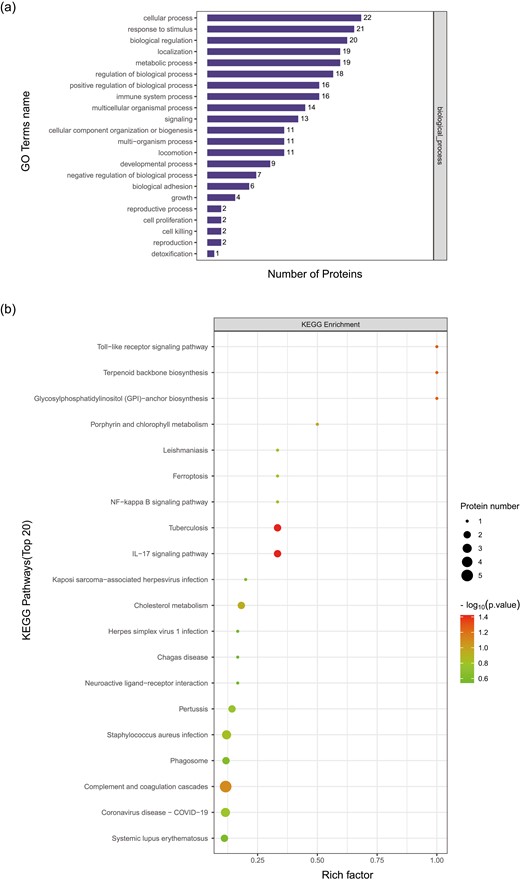
Protein GO enrichment in PD-1-R vs. PD-1-NR based on biological process which involved in immune system processes (a). KEGG pathway analysis in PD-1-R vs. PD-1-NR of proteins in Toll−like receptor signaling pathway, NF−kappa B signaling pathway, and IL-17 signaling pathway (b).
Validation by ELISA
After the discovery-based proteomics, SAA1, SAA2, S100A8, and S100A9 were found to be an important role to distinguish between PD-1-R and PD-1-NR. The concentration of these four proteins was measured in 15 patients and 6 healthy controls; however, 4 samples could not be tested by ELISA due to insufficient volume. To further strengthen the significance of our findings, we also performed ELISA on additional independent samples of 22 patients and 15 healthy individuals.
All 54 samples (33 patients and 21 healthy individuals) had detectable values of these four proteins by ELISA. The ELISA assay results confirmed that the level of SAA1, SAA2, S100A8, and S100A9 were significantly higher expressed in PD-1-NR compared with both PD-1-R and healthy controls (P < 0.05 for all, Fig. 7).
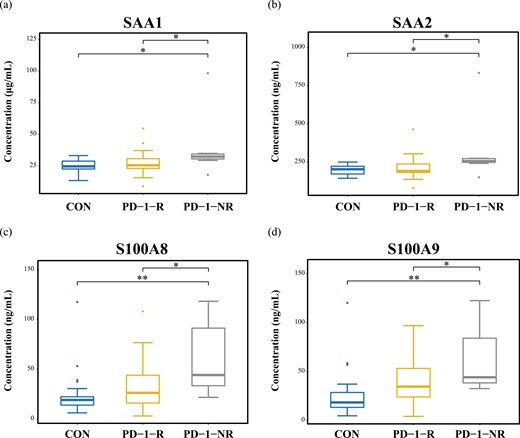
Validation by ELISA of expression of SAA1 (a), SAA2 (b), S100A8 (c), and S100A9 (d) in each sample group. *P < 0.05 and **P < 0.01 using a Student’s t-test.
Discussion
With 835 proteins identified, we presented a plasma proteome to analyze NSCLC patients with first-line anti-PD-1 inhibitors, which provided a unique insight of protein expression on the prediction of first-line anti-PD-1 treatment efficacy. In this study, we used mass spectrometry-based proteomics analytical technique, data-independent acquisition (DIA), which is an untargeted unbiased manner with high throughput to identify and quantify proteins for new diagnostic biomarkers [33]. The main finding of our study was that the upregulation of SAA1, SAA2, S100A8, and S100A9 in PD-1-NR compared with PD-1-R was related to the unfavorable response of anti-PD-1 treatment.
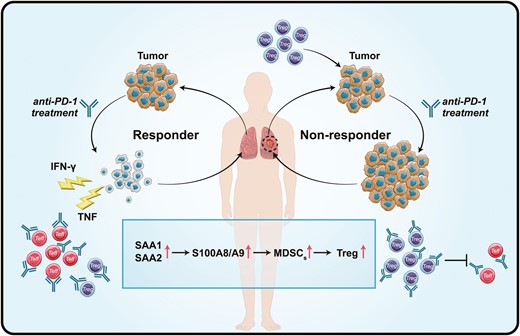
We detected that the expression of S100A8 and S100A9 in PD-1-NR was higher than that of PD-1-R and healthy control. As the members of the S100 family, the function and origin of S100A8 and S100A9 have not been fully investigated in NSCLC [34, 35]. Early mass spectrometry study shows that S100A8 and S100A9 usually exist in the form of heterodimeric complexes, and form a heterotetramer in the presence of calcium [36]. In the context of cancer, expression of S100A8/S100A9 induces myeloid-derived suppressor cells (MDSCs) which is a heterogeneous population of immature myeloid cells with potent immunosuppressive activity [37–39]. Studies have further revealed that MDSCs can modulate the de novo generation and induction of regulatory T (Treg) cells to constrain the activation of effector T cells [40]. Recently, Shogo et al. observed that non-responders have high PD-1 expression by effector Treg cells which enhance immunosuppressive activity by anti-PD-1 inhibitors and predict the efficacy of anti-PD-1 treatment [41]. Altogether, high expression of S100A8 and S100A9 up-regulate Treg via MDSCs, and negatively impacts the PD-1 blockade therapies (Fig. 8).

Schematic diagram of the potential mechanism of the increased protein expression (SAA1, SAA2, S100A8, and S100A9) determine the efficacy of anti-PD-1 treatment.
In addition to S100A8 and S100A9, we also used two principally different analytical techniques, DIA and ELISA, and both showed an increase in SAA1 and SAA2 before anti-PD-1 treatment in PD-1-NR. The SAA family is composed of four variants, among which two (SAA1 and SAA2) are associated with inflammatory reactions and cancer [42]. Structurally, the primary sequences of human SAA1 and SAA2 share up to 90% of homology, and consequently distinguishing both SAA isoforms by mass spectrometry-based protein assays or antibody-based immunoassays is needed [43]. SAA contributes significantly to cancer progression and the presence of SAA in the tumor microenvironment is an indicator of tumor aggressiveness [44]. SAA positively regulates their own transcription and induces the expression of S100A8 and S100A9 protein, which acted as the feedforward loops. Thus, these proteins strongly activated tumor cell adhesion to fibronectin and stimulated migration and invasion of cancer [45]. As shown in Figs. 5 and 7, the clinical investigation showed that the level of SAA1 and SAA2 was significantly higher in the ICIs non-responders compared to responders, even healthy individuals. Interestingly, a similar increasing trend was also observed for the expression of S100A8 and S100A9. It could be a positive feed-forward loop mechanism that establishes an inflammatory milieu and provides a strong stimulus to tumor growth, and further enhanced immunosuppressive activity (Fig. 8).
There are some limitations to our results. We did not simultaneously detect other biomarkers to evaluate the diagnostic accuracy of these potential protein biomarkers; however, providing a set of reliable biomarkers (SAA1, SAA2, S100A8, and S100A9) instead of a single marker would enable the development of highly specific assays for patients undergoing ICIs therapy to spare ineffective treatments. Although ELISA validation of independent samples confirmed our findings, the limited sample size may also be considered a limitation, hence larger studies are needed to confirm our findings in the future. Unfortunately, we did not collect serial plasma samples during the whole treatment course to timely monitor the level of proteins expression. Anyway, using a less invasive method to collect blood samples and overcoming spatial heterogeneity are the advantage of liquid biopsy rather than tissue sampling.
Conclusions
In summary, these four proteins were identified and used as potential biomarkers for the first-line anti-PD-1 treatment to distinguish patients with NSCLC receiving immunotherapy. A large cohort validation and other biomarkers comparison would be valuable research undertakings in the future. Meanwhile, the relevant studies are needed to reveal the exact role of four proteins in PD-1 blockade therapies.
Abbreviations
- DEPs
differentially expressed proteins
- DIA
data-independent acquisition
- ELISA
enzyme-linked immunosorbent assay
- FASP
filter-aided sample preparation
- GO
gene ontology
- ICIs
immune checkpoint inhibitors
- KEGG
Kyoto encyclopedia of genes and genomes
- MDSCs
myeloid-derived suppressor cells
- NSCLC
non-small cell lung cancer
- ORR
objective response rate
- OS
overall survival
- PD-1
programmed cell death protein 1
- PD-L1
programmed cell death 1 ligand 1
- TMB
tumor mutational burden
- Treg
regulatory T
Acknowledgments
We thank the patients and their families for their contribution to this study. We thank Liuya Yang, Kaiwen Chu, Jianxia Wang, Guilong Qin, Wei Wang, and Jingjing Liu for careful technical assistance.
Funding
The National Natural Science Foundation of China [81770075, 82041003, 81630001], Science and Technology Commission of Shanghai Municipality [20DZ2261200, 20Z11901000, 20XD1401200] National key R&D plan [2020YFC2003700], Clinical Research Plan of SHDC [SHDC2020CR5010-002], Shanghai Municipal Key Clinical Specialty [shslczdzk02201], and Shanghai Engineer & Technology Research Center of Internet of Things for Respiratory Medicine [20DZ2254400].
Conflict of Interest
The authors have no conflict of interest.
Author contributions
Conceptualization: YC, JH, YS; Resources: XW, XW, SJ; Methodology: WJ; Visualization: YC, WJ, CC; Formal analysis: XW, XW, SJ; Project administration: CC; Supervision: JZ, QH; Funding acquisition: YS; Roles/writing—original draft: YC; Writing—review and editing: JH, YS. All authors read and approved the final manuscript.
Ethics approval
This research was ethically approved by the ethics committee at Zhongshan Hospital (B2020-431R).
Data availability
The datasets generated during the current study are not publicly available due this study is not yet published, but are available from the corresponding author on reasonable request.
References
Author notes
These authors have contributed equally to this work.
