


Summary
Alemtuzumab, a humanized anti-CD52 monoclonal antibody, is approved for treatment of relapsing multiple sclerosis (MS). In the Phase II/III trials, patients received 12 or 24 mg/day of alemtuzumab in two treatment courses (5 days for course 1 and 3 days for course 2), 12 months apart. Serum concentrations of alemtuzumab peaked on the last day of dosing in each course and mostly fell below the limit of quantitation by day 30. Alemtuzumab rapidly depleted circulating T and B lymphocytes, with the lowest observed values occurring within days. Lymphocytes repopulated over time, with B cell recovery usually complete within 6 months. T lymphocytes recovered more slowly and generally did not return to baseline by 12 months post-treatment. Approximately 40 and 80% of patients had total lymphocyte counts, reaching the lower limit of normal by 6 and 12 months after each course, respectively. The clearance of alemtuzumab is dependent on circulating lymphocyte count. A majority of treated patients tested positive for anti-alemtuzumab antibodies, including inhibitory antibodies, during the 2-year studies, and a higher proportion of patients tested positive in course 2 than in course 1. The presence of anti-alemtuzumab antibody appeared to be associated with slower clearance of alemtuzumab from the circulation but had no impact on the pharmacodynamics. No effects of age, race or gender on the pharmacokinetics or pharmacodynamics were observed. Together, the pharmacokinetics, pharmacodynamics and immunogenicity results support the continued development and use of alemtuzumab for the treatment of MS, and probably explain its sustained effects beyond the dosing interval.
Alemtuzumab, a humanized anti-CD52 monoclonal antibody, given to multiple sclerosis (MS) patients at 12 or 24 mg/day in two treatment courses (5 days for course 1 and 3 days for course 2), 12 months apart, rapidly depleted circulating T and B lymphocytes, with the lowest observed values occurring within days. Lymphocytes repopulated over time, with B cell recovery usually complete within 6 months. T lymphocytes recovered more slowly and generally did not return to baseline by 12 months post-treatment. The pharmacokinetics, pharmacodynamics and immunogenicity of alemtuzumab in MS were discussed.
Introduction
Multiple sclerosis (MS) is a chronic immune-mediated disorder of the central nervous system (CNS), involving the brain and spinal cord. It represents the leading cause of neurological disability in young and middle-aged adults (typical onset between the ages of 20 and 50 years), affecting more than 2·3 million people worldwide (National Multiple Sclerosis Society, 2018), with at least two to three times more women than men being diagnosed with the disease. Pathologically, MS is characterized by demyelinated plaques in the brain and spinal cord associated with inflammatory infiltrates consisting of macrophages/microglia and lymphocytes (T and B cells); axonal loss and gliosis with astrocyte proliferation and glial fibre production are also noted [1]. MS can be categorized as relapsing MS and progressive forms of MS, and categorized further in different phenotypes based on disease activity and clinical progression, including clinically isolated syndrome (CIS), relapsing–remitting MS (RRMS), primary progressive MS (PPMS) and secondary progressive MS (SPMS) [2]. Up to 80% of all MS patients present with RRMS [2]. The clinical course of RRMS typically manifests as episodes of transient neurological compromise or deficit (i.e. relapses, clinical exacerbations or attacks) with variable recovery (remissions) leading eventually to cumulative deficits that may increase acutely with each new relapse episode, leading to gradual accumulation of irreversible disability and transition to SPMS.
Alemtuzumab is a genetically engineered human immunoglobulin subclass gamma 1 (IgG1) kappa monoclonal antibody containing six complementarity-determining regions derived from an IgG2a rat monoclonal antibody, specific for the human cell surface glycoprotein CD52. Alemtuzumab was developed originally at the University of Cambridge in the United Kingdom [3] and was investigated later for a variety of diseases, including non-Hodgkin's lymphoma [4], refractory vasculitis syndrome [5], rheumatoid arthritis [6], graft-versus-host disease and prevention of bone marrow rejection [7,8]. Alemtuzumab was first approved in 2001 by the US Food and Drug Administration (FDA) and the European Medicines Agency (EMA) for the treatment of B cell chronic lymphocytic leukaemia (B-CLL) under the name Campath® and MabCampath®, respectively [9], and since 2001 has been used in medical practice in the treatment of other haematological malignancies, transplant rejection and CNS demyelinating disorders, as well as for conditioning prior to transplant [10–13]. The use of alemtuzumab to treat MS was first tested in investigator-sponsored pilot studies in the 1980s to the 1990s, which suggested that there is a ‘window of therapeutic opportunity’ for immunotherapies in MS [14], and in 2002 clinical evaluation of alemtuzumab for use in relapsing forms of MS was initiated. Alemtuzumab was approved by the EMA in 2013 for adult patients with RRMS with active disease defined by clinical or imaging features, and by the FDA in 2014 for the treatment of RMS. Alemtuzumab is currently marketed under the name Lemtrada®. The recommended dose is 12 mg/day administered by intravenous (i.v.) infusion for two treatment courses, 12 mg/day on 5 consecutive days for the first course and 12 mg/day on 3 consecutive days 12 months later for the second course. Retreatment with up to two additional treatment courses, as needed, was recently approved by the EMA. The third or fourth course at 12 mg/day on 3 consecutive days (36 mg total dose) is administered at least 12 months after the prior treatment course in patients with MS disease activity defined by clinical or imaging features.
The mechanism by which alemtuzumab exerts its therapeutic effects in MS presumably involves immunomodulation through the depletion and repopulation of lymphocytes. Alemtuzumab binds specifically to CD52, a cell surface antigen that is expressed at high levels on the surface of T and B lymphocytes, at lower levels on NK cells, monocytes, dendritic cells, macrophages and eosinophils, with little to no expression on neutrophils, plasma cells and bone marrow stem cells [15,16]. The function of CD52 is not well understood, but evidence suggests that it may be involved in T cell co-stimulation and migration [17,18]. Following cell surface binding of alemtuzumab to lymphocytes, alemtuzumab results in the depletion of circulating CD52-positive cells in a rapid and profound manner, and the proposed mechanism of lymphocyte depletion includes antibody-dependent cell-mediated cytolysis (ADCC), complement-dependent cytolysis (CDC) and induction of apoptosis [15,19–22]. Studies in huCD52 transgenic mice suggested that the depletion of peripherally circulating lymphocytes was near-complete, while little effect on cells of the innate immune system (neutrophils and NK cells) was observed, and the degree of depletion in lymphoid organs (spleen, lymph nodes, bone marrow and thymus) was less profound [15]. It is likely that this selective lymphocyte depletion is the beginning of a series of immunological changes that may contribute to the long-term therapeutic and some safety events of alemtuzumab in MS patients, and that the long-term clinical effects of alemtuzumab may also be attributable to qualitative changes in repopulating lymphocyte subsets leading potentially to a rebalancing of the immune system [23–25]. Research suggests immunomodulatory effects through the depletion and repopulation of lymphocytes, including alterations in the number, proportions and properties of some lymphocyte subsets post-treatment, increased representation of regulatory T cell subsets, increased representation of memory T and B lymphocytes, and transient effects on components of innate immunity (i.e. neutrophils, macrophages and NK cells). The reduction in the level of circulating B and T cells by alemtuzumab and subsequent repopulation may reduce the potential for relapse, which ultimately delays disease progression. Several lines of clinical evidence indicate that alemtuzumab alters the number, proportions and properties of some lymphocyte subsets after repopulation [23,26–30].
The efficacy and safety related to the use of alemtuzumab in MS have been published extensively; however, an in-depth review focusing on its clinical pharmacology profile is lacking. Herein we provide a comprehensive overview of the three key aspects of clinical pharmacology of alemtuzumab, including pharmacokinetics (PK), pharmacodynamics (PD) and immunogenicity in MS based primarily on the collective data from the Phase II (CAMMS223) and Phase III trials (CARE-MS I and CARE-MS II). Understanding the immunogenicity profile of a therapeutic antibody is important not only because anti-drug antibody is one of the factors that may impact PK, but also because a potential safety consideration after administration of such a biological drug is the development of an immune response [31,32]. The development of antibodies to humanized monoclonal antibodies or other biologicals, e.g. beta-interferon (IFN-β), infliximab and natalizumab, has been associated with an increase in infusion-related adverse reactions and, for some patients, reduced efficacy [33–37].
The approved clinical dose of alemtuzumab is 12 mg/day i.v. on 5 consecutive days (course 1), followed 12 months later by 12 mg/day i.v. on 3 consecutive days (course 2). This treatment regimen was used initially in the pilot MS studies guided by historical data from the use of Campath in oncology and by pilot studies in patients with rheumatological disorders [6,38,39]. The MS pilot studies were carried out with one or two pulsed courses of a fixed dose of 20-mg alemtuzumab given over 3 or 5 days (total dose of 100 mg in course 1 and 60 mg in course 2). Each annual treatment course with alemtuzumab was administered in equal daily-divided doses to improve tolerability, especially with regard to infusion-associated reactions (IARs) [40]. The annual dosing interval was initiated given the observation that disease activity returned in some patients approximately 1 year after the previous treatment course. The dose for course 2 was calculated as 60% of the initial dose, i.e. a 3-day course instead of a 5-day course (course 1), to account for the reduced lymphocyte levels at month 12 compared with baseline. It was noted that this treatment regimen significantly suppressed relapses and cerebral inflammation [measured by magnetic resonance imaging (MRI)] for at least 6 years [14]. The selection of the dose and dosing regimen used in the Phase II trial in MS was based on these observations. Data from the Phase II trials then guided the subsequent dose selection for the Phase III trials. The approved dose is 12 mg/day administered by i.v. infusion for two treatment courses, 12 mg/day on 5 consecutive days for the first course and 12 mg/day on 3 consecutive days 12 months later for the second course. Retreatment with up to two additional treatment courses, as needed, was recently approved by the EMA based on the data from the long-term extension study [43,49].
Methods
Study design and patients
The Phase II (CAMMS223) and Phase III (CARE-MS I and CARE-MS II) studies were global, active-controlled, head-to-head, randomized, rater-blinded studies comparing the safety and efficacy of alemtuzumab (Lemtrada®) to subcutaneous (s.c.) IFN-β-1a (Rebif®) in patients with RRMS. All patients had active MS, with studies CAMMS223 and CARE-MS I enrolling treatment-naive patients with early, active RRMS [onset of MS symptoms within the past 3 or 5 years prior to study, and screening expanded disability status scale (EDSS) score of 0·0–3·0] and study CARE-MS II enrolling patients (onset of MS symptoms within the past 10 years prior to study, and screening EDSS score of 0·0–5·0 and an MRI scan with abnormalities exceeding threshold criteria) who had at least one relapse during prior treatment with primarily IFN-β-1a or glatiramer acetate for ≥ 6 months (the available drug modifying treatments at the time of this trial) after having received that therapy for at least 6 months. All three active-controlled studies had the same two co-primary efficacy end-points: relapse rate and time to 6-month sustained accumulation of disability [SAD (based on changes in EDSS)] (Table 1). Eligible patients were randomized to receive annual courses of alemtuzumab or SC IFN-β-1a three times weekly. Patients assigned to alemtuzumab received five daily i.v. infusions during course 1 at baseline, and three daily i.v. infusions during course 2 (12 months later). Treatment with a third course (course 3) of alemtuzumab administered ≥ 12 months after course 2 was optional, and was at the discretion of the treating physician based on lymphocyte counts but unrelated to disease activity. Patients assigned to s.c. IFN-β-1a were to receive injections of 44 μg three times a week from baseline to month 24, after initial dose titration.
Study designs of alemtuzumab Phases II and III clinical trials in multiple sclerosis (MS)
| Phase II | Phase III | ||
|---|---|---|---|
| Study | Study CAMMS223 | Study CARE-MS I | Study CARE-MS II |
| Patients (n) | 334 | 581 | 840 |
| RRMS | Treatment-naive | Treatment-naive | Relapsed on prior treatment |
| Population | |||
| Study duration | 3 years (+ follow-up) | 2 years | 2 years |
| Treatment arms | Alemtuzumab | Alemtuzumab | Alemtuzumab |
| 12 or 24 mg | 12 mg | 12 or 24 mg | |
| SC IFN-β-1a 44 µg | SC IFN-β-1a 44 µg | SC IFN-β-1a 44 µg | |
| Primary end-points | Relapse rate and 6-month sustained accumulation of disability (confirmed disability worsening) | ||
In an early amendment to the study, the alemtuzumab 24-mg/day arm was closed to enrolment in order to reduce the duration of the enrolment period, which also reduced sample size and the overall duration of the study. The decision to close the alemtuzumab 24-mg/day arm to enrolment was based on the observed patient recruitment rates and did not involve review of statistical analyses of Phase III efficacy or safety data.
After completion of the studies, patients in the Phase II and Phase III trials had the option to enter an extension study to support long-term safety monitoring and efficacy assessments with additional as-needed retreatment. In the extension, patients on s.c. IFN-β-1a were switched to alemtuzumab with two fixed, annual courses followed by optional, as-needed retreatment. Each enrolled patient was to remain in the extension study for at least 48 months from study entry.
The Phase II and Phase III clinical trials were conducted in accordance with the ethical principles of the Declaration of Helsinki, and the protocols approved prior to initiation of the study by Institutional Review Boards as described in the International Council for Harmonization (ICH) guidelines for Good Clinical Practice. Written informed consent was obtained from all study participants prior to enrolment.
Pharmacokinetics assessment: determination of alemtuzumab concentrations in serum
Alemtuzumab serum concentrations were determined using validated quantitative immunoassay or flow cytometry methods. For CARE-MS I and CARE-MS II, the serum concentration of alemtuzumab was determined using an electrochemiluminescence (ECL) bridging immunoassay and a drug standard curve. Briefly, MesoScale Discovery standard plates (MSD) were coated with an alemtuzumab-specific murine monoclonal anti-idiotype antibody (mP11C7) followed by affinity capture of alemtuzumab in diluted serum samples. Bound drug was detected using a SulfoTag-conjugated anti-human IgG1 monoclonal antibody and the chemiluminescent signal generated by incubation with MSD Read Buffer T prior to being read on the MSD 2400 Imager. The concentration of alemtuzumab was determined by interpolation of the sample ECL signal to a 5-parameter fit standard curve (SoftMax Pro GXP 5.2; Molecular Devices, Sunnyvale, CA, USA) and corrected for any dilution factor. The lower limit of quantitation (LOQ) for alemtuzumab was 60 ng/ml in the MSD ECL assay. For study CAMMS223, serum concentrations of alemtuzumab were determined using a validated flow cytometry method. The LOQ for alemtuzumab was 500 ng/ml.
In CARE-MS I and CARE-MS II, patients from selected study centres who received alemtuzumab were allowed to choose assignment to either of two PK groups: a dense-sampling group and a sparse-sampling group. Patients in the dense-sampling group were to have had blood drawn within 1 h prior to treatment (predose at month 0) and 15 min prior to the end of infusion on days 1–5; and once on days 8, 10, 12, 16, 19, 24 and months 1, 3 and 6 in course 1. In course 2 these patients had blood drawn within 1 h prior to treatment (predose at month 12) and 15 min prior to the end of infusion on days 1–3 and once on days 5, 8, 10, 15, 18 and 22 and months 13, 15 and 18 (corresponding to 1, 3 and 6 months post-dose relative to the first dose of course 2). Patients in the sparse-sampling group were to have had blood drawn predose and 15 min prior to the end of infusion on days 1–5 and once at months 1, 3 and 6 in course 1. In course 2 these patients had blood drawn predose and 15 min prior to the end of infusion on days 1–3 and once at months 13, 15 and 18.
In CAMMS223, blood samples for PK were collected in 19 patients treated at a single study site. Samples were to be collected during and after each treatment course at months 0, 12 and 24; specifically at 0, 4, 8, 24, 28, 32, 48, 52, 56, 72, 76, 80, 96, 100 and 104 h post-dose (relative to the first dose of a treatment course) during week 1, and once at weeks 1, 2, 3 and 4 after the last dose of a treatment course.
Pharmacodynamics assessment: lymphocyte phenotyping in blood
To monitor the extent of lymphocyte depletion and repopulation, standard lymphocyte phenotyping, including measurement of major circulating T lymphocyte subsets and B lymphocytes, was performed in blood, including a standard, six-colour TBNK (T cells, B cells and NK cells) panel (CD3+, CD4+, CD8+, CD19+, CD16+CD56+ and total lymphocytes). Lymphocyte phenotyping for all three clinical studies was performed by flow cytometry using commercially available methods. Quest Diagnostics (Exton, PA, USA) performed the lymphocyte phenotyping for CARE-MS I and CARE-MS II, which included absolute lymphocyte counts. Phenotyping for lymphocyte subsets in CAMMS223 was performed by Cirion BioPharma Research, Inc. (Quebec, Canada) and Charles River Laboratories International, Inc. (Wilmingtom, MA USA; formerly Inveresk Research, Edinburgh, UK). Total lymphocyte counts for CAMMS223 were based on lymphocyte counts performed as part of the haematology evaluations, and assessed using commercially available methods. The reference ranges may vary depending on the individual laboratory, instruments and methods.
In CARE-MS I and CARE-MS II, blood samples for lymphocyte phenotyping were collected from all patients at screening and at quarterly visits on all patients and additionally at months 1 and 13 on alemtuzumab-treated patients. In CAMMS223, samples for total lymphocyte count as part of the haematology evaluations were collected from patients prior to treatment, weekly during the first month and then at 1, 3, 6, 9 and 12 months post-treatment in each course.
Samples for lymphocyte subsets were collected prior to treatment and at 1, 3, 6, 9 and 12 months post-treatment in each course.
Immunogenicity assessment: determination of anti-alemtuzumab antibodies in serum
The presence of anti-alemtuzumab antibodies was determined in serum for all patients randomized to alemtuzumab using a validated bridging immunoassay or an enzyme-linked immunosorbent assay (ELISA).
Serum samples from CARE-MS I and CARE-MS II were tested for anti-alemtuzumab antibodies using a three-tier approach. First, samples were screened for anti-alemtuzumab antibodies (ADA) using a validated bridging immunoassay (MSD technology platform). A patient sample was positive if the signal-to-background ratio (S/B) was equal to or greater than the screening assay cut-point value; otherwise, it was considered negative. Secondly, the specificity of samples positive for ADA was confirmed using a validated competitive binding assay. Serum samples positive in both the screening and confirmatory antibody assays were then serially diluted in the bridging immunoassay and the final antibody titre reported as the reciprocal of the highest dilution where the S/B value was above the titre assay cut-point. The final ADA results were reported as a titre (not a concentration). Finally, patient serum samples positive for ADA were assessed for inhibitory anti-alemtuzumab antibodies (inhibitory ADA) by cell-based flow cytometry assay. This assay was designed to test whether the anti-alemtuzumab antibodies could prevent binding of alemtuzumab to Chinese hamster ovary cells (CHO) transfected with CD52. Samples with alemtuzumab percentage of binding less than the assay cut-point were considered positive and the inhibitory antibody titre was defined as the highest reciprocal of the last serum dilution that tested below the assay cut-point.
For CAMMS223, serum samples from alemtuzumab-treated patients were analysed for the presence of ADAs using an ELISA assay. A measure of the ADA level was determined relative to a reference monoclonal anti-alemtuzumab antibody, and ADA levels were categorized post-hoc as follows: values < 444 U/ml, below the limit of quantitation (BLQ); values between 444 and 2000 U/ml, low positive; values > 2000 U/ml, high positive. Representative samples which were found to be ADA-positive (i.e. concentration > 444 U/ml) were analysed in a cell-based assay using human T lymphocytes to quantitatively assess the inhibitory antibody activity, expressed as a dilution titre.
In all three studies, samples were collected at baseline and 1, 3 and 12 months following each treatment course for immunogenicity assessment.
Data analysis
Descriptive statistical analysis was conducted for serum concentrations of alemtuzumab (PK) and lymphocyte and subset counts (PD) for all studies. The Phase III PK and PD results are presented from the pooled data set of CARE-MS I and CARE-MS II, while the Phase II results are presented separately. The Phase III and Phase II data are presented separately due to differences between Phase II and Phase III trials in several aspects: assay differences for both PK and PD as described in Methods, and differences in sampling schemes.
PK and PD data were analysed by study and Phase III data were also pooled and analysed by dose and treatment course. Statistical analyses were performed using sas® version 9 or higher (SAS Institute, Cary, NC, USA).
Results
Pharmacokinetics of alemtuzumab in MS
The PK of alemtuzumab were evaluated in a total of 216 MS patients (19 in CAMMS223, 57 in CARE-MS I and 140 in CARE-MS II) who received a daily dose of 12 mg (157 patients) or 24 mg (59 patients) for 5 days, followed by a 3-day treatment course 12 months after the initial course. Baseline characteristics for those patients in CAMMS223, CARE-MS I and CARE-MS II who were included in the PK analyses for the individual studies are shown in Table 2.
Demographic and baseline characteristics for patients included in pharmacokinetic (PK) analyses
| Study | CAMMS223 | CARE-MS I | CARE-MS II | ||
|---|---|---|---|---|---|
| Dose cohort | 12 mg | 24 mg | 12 mg | 12 mg | 24 mg |
| Patients (n) | 9 | 10 | 57 | 91 | 49 |
| Age (years) | |||||
| Mean (s.d.) | 29·6 (7·21) | 37·6 (6·92) | 35·6 (8·32) | 37·6 (8·41) | 36·3 (9·28) |
| Median | 29·0 | 35·0 | 36·0 | 38·0 | 38·0 |
| Min, max | 21·0, 44·0 | 31·0, 48·0 | 20·0, 50·0 | 21·0, 53·0 | 20·0, 53·0 |
| Gender, n (%) | |||||
| Male | 5 (55·6) | 2 (20·0) | 12 (21·1) | 24 (26·4) | 9 (18·4) |
| Female | 4 (44·4) | 8 (80·0) | 45 (78·9) | 67 (73·6) | 40 (81·6) |
| Race, n (%) | |||||
| White | 9 (100·0) | 10 (100·0) | 51 (89·5) | 78 (85·7) | 41 (83·7) |
| Black | – | – | 4 (7·0) | 10 (11·0) | 5 (10·2) |
| Asian | – | – | 1 (1·8) | – | – |
| American Indian or Alaska Native | – | – | 1 (1·8) | 3 (3·3) | 3 (6·1) |
| Weight (kg) | |||||
| Mean (s.d.) | 69·7 (14·05) | 76·2 (27·17) | 80·1 (18·25) | 83·8 (17·89) | 79·2 (23·04) |
| Median | 71·0 | 69·3 | 76·4 | 83·7 | 73·1 |
| Min, max | 51·3, 97·0 | 52·6, 147·2 | 53·1, 141·3 | 50·3, 146·1 | 49·3, 188·2 |
The results of the Phases II and III studies showed consistent trends in alemtuzumab PK. Serum concentrations increased with each daily administration within a treatment course, with the highest observed concentrations occurring following the last dose (Fig. 1). There was considerable intersubject variability in the serum concentrations of alemtuzumab. The mean maximum serum concentration (Cmax) values were comparable between courses. Based on the pooled data from the Phase III studies, administration of the 12-mg dose of alemtuzumab resulted in a Cmax of 3014 ng/ml on day 5 of the initial treatment course (course 1) and 2276 ng/ml on day 3 of the second treatment course (course 2). Serum alemtuzumab concentrations were higher following administration of the 24-mg dose compared with the 12-mg dose, resulting in a Cmax of 3965 ng/ml on day 5 of course 1 and 3357 ng/ml on day 3 of the second treatment course. The post-infusion serum concentrations on day 1 were dose-proportional between 12 and 24 mg following the first or second treatment course, but less than dose-proportional at the end of treatment courses. There were modest accumulations after daily administration of alemtuzumab at both dose levels during each treatment course. The accumulation factors based on Cmax were in the range of 1·6 to 3·1 (Table 3). Serum concentrations became low or undetectable within approximately 30 days (month 1) following each treatment course in the 12-mg dose group and within approximately 90 days (month 3) following each treatment course in the 24-mg dose group. In the pooled Phase III data set, including both 12- and 24-mg dose groups (treatment course 1 and course2), by 1 month post-treatment approximately 65–80% of concentrations evaluated were BLQ and by 3 months post-treatment 95% of concentrations were BLQ. PK parameters were not estimated based on individual serum concentration–time profiles using compartmental or non-compartmental analyses due to inadequate data points on the individual patient basis. All PK data from the Phase II and Phase III trials were pooled and a population PK analysis was conducted (see Section Population PK analysis).
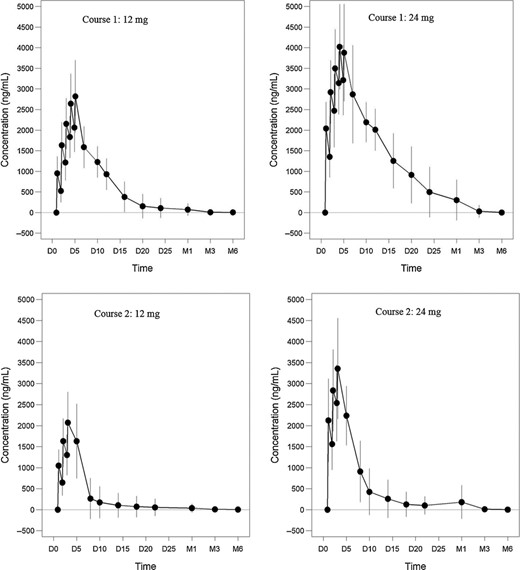
Mean (± standard deviation) alemtuzumab serum concentration over time after intravenous (i.v.) administration at 12 mg/day or 24 mg/day for 5 days in courses 1 and 3 days in course 2 with 12 months apart between courses (CARE-MS II). Shown are profiles for course 1 of the 12-mg cohort (upper left), course 1 of the 24-mg cohort (upper right), course 2 of the 12-mg cohort (lower left) and course 2 of the 24-mg cohort (lower right). Serum concentrations increased with each daily administration within a treatment course, with the highest observed concentrations occurring following the last dose. The mean maximum serum concentration (Cmax) values were comparable between courses. Serum concentrations became low or undetectable (LOQ = 60 ng/ml) within approximately 30 days following each treatment course in the 12-mg dose group and within approximately 90 days following each treatment course in the 24-mg dose group. D = day, M = month.
Summary of serum concentrations (Cmax) of alemtuzumab post infusion (pooled data from CARE-MS I and CARE-MS II)
| 12 mg | 24 mg | ||||
|---|---|---|---|---|---|
| Post-infusion serum concentrations (Cmax, ng/ml) | Treatment | 1st course | 2nd course | 1st course | 2nd course |
| n | 142–144 | 133–137 | 46-49 | 47 | |
| Mean (s.d.) [min, max] | Day 1 | 1032 (367) | 1101 (420) | 2041 (643) | 2126 (991) |
| [135, 2666] | [0, 2666] | [452, 3942] | [0, 6056] | ||
| Day 3 | 2307 (663) | 2276 (804) | 3500 (948) | 3357 (1198) | |
| [357, 4282] | [974, 5226] | [2073, 7105] | [1452, 7971] | ||
| Day 5 | 3014 (941) | n.a. | 3965 (1037) | n.a. | |
| [911, 5986] | n.a. | [2471, 7388] | n.a. | ||
| Accumulation ratio | 3·1 (0·9) | 2·1 (0·5) | 2·2 (0·9) | 1·6 (0·5) | |
| [1·0, 6·8] | [1·2, 3·9] | [1·0, 6·1] | [0·5, 3·0] | ||
Pharmacodynamics (PD) of alemtuzumab in MS
Clinical studies show lymphopenia and subsequent lymphocyte repopulation to be the primary PD effect of alemtuzumab in MS. Therefore, PD activity in the clinical studies was assessed by measurement of the absolute lymphocyte count, the major T and B lymphocyte subsets and NK cells (CD3+, CD4+, CD8+, CD19+, CD16+, CD56+). Patients who received any amount of alemtuzumab were included in the PD analyses, and their baseline characteristics are shown in Table 4.
Demographic and baseline characteristics for patients included in pharmacodynamic (PD) data analyses
| Study | CAMMS223 | CARE-MS I | CARE-MS II | ||
|---|---|---|---|---|---|
| Dose cohort | 12 mg | 24 mg | 12 mg | 12 mg | 24 mg |
| Patients (n) | 108 | 108 | 376 | 435 | 161 |
| Age (years) | |||||
| Mean (s.d.) | 32·3 (8·02) | 32·3 (8·81) | 33·0 (8·03) | 34·7 (8·34) | 35·4 (8·43) |
| Median | 31·5 | 31·0 | 32·0 | 34·0 | 35·0 |
| Min, max | 19·0, 49·0 | 18·0, 54·0 | 18·0, 51·0 | 18·0, 55·0 | 20·0, 54·0 |
| Gender, n (%) | |||||
| Male | 38 (35·2) | 39 (36·1) | 133 (35·4) | 148 (34·0) | 47 (29·2) |
| Female | 70 (64·8) | 69 (63·9) | 243 (64·6) | 287 (66·0) | 114 (70·8) |
| Race, n (%) | |||||
| White | 97 (89·8) | 96 (88·9) | 352 (93·6) | 392 (90·1) | 135 (83·9) |
| Black | 6 (5·6) | 4 (3·7) | 11 (2·9) | 24 (5·5) | 11 (6·8) |
| Asian | 1 (0·9) | – | 5 (1·3) | 1 (0·2) | 1 (0·6) |
| Hispanic | 4 (3·7) | 8 (7·4) | – | – | – |
| American Indian or Alaska Native | – | – | 2 (0·5) | 2 (0·5) | 3 (1·9) |
| Other | – | – | 6 (1·6) | 16 (3·7) | 11 (6·8) |
| Weight (kg) | |||||
| Mean (s.d.) | 76·6 (19·30) | 75·6 (19·78) | 73·1 (16·95) | 76·2 18·21) | 76·6 (20·32) |
| Median | 71·0 | 71·8 | 69·5 | 73·1 | 72·1 |
| Min, max | 48·5, 137·9 | 42·0, 147·2 | 40·0, 141·3 | 42·3, 157·4 | 48·2, 188·2 |
Alemtuzumab rapidly depleted circulating T and B cells after each treatment course, with the lowest values typically occurring at the first post-treatment assessment, which was after 1 month in the Phase III studies and as early as 2 days after the end of the first treatment course in the Phase II study.
In CAMMS223, following administration of course 1 with 12- or 24-mg alemtuzumab, mean lymphocyte counts were reduced from baseline by approximately 85% at week 1, started to increase by week 2 and reached the lower limit of normal (LLN) by 9 months.
Similarly, in CARE-MS I and CARE-MS II, alemtuzumab 12 or 24 mg depleted circulating lymphocytes after each course, with the lowest values observed at the first post-baseline assessment, which was 1 month after the start of therapy. Lymphocytes repopulated after depletion, with the time to reach repopulation milestones varying by subset. Approximately 60% of patients had total lymphocyte counts below the LLN 6 months after each treatment course, and 20% had counts below the LLN after 12 months. B cell counts usually recovered within 6 months; T cell counts increased more slowly and usually remained below baseline levels 12 months after treatment. The mean/median cell counts were above the LLN within 12 months following any treatment course for B lymphocytes and CD8+ T lymphocytes, but not for CD3+ and CD4+ T lymphocytes; the LLNs are higher for CD3+ and CD4+ cells than for the other cell types. CD16+CD56+ NK cells were reduced to a lesser extent than T and B lymphocytes, with mean counts remaining within the normal range throughout the 2-year period.
The PD findings by cell type in the 12-mg dose groups in the Phase III studies are summarized in Table 5.
Mean total lymphocyte counts were reduced by 88% from baseline at month 1, were at the LLN by month 6 and were 133% of the LLN and 51% of baseline 12 months after course 1. Following the second course of alemtuzumab, mean total lymphocyte count decreased from the month 12 precourse value by 72% at 1 month post-treatment (month 13), which corresponded to 38% of the LLN. Mean total lymphocyte counts were at the LLN by 6 months after course 2 treatment (month 18). The month 24 mean value was 139% of the LLN and 54% of baseline. More than 85% of patients had total lymphocyte counts reaching the LLN by 12 months after each treatment course.
Mean CD3+ counts were reduced by 93% from baseline at month 1, and were 64% of the LLN by 12 months after course 1. Following the second course of alemtuzumab, mean CD3+ counts were reduced by 80% at month 13 with respect to the precourse value at month 12, and were approximately 68% of the LLN by 12 months. Approximately 20–26% of patients had CD3+ counts reaching the LLN by 12 months after each treatment course.
Mean CD4+ counts were reduced by 96% from baseline at month 1, and were 55% of the LLN by 12 months after course 1. Mean CD4+ counts were reduced by 81% at month 13 from the precourse value at month 12, and were approximately 63% of the LLN by 12 months after course 2 (month 24). Approximately 80–88% of patients had CD4+ counts ≥ 2 × 10⁸/l, and 9–17% had reached the LLN by 12 months after each treatment course.
Mean CD8+ counts were reduced by 85% from baseline at month 1, and returned to the LLN by 9 months after course 1. Following course 2, mean CD8+ counts were reduced by 75% at month 13 from the precourse value at month 12, and returned to the LLN by 9 months after course 2 (month 21). The month 24 mean CD8+ count was approximately the same as that at month 12 and half the baseline value. Approximately 60% of patients had CD8+ counts reaching the LLN by 12 months after each treatment course.
Mean CD19+ counts decreased by 93% at month 1 from the baseline and returned to the LLN by 3 months after course 1. Following course 2, mean CD19+ counts were reduced by 91% at month 13 compared to the precourse value at month 12, and returned to the LLN by 3 months after course 2 (month 15). The month 24 mean CD19+ count was the same as that at month 12 and higher than the baseline. Approximately 99% of patients had CD19+ counts that reached the LLN, and the median CD19+ lymphocyte count had recovered to the baseline value or slightly above.
Mean CD16+CD56+ counts were reduced by 43% at month 1 from the baseline and did not deplete below the LLN. Mean CD16+CD56+ counts remained above the LLN to 12 months after course 1. At month 13, 1 month after the second treatment course, mean CD16+CD56+ counts dropped by 22% from the precourse value at month 12 and did not deplete below the LLN. Mean CD16+CD56+ counts remained above the LLN to 12 months after course 2, and were the same at baseline, month 12 and month 24.
Lymphocyte and subset cell counts over time after two courses of treatment with 12 mg/day alemtuzumab 12 months apart between courses (pooled Phase III data)
| Cell counts (mean, ×109/l) | LLN | Baseline | Month 1 | Month 12 (pre-course 2) | Month 13 | Month 24 |
|---|---|---|---|---|---|---|
| Total lymphocytes | 0·85 | 2·20 | 0·25 | 1·13 | 0·32 | 1·18 |
| CD3+ | 0·84 | 1·48 | 0·11 | 0·54 | 0·11 | 0·57 |
| CD4+ | 0·49 | 0·96 | 0·04 | 0·27 | 0·05 | 0·31 |
| CD8+ | 0·18 | 0·48 | 0·07 | 0·24 | 0·06 | 0·23 |
| CD19+ | 0·11 | 0·28 | 0·02 | 0·34 | 0·03 | 0·35 |
| CD16+CD56+ | 0·07 | 0·23 | 0·13 | 0·23 | 0·18 | 0·23 |
The PD findings in the two Phase III studies suggest that lymphocyte repopulation occurred at about the same rate after each treatment course, and the nadir and degree of repopulation following the second course was comparable to the first, with no indication that the effects of alemtuzumab on lymphocytes are cumulative.
Similar patterns of lymphocyte depletion and repopulation were generally observed for total lymphocyte and subset counts in the 24-mg dose group compared with the 12-mg dose. Overall, no apparent differences were noted between the 24- and 12-mg doses in the PD response as measured in peripheral blood (Fig. 2).
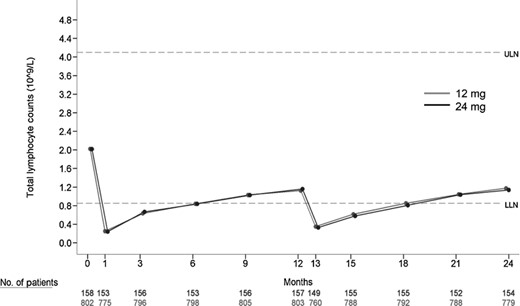
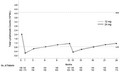
Mean total lymphocyte counts over time (pooled data from CARE-MS I and CARE-MS II). Alemtuzumab 12 mg (grey line with solid circles) or 24 mg (black line with solid circles) depleted circulating lymphocytes after each course, and repopulated after depletion. Dashed lines shown are upper limit of normal (ULN) and lower limit of normal (LLN) as marked. Mean total lymphocyte counts were reduced by 88% from baseline at month 1, were at the LLN by month 6 and were 133% of the LLN and 51% of baseline 12 months after course 1. Following the second course of alemtuzumab, mean total lymphocyte count decreased from the month 12 precourse value by 72% at month 13, which corresponded to 38% of the LLN. Mean total lymphocyte counts were at the LLN at month 18. The month 24 mean value was 139% of the LLN and 54% of baseline.
Lymphocyte and subset counts over time were also examined for any potential differences by gender in the combined Phase III studies. No statistically significant differences were noted between male and female patients in the extent of lymphocyte or subset depletion.
Immunogenicity
Immunogenicity profiles of alemtuzumab in MS patients were assessed in all clinical studies. As the assessment of antibody formation is highly dependent upon the sensitivity and specificity of the assay, the results of the Phase II study (CAMMS223) are presented separately from the Phase III (CARE-MS I and CARE-MS II) results, and the focus of the following discussion is on the Phase III data.
Anti-alemtuzumab antibodies
In the Phase II CAMMS223 study, serum ADA (binding) levels were all BLQ immediately prior to the first course of treatment, peaked by 1 month post-dose, and gradually lessened thereafter until the second course was administered. The longitudinal pattern of ADA levels was similar in the two dose groups and with each treatment course. Peak antibody responses were higher post course 2 than post-course 1.
The three-tiered testing approach, as described in the Methods, was used for assessment of ADA in the Phase III studies. Overall, a majority (85.2%) of patients treated with 12 mg alemtuzumab in the pooled Phase III studies developed ADA during the 2-year course. The incidence of ADA (i.e. percentage of patients confirmed as being ADA-positive) was higher in course 2 (84·9%) compared with course 1 (71·5%).
In the 12-mg group, after the first course of treatment with alemtuzumab, ADA incidence increased slightly from month 1 to month 3, and then decreased by month 12, prior to the start of the second treatment course (Table 6). Antibody incidence rose after course 2, with ADA incidence and titres higher than course 1. The median titres peaked at 1 month post-dose at month 13, and decreased at month 15 and to month 24. Peak ADA titres were higher following course 2 than course 1. Pre-existing immunoreactivity with low titres was observed in seven patients (0·9%) prior to initiation of treatment with alemtuzumab, due possibly to baseline cross-reactivity (Fig. 3).
Summary of incidence and titres of anti-alemtuzumab antibody and inhibitory antibody (pooled Phase III studies)
| ADA incidence and titres | Baseline | Month 1 | Month 3 | Month 12 | Month 13 | Month 15 | Month 24 | ||
|---|---|---|---|---|---|---|---|---|---|
| ADA | 12 mg | % patients positive | 0·9% | 62·4% | 66·7% | 29·3% | 83·2% | 83·4% | 75·4% |
| Titre, median | 30 | 400 | 400 | 200 | 204800 | 51200 | 1600 | ||
| Titre, range | 30, 800 | 30, 10 2400 | 30, 102 400 | 30, 102 400 | 306 55 3 600 | 30, 6 553 600 | 30, 204 800 | ||
| 24 mg | % patients positive | 0 | 48·7% | 55·4% | 28·7% | 73·6% | 72·4% | 67·1% | |
| Titre, median | na | 400 | 400 | 200 | 204800 | 51200 | 2400 | ||
| Titre, range | na | 30, 51200 | 30, 12800 | 30, 12800 | 30, 13107200 | 30, 1638400 | 30, 102400 | ||
| Inhibitory ADA | 12 mg | % patients positive1 | 0 | 86·8% | 45·60% | 2·2% | 94·3% | 88·1% | 41·5% |
| Titre, median | na | 40 | 20 | 20 | 640 | 160 | 20 | ||
| Titre, range | na | 20, 640 | 20, 640 | 20, 640 | 20, 81920 | 20, 2560 | 20, 640 | ||
| 24 mg | % patients positivea | 0 | 89·3% | 57·5% | 8·9% | 95·1% | 90·9% | 41·2% | |
| Titre, median | na | 80 | 20 | 40 | 1280 | 320 | 40 | ||
| Titre, range | na | 20, 1280 | 20, 320 | 20, 40 | 20, 10240 | 20, 2560 | 20, 320 | ||
Percentage of the total patients who tested positive in anti-alemtuzumab antibodies (ADA).

Median anti-alemtuzumab antibody (ADA) and inhibitory ADA titres over time (pooled data from CARE-MS I and CARE-MS II). For ADA (upper panel), in the 12-mg group (dashed line with open circles) and the 24-mg group (solid line with filled circle), the median titres were similar and peaked at 1 month post-dose after each treatment course (months 1 and 13). Peak ADA titres were higher following course 2 than course 1. For inhibitory ADA (lower panel), for both dose groups and in both treatment courses, titres peaked at 1 month after dose (months 1 and 13 for courses 1 and 2, respectively). Peak inhibitory ADA titres were higher in course 2, as was observed for ADA. The observed difference in median inhibitory ADA titre between dose groups was only one dilution, which is considered within the assay variability.
In the 24-mg group, the overall incidence and trend for titres of ADA were slightly lower compared with the 12-mg group (Table 6, Fig. 3). No pre-existing ADA was observed.
No statistically significant differences were seen between male and female MS patients regarding ADA incidence in the Phase III studies.
Inhibitory anti-alemtuzumab antibodies
In the Phase II study, CAMMS223, representative samples which were found to be binding ADA-positive were analysed in a cell-based assay to quantitatively assess blocking antibody activity (i.e. inhibitory ADA). Similar to binding antibodies, anti-alemtuzumab blocking antibody serum titre was at nadir immediately prior to course 1, peaked by 1 month post-course 1 treatment and gradually lessened thereafter until course 2. The longitudinal pattern of blocking ADA titre levels was similar in the two dose groups and with each treatment course. At month 13, nearly all patients who had blocking (inhibitory) ADA results available and had tested positive for anti-alemtuzumab binding antibodies at these or earlier time-points were also positive for inhibitory antibodies.
In the Phase III studies, CARE-MS I and CARE-MS II, of the 85·2% of patients in the 12-mg cohorts who tested positive for ADA at any time-point during the 2-year treatment course, 92·2% developed inhibitory ADA. In both treatment courses, inhibitory ADA incidence and titres peaked at 1 month after dose (month 1 and month 13 for course 1 and course 2, respectively) (Fig. 3). Peak inhibitory ADA titres were higher in course 2, as was observed for ADA. Inhibitory ADA levels diminished thereafter (Table 6).
In the 24-mg group, the overall incidence of inhibitory ADAs was similar to that of the 12-mg group. The median inhibitory ADA titre between both groups was also similar, with the observed difference of only one dilution, which is considered within the assay variability and not different (Fig. 3).
There were no statistically significant differences in terms of inhibitory ADA incidence between male and female MS patients in the Phase III studies.
Effects of ADA on PK
Initial graphical analysis of the alemtuzumab serum concentration profiles suggested that serum concentrations quantifiable throughout a period of 1–3 months post each treatment course were mostly from patients who were ADA-negative at the time the concentration was evaluated. To assess the potential effect of the presence of ADA on the elimination of alemtuzumab, the serum concentrations at 1 month and 3 months post each course were stratified by the status of ADA at each of these visits.
As shown in Table 7, by 1 month post-treatment, approximately 65–80% of serum concentrations of alemtuzumab were BLQ, and by 3 months post-treatment 95% were BLQ, regardless of ADA status. Most patients were positive for ADA, particularly after the second course (i.e. 128 of 170 at month 13 and 145 of 187 at month 15), yet the vast majority of non-BLQ values (94 of 113) were from the antibody-negative subgroup. This disproportionate distribution could arise from interference of ADA with the PK assay at low serum concentrations.
Proportion of patients with alemtuzumab concentrations below the limit of quantitation (BLQ) 1 and 3 months post treatment by anti-alemtuzumab antibody (ADA) status
| Time-point | Number and % of patients | CARE-MS I | CARE-MS II | Pooled | |||
|---|---|---|---|---|---|---|---|
| n | % | n | % | n | % | ||
| Month 1 | 47 | – | 133 | – | 180 | – | |
| BLQ | 35 | 74·5 | 82 | 61·7 | 117 | 65·0 | |
| BLQ Ab pos | 30 | 85·7 | 70 | 85·4 | 100 | 85·5 | |
| BLQ Ab neg | 5 | 14·3 | 12 | 14·6 | 17 | 14·5 | |
| Non-BLQ | 12 | 25·5 | 51 | 38·3 | 63 | 35·0 | |
| Non-BLQ Ab pos | 4 | 33·3 | 5 | 9·8 | 9 | 14·3 | |
| Non-BLQ Ab neg | 8 | 66·7 | 46 | 90·2 | 54 | 85·7 | |
| Month 3 | 51 | – | 136 | – | 187 | – | |
| BLQ | 49 | 96·1 | 129 | 94·9 | 178 | 95·2 | |
| BLQ Ab pos | 38 | 77·6 | 78 | 60·5 | 116 | 65·2 | |
| BLQ Ab neg | 11 | 22·4 | 51 | 39·5 | 62 | 34·8 | |
| Non-BLQ | 2 | 3·9 | 7 | 5·1 | 9 | 4·8 | |
| Non-BLQ Ab pos | 2 | 100·0 | 0 | 0·0 | 2 | 22·2 | |
| Non-BLQ Ab neg | 0 | 0·0 | 7 | 100·0 | 7 | 77·8 | |
| Month 13 | 43 | – | 127 | – | 170 | – | |
| BLQ | 38 | 88·4 | 100 | 78·7 | 138 | 81·2 | |
| BLQ Ab pos | 37 | 97·4 | 88 | 88·0 | 125 | 90·6 | |
| BLQ Ab neg | 1 | 2·6 | 12 | 12·0 | 13 | 9·4 | |
| Non-BLQ | 5 | 11·6 | 27 | 21·3 | 32 | 18·8 | |
| Non-BLQ Ab pos | 1 | 20·0 | 2 | 7·4 | 3 | 9·4 | |
| Non-BLQ Ab neg | 4 | 80·0 | 25 | 92·6 | 29 | 90·6 | |
| Month 15 | 49 | – | 138 | – | 187 | – | |
| BLQ | 48 | 98·0 | 130 | 94·2 | 178 | 95·2 | |
| BLQ Ab pos | 40 | 83·3 | 100 | 76·9 | 140 | 78·7 | |
| BLQ Ab neg | 8 | 16·7 | 30 | 23·1 | 38 | 21·3 | |
| Non-BLQ | 1 | 2·0 | 8 | 5·8 | 9 | 4·8 | |
| Non-BLQ Ab pos | 1 | 100 | 4 | 50·0 | 5 | 55·6 | |
| Non-BLQ Ab neg | 0 | 0 | 4 | 50·0 | 4 | 44·4 | |
BLQ = below the limit of quantitation; Ab = antibody; pos = positive; neg = negative.
The effect of ADA on PK was examined further in the PK population (see Model-based evaluation of pharmacokinetics and pharmacodynamics).
Effects of ADA on PD
The potential effect of anti-alemtuzumab antibody and inhibitory antibody on PD, efficacy and safety were assessed throughout the patient groups. Patient groups were stratified by anti-alemtuzumab antibody (ADA) and inhibitory ADA status and titre quartiles. These stratifications included precourse ADA or inhibitory ADA status (positive versus negative), precourse ADA or inhibitory ADA titre quartiles, within-course ADA or inhibitory ADA status (ever positive versus always negative), within-course peak ADA or inhibitory ADA titre quartiles.
Lymphocyte depletion and repopulation occurred with a generally similar pattern and time–course across groups. The effects of precourse ADA status on total lymphocyte and subset counts are shown in Fig. 4 as representative data. Through two courses of treatment with alemtuzumab 12 mg/day, the presence and titre level of ADA or inhibitory ADA generally had no discernible effects on T or B lymphocyte depletion or repopulation for CD3+, CD4+, CD8+ and CD19+ lymphocyte subsets. The absolute counts of CD3+, CD4+, CD8+ and CD19+ cells were similar post-treatment for patients with ADA or inhibitory ADA compared with those who were always negative for antibodies. CD3+, CD4+, CD8+ and CD19+ cells were depleted by month 1 for patients irrespective of their ADA or inhibitory ADA status or titre quartiles. The number of precourse antibody-positive patients was adequate for correlative analyses only for ADA at course 2, and these analyses similarly showed no discernible effects on T or B lymphocyte depletion or repopulation for these lymphocyte subsets.
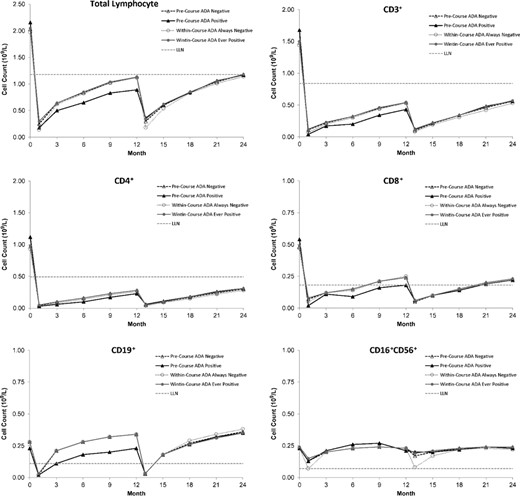
Mean lymphocyte and subset counts over time after each course of alemtuzumab (12 mg/day) by precourse or within-course anti-alemtuzumab antibody status in CARE-MS I and CARE-MS II. Throughout two courses of treatment, the presence and titre level of ADA or inhibitory ADA generally had no discernible effects on T or B lymphocyte depletion or repopulation for CD3+, CD4+, CD8+ and CD19+ lymphocyte subsets. The absolute counts of CD3+, CD4+, CD8+ and CD19+ cells were similar for patients with ADA or inhibitory ADA compared with those who were always negative for antibodies. CD3+, CD4+, CD8+ and CD19+ cells were depleted by month 1 for patients, irrespective of their ADA or inhibitory ADA status. ADA or inhibitory ADA-positive status appeared to be associated with reduced depletion of CD16+CD56+ cells by alemtuzumab. The presence of precourse or within-course ADA was associated with reduced depletion of CD16+CD56+ cells by alemtuzumab.
While they had no apparent effect on T and B lymphocytes, ADA or inhibitory ADA-positive status and titre appeared to be associated with reduced depletion of CD16+CD56+ cells by alemtuzumab. The presence of precourse ADA was associated with reduced depletion of CD16+CD56+ cells by alemtuzumab in course 2; among antibody-positive patients, no effect of antibody titre level was apparent. The reduction in CD16+CD56+ cell depletion was also noted for course 1 and course 2 when lymphocyte counts were analysed by within-course ADA and inhibitory ADA status.
The overall pattern of lymphocyte depletion and repopulation for all lymphocyte subsets was generally similar for the alemtuzumab 24-mg group compared with the 12-mg group, regardless of ADA or inhibitory ADA status or titre quartile.
Model-based evaluation of pharmacokinetics and pharmacodynamics
Population PK analysis
A total of two hundred and sixteen alemtuzumab-treated patients (157, 12 mg; 59, 24 mg) with PK data from CAMMS223, CARE-MS I and CARE-MS II were included in a population PK and PK/PD analysis. Demographic and baseline characteristics of this patient group, including some baseline laboratory parameters and lymphocyte counts, were evaluated as categorical or continuous covariates in the model. The PK of alemtuzumab was best described by a linear, two-compartment structural model. The base structural model included body weight as a covariate on central volume of distribution (V1) with the exponent of the covariate effect fixed to 1 (allometric), and total lymphocyte count on clearance (CL). After covariate analysis and model building and validation, the final model was set to include lymphocyte count and ADA positive status on CL and a study effect on an allometric equation of V1.
The intersubject variability in alemtuzumab PK was large for clearance (approximately 58%) and moderate for V1 (approximately 26%), which probably reflects the large variability in lymphocyte counts and available CD52 antigen. V1 was proportional to body weight and approximated extracellular fluid volume (14·1 l), suggesting that alemtuzumab is largely confined to the blood and interstitial space, as one could expect for a large molecule such as a monoclonal antibody. Although there was a study effect on V1 (higher V1 in CARE-MS II than in CAMMS223 and CARE-MS I), the difference was quite small, and was not considered clinically relevant.
The derived PK parameters using the final model are presented by dose, treatment course and ADA status (Table 8). Area under the curve (AUC), Cmax and half-life (T1/2) were calculated by simulating the individual concentration versus time profiles using the actual doses and length of infusion values for each subject. The values of Cmax reported were determined following administration of the last dose of each course.
Summary of population pharmacokinetic parameters by dose group, course and pre-course anti-alemtuzumab antibody (ADA) status (pooled Phase III studies)
| Parameter, mean (s.d.) | 12 mg | 24 mg | ||||
|---|---|---|---|---|---|---|
| Course 1a | Course 2 | Course 1 | Course 2 | |||
| ADA negative (n = 145) | ADA negative (n = 98) | ADA positive (n = 42) | ADA negative (n = 49) | ADA negative(n = 38) | ADA positive(n = 9) | |
| Cmax (mg/ml) | 2·97 (0·63) | 2·25 (0·62) | 2·21 (0·56) | 5·08 (1·3) | 4·08 (0·92) | 3·69 (0·76) |
| AUC (mg×h/l) | 949 (262) | 642 (207) | 1065 (176) | 1416 (5720) | 986 (294) | 1631 (185) |
| T1/2α(days) | 1·80 (0·45) | 1·83 (0·47) | 2·18 (0·33) | 1·72 (0·41) | 1·78 (0·39) | 2·37 (0·34) |
| T1/2β(days) | 13·8 (4·4) | 15·1 (7·5) | 32·1 (6·5) | 13·0 (3·7) | 15·3 (6·5) | 24·0 (8·0) |
| CL (l/h) | 0·062 (0·030) | 0·051 (0·027) | 0·012 (0·004) | 0·096 (0·043) | 0·071 (0·025) | 0·025 (0·007) |
| V1 (l) | 13·45 (4·43) | 13·21 (4·80) | 14·16 (3·59) | 14·44 (4·57) | 13·88 (4·46) | 17·47 (4·22) |
| Lymphocyte count (×109/l) | 2·01 (0·69) | 1·09 (0·42) | 1·16 (0·36) | 1·94 (0·68) | 1·05 (0·34) | 1·34 (0·68) |
Cmax = maximum serum concentrations; AUC = area under the curve; T1/2α = half-life of the distribution phase; T1/2β = half-life of the elimination phase; CL = apparent clearance; V1 = central volume; PK = pharmacokinetic.
Low-titre ADA was detected in one patient included in the PK data set immediately prior to treatment with alemtuzumab. As this observation is due possibly to baseline cross-reactivity, PK parameters for this antibody patient are not reported.
As shown, values of Cmax and V1 were comparable between courses. The effect of lymphocyte count on CL can be assessed by comparing values reported for patients who are anti-alemtuzumab-negative between the two courses. For a decrease in mean lymphocyte count from 2·01 to 1·09 from course 1 to course 2, the mean CL decreased from 0·062 l/h to 0·051 l/h, a decrease of < 20%.
The estimated T1/2ᵅ of alemtuzumab approximates 2 days and appears to be independent of course, ADA status and dose level. The estimated T1/2β of alemtuzumab values in the range of 13·0–15·3 days for ADA-negative patients and 24·0–32·1 days for ADA-positive patients, supporting that ADA prolong the elimination of alemtuzumab.
No effects of age, race, or gender on the PK of alemtuzumab were observed.
Population PK/PD analysis and exposure–response relationship
A model-based evaluation was carried out with CD3+, CD19+ and total lymphocytes. Alemtuzumab was found to reduce the total lymphocyte and subset counts. For CD3+, CD19+ and total lymphocytes, the basic PD model was an indirect response model and was built based on the assumption that alemtuzumab causes cell lysis and acts to increase the rate of lymphocyte degradation through a direct effect of its concentration in plasma (Fig. 5). Under this model, lymphocytes are produced at a constant zero-order rate per day (Kin) and eliminated by a first-order degradation rate (Kout), and the baseline lymphocyte count prior to treatment is equal to the ratio of Kin to Kout. All the models were similar, in that the drug effect was linear and was only included on Kout, the rate of removal of the lymphocyte subtype.
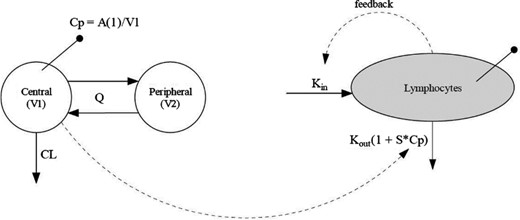
Pharmacokinetic–pharmacodynamic model used to model lymphocyte counts. The basic PD model was an indirect response model and was built based on the assumption that alemtuzumab causes cell lysis and acts to increase the rate of lymphocyte degradation through a direct effect of its concentration in plasma. Under this model, lymphocytes are produced at a constant zero-order rate per day (Kin) and eliminated by a first-order degradation rate (Kout), and the baseline lymphocyte count prior to treatment is equal to the ratio of Kin to Kout. The drug effect was linear and was only included on Kout, the rate of removal of the lymphocyte subtype. Sampling compartments are denoted by lines with solid circles at the end. V1 = volume of distribution of the central compartment; V2 = volume of distribution of the peripheral compartment; Q = intercompartmental clearance; CL = total systemic clearance; A(1) = the amount of alemtuzumab in the central compartment; Kin = zero-order rate of production of lymphocytes; Kout = first-order rate of lymphocyte degradation; Cp = alemtuzumab serum concentration; S = slope of the linear relationship between alemtuzumab serum concentration and its effect on lymphocyte degradation.
A covariate in the total lymphocyte PD model was ADA, where positive ADA status resulted in a slope of the cell loss–alemtuzumab concentration relationship that was less than negative ADA status. This is indicative of a greater susceptibility of some or all lymphocytes to the effects of alemtuzumab when ADA is not present, or of lower availability of active alemtuzumab in the presence of ADA. Fig. 6 is a plot of the observed total lymphocyte count by observed ADA status for the first 100 days after dosing. The median individual minimum total lymphocyte count for ADA-positive records is 0·21 × 109/l, whereas the minimum total lymphocyte count is 0·08 × 109/l for ADA-negative records. Considering that lymphocyte counts started at approximately 1·0 × 109 to 4·0 × 109/l at time 0, the reduction in lymphocyte count following alemtuzumab administration is substantial regardless of ADA status. During lymphocyte repopulation, the profiles of the counts are approximately the same, and there was no apparent difference by ADA status (data not shown).
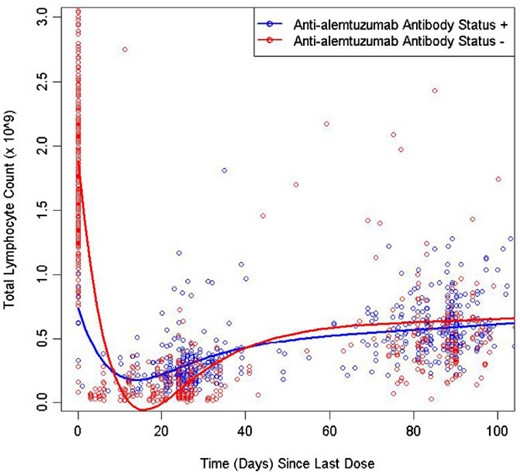
Observed total lymphocyte count versus time by observed anti-alemtuzumab antibody status (pooled CARE-MS I and CARE-MS II data) for the first 100 days after dosing. A covariate in the total lymphocyte PD model was ADA where positive ADA status resulted in a slope of the cell loss–alemtuzumab concentration relationship that was less than negative ADA status, indicating a greater susceptibility of some or all lymphocytes to the effects of alemtuzumab when ADA is not present, or of lower availability of active alemtuzumab in the presence of ADA. During lymphocyte repopulation the profiles of the counts are approximately the same, and there was no apparent difference by ADA status.
An exploratory graphical exposure–response analysis was carried out on total lymphocytes and all lymphocyte subsets. For this analysis, the Cmaxand AUC of alemtuzumab were calculated by simulating the concentrations of alemtuzumab using the individual PK parameters from the final PK model (See Population PK analysis). The response for each endpoint (total lymphocyte or subset) was the observed nadir for each subject from each course, the area under the effect curve (AUEC) based on the observed counts and the percentage of baseline values (i.e. the pretreatment value before course 1).
The effects of alemtuzumab exposure on total lymphocyte count and subsets were generally similar. At each treatment course, there was a decrease in total lymphocyte count upon exposure to alemtuzumab, with no apparent further decrease with increasing AUC or Cmax (representative data shown in Fig. 7). Lymphocyte depletion was consistently observed upon exposure or second re-exposure to alemtuzumab, without correlation to Cmax or AUC. There appears to be no difference in lymphocyte depletion or repopulation throughout the exposure range evaluated following administration of 12 or 24 mg alemtuzumab. No effects of age, race or gender on the PD activity of alemtuzumab were observed.
![Total lymphocyte count percentage of baseline area under the effect curve (AUEC) versus alemtuzumab exposure (pooled CARE-MS I and CARE-MS II data) [left panel: area under the curve (AUC); right panel: maximum serum concentration (Cmax)]. At each treatment course, there was a decrease in total lymphocyte count upon exposure to alemtuzumab, with no apparent further decrease with increasing AUC or Cmax. Lymphocyte depletion was consistently observed upon exposure or second re-exposure to alemtuzumab, without correlation to Cmax or AUC. There appears to be no difference in lymphocyte depletion or repopulation across the exposure range evaluated following administration of 12 or 24 mg alemtuzumab.](https://oup.silverchair-cdn.com/oup/backfile/Content_public/Journal/cei/194/3/10.1111_cei.13208/3/m_cei13208-fig-0007.jpeg?Expires=1750186951&Signature=Bn6feBTkKeSej0p92odMK-fdNna2Lk3DF1bv6aQhauBsz07rl8oseZNY~24yuiWLoy4VV2nHGM7yK0qTaDzjHj9x1KwP-7KRH1QQZ11BkeKRy7uCZJz7~7nQDr2F1LsQAjqOuPnK0byOImjxfycuEa4xKyIyAsFs-oA~vaMmgmbqnsJs-aKwbboUoL7l4coLImZNU~iuIhueCgyW-5qB1C72DVuU9lYrnwwlidFYU4D0ikWCJiNF3qn5-CjxiPwsgy-DbnecJR30q-2XZpcg~Fye2UriprDKC89REsbEzP-a3ol0Utp4YS1vFhTRxiFD1O1gAYpGpTED4shE1bOGHA__&Key-Pair-Id=APKAIE5G5CRDK6RD3PGA)
Total lymphocyte count percentage of baseline area under the effect curve (AUEC) versus alemtuzumab exposure (pooled CARE-MS I and CARE-MS II data) [left panel: area under the curve (AUC); right panel: maximum serum concentration (Cmax)]. At each treatment course, there was a decrease in total lymphocyte count upon exposure to alemtuzumab, with no apparent further decrease with increasing AUC or Cmax. Lymphocyte depletion was consistently observed upon exposure or second re-exposure to alemtuzumab, without correlation to Cmax or AUC. There appears to be no difference in lymphocyte depletion or repopulation across the exposure range evaluated following administration of 12 or 24 mg alemtuzumab.
Discussion
The clinical development programme of alemtuzumab as a treatment for relapsing MS consists of three studies, as presented herein. The PK and PD characteristics and the immunogenicity profile of alemtuzumab in patients after two courses of treatment (i.e. daily for 5 days in course 1 and daily for 3 days for course 2, approximately 12 months apart) were evaluated in all three trials.
The distinctive pattern of T and B cell repopulation following alemtuzumab treatment is probably related to its mechanism of action in MS patients. The reduction in the level of circulating B and T cells by alemtuzumab and subsequent repopulation may reduce the potential for relapse, which ultimately delays disease progression. The primary intent of lymphocyte-directed therapy in MS patients is to reduce lymphocyte-mediated inflammation in the CNS and thereby mitigate disease. Alemtuzumab appears to accomplish this aim, and its observed PD effects suggest two possible ways by which it may act. First, there is a reduction in T and B lymphocyte counts immediately following treatment. The absolute abundance of nearly all lymphocyte subsets is reduced following alemtuzumab administration, which could contribute to the observed reduction in MS disease activity. Secondly, the distinctive pattern of repopulation that begins within weeks and continues over time could indicate a possible rebalancing of the immune system in ways that persist beyond the actual course of treatment [29,30,41,42]. There has been evidence that, in addition to its previously known effects of depleting and repopulating T and B lymphocytes, alemtuzumab treatment could also result in a relative increase of cells with memory and regulatory phenotypes and a decrease in cells with a proinflammatory signature, and may further promote an immunoregulatory environment through an impact on other innate immune cells (e.g. dendritic cells) that play a role in MS [43–48]. These lines of evidence help to explain the recent long-term efficacy data from the Phase II/III extension study with up to 6 years of treatment (2 years of the core study plus 4 years of the extension). The study results have demonstrated that alemtuzumab reduces relapse rates, disability worsening and the rate of brain volume loss over the long term, with many patients achieving no evidence of disease activity. In high proportions of patients, pre-existing disability remained stable or improved [49]. NK cells were reduced to a lesser extent than T and B lymphocytes, with mean counts remaining within the normal range throughout the 2-year period, which may relate to the much lower expression of CD52 antigen on NK cells compared to T and B lymphocytes.
To examine the effect of lymphocyte depletion on risk for infection, the incidence of infections in all alemtuzumab-treated patients was analysed in relation to cell counts for total lymphocytes and certain lymphocyte subsets (CD4+, CD8+ and CD19+). Generally, reductions in total lymphocyte counts and CD4+, CD8+ and CD19+ subsets following alemtuzumab treatment did not appear to have any relationship with the presence or absence of infections [25,41,42].
In contrast to some other biologicals which have been associated with loss of efficacy due to immunogenicity, the presence of ADA (including inhibitory ADA) did not appear to have an effect on clinical efficacy or safety of alemtuzumab, including the incidence of adverse events (AE) and infusion-associated reactions (IAR), throughout the two treatment courses. This may be explained by the annual dosing regimen, the low titres of circulating ADA or inhibitory ADA at initial treatment and just prior to the second course 12 months later, and the rapidity of lymphocyte depletion upon drug exposure which may occur before significant ADA and inhibitory ADA develops [41,50].
While there appeared to be no discernible effects of ADA or inhibitory ADA on depletion or repopulation of T or B lymphocyte and subsets, immunogenicity appeared to have an effect on the depletion of NK cells. During both treatment courses, patients in the higher peak antibody titre quartiles (ADA and inhibitory ADA) showed the least NK cell depletion. The NK cell counts became similar for patients positive or negative for ADA by month 3 of course 1 and by months 3 or 6 of course 2. The clinical relevance of this apparent association of ADA and inhibitory ADA with reduced depletion of CD16+CD56+ NK cells is uncertain. The mean CD16+CD56+ cell count for alemtuzumab 12-mg-treated patients remained within the normal range at all time-points regardless of ADA or inhibitory ADA status or titre. Moreover, NK cell depletion was transient regardless of antibody status or quartile, with CD16+CD56+ cell counts being similar across strata by 3–6 months after each treatment course. Finally, the reduced alemtuzumab effect on NK cells caused by ADA is not clinically adverse, given that CD16+CD56+ NK cells are a crucial component of the innate immune system and are known to have important immune surveillance effects [51–53].
As shown from population PK modelling, the influence of lymphocyte count on alemtuzumab CL was significant, which is consistent with target-mediated clearance by CD52+ lymphocytes. The model also identified ADA as a significant covariate for alemtuzumab CL where the presence of ADA was associated with a lower clearance. This effect would be predicted from a mechanistic point of view if ADA blocks binding of alemtuzumab to CD52+ lymphocytes. This may appear to contradict the observation where the limited number of serum alemtuzumab concentrations quantifiable throughout the terminal phase of the pooled concentration–time curve were primarily from patients who were ADA negative at the time the concentration was evaluated (Table 7); however, it is possible that the presence of ADA interferes with the PK assay by binding to the detection anti-idiotype antibody in the PK assay at low concentrations of alemtuzumab, resulting in an apparently more rapid disappearance of alemtuzumab from the systemic circulation, while the real effect is that ADA decreases the CL of alemtuzumab by blocking the binding of alemtuzumab to CD52+ lymphocytes. It should also be pointed out that the limited amount of serum concentration data and disproportionate data distribution between ADA-positive and -negative groups in the terminal phase may adversely impact the model's reliability in its predictions from these data regarding the impact of antibody status on drug clearance.
In summary, the results from the 2-year Phase II and Phase III studies have shown that serum concentrations increased with each consecutive dose within a treatment course, with Cmax occurring following the last infusion in a treatment course and concentrations generally becoming BLQ within approximately 30 days following each treatment course. Circulating T and B lymphocytes were rapidly depleted by alemtuzumab and repopulated over time, with B cells recovering faster than T lymphocytes. A majority of patients tested positive for ADA, including inhibitory ADA during the 2-year studies, and a higher proportion of patients tested positive in course 2 compared with course 1. The systemic clearance of alemtuzumab is dependent upon circulating lymphocyte count, and the presence of ADA appeared to be associated with slower clearance of alemtuzumab from circulation but had no significant impact on the PD activity. No effects of age, race or gender on the PK or PD were observed. Together, the PK, PD and immunogenicity results support the continued development and use of alemtuzumab for the treatment of MS.
Acknowledgements
This study was sponsored by Sanofi. We thank all patients and staff at participating sites for their contributions to the studies. We thank the Sanofi Clinical, Biostatistics and Bioanalytical teams for their contributions to the completion of these studies.
ClinicalTrials.gov Identifiers
NCT00530348 (CARE-MS I), NCT00548405 (CARE-MS II), NCT00050778 (CAMMS223).
Disclosures
Z. L. and M. P. were employees of Sanofi at the time the studies were conducted, and may hold stock in Sanofi. S. R., H. S. and A. J. are paid Sanofi employees and may hold stock and/or stock options in the company.
Author contributions
Z. L., S. R., H. K. S., A. J. and M. A. P. contributed to the concept or design of the clinical trials, data analysis or interpretation and critical revision of the paper; Z. L. Z wrote the paper.
