


Summary
The risk of osteoporosis increases in inflammatory disorders. In cell-mediated immune activation, interferon (IFN)-γ stimulates macrophage release of neopterin and increases the activity of indoleamine 2,3-dioxygenase (IDO), thereby stimulating tryptophan degradation along the kynurenine pathway. Plasma levels of neopterin and the kynurenine/tryptophan ratio (KTR) are thus markers of IFN-γ-mediated inflammation. Several kynurenine pathway metabolites (kynurenines) possess immunomodulatory properties. The aim of this study was to investigate associations between markers of IFN-γ-mediated inflammation and kynurenines with bone mineral density (BMD). The community-based Hordaland Health Study (HUSK), with middle-aged (46–49 years) and older (71–74 years) participants, was conducted from 1998 to 2000 (n = 5312). Hip BMD in relation to neopterin, KTR and kynurenines were investigated, using linear and logistic regression analyses. In the oldest group, neopterin (P ≤ 0·019) and KTR (P ≤ 0·001) were associated inversely with BMD after multiple adjustment. Comparing the highest to the lowest quartiles, the odds ratios of low BMD (being in the lowest quintile of BMD) in the oldest cohort were for neopterin 2·01 among men and 2·34 among women (P ≤ 0·007) and for KTR 1·80 for men and 2·04 for women (P ≤ 0·022). Xanthurenic acid was associated positively with BMD in all sex and age groups while 3-hydroxyanthranilic acid was associated positively with BMD among women only (P ≤ 0·010). In conclusion, we found an inverse association between BMD and markers of IFN-γ-mediated inflammation in the oldest participants. BMD was also associated with two kynurenines in both age groups. These results may support a role of cell-mediated inflammation in bone metabolism.
Introduction
Patients with chronic inflammatory diseases are at increased risk of secondary osteoporosis, a result of unbalanced bone turnover with increased maturation and activation of bone-degrading cells (osteoclasts) [1,2]. The main common pathway of osteoclast stimulation is through increased release of receptor activator of nuclear factor kappa B (NF-κB) ligand (RANKL) [2] by cells embedded in bone matrix (osteocytes), bone-building cells (osteoblasts) and stromal cells [3]. Experimental studies have indicated that in states of inflammation, RANKL is also secreted by activated T cells [4,5].
C-reactive protein (CRP) increases as an acute-phase response to inflammation or tissue damage [6]. Low-grade chronic inflammation may be assessed by high-sensitivity (hs) CRP. Results from studies on CRP in relation to bone mineral density (BMD) have been conflicting [7–11].
In certain conditions, including infections, inflammatory diseases and oestrogen deficiency, release of interferon (IFN)‐γ is stimulated as part of a cell‐mediated (type 1) immune response [12]–[14]. IFN‐γ has a mainly bone protective effect [15], e.g. through down‐regulation of osteoclast maturation (bone‐degrading cells). However, in inflammatory conditions with excess IFN‐γ release, murine studies have indicated that a bone resorptive effect dominates [05]. IFN‐γ stimulates macrophage release of neopterin, a pteridine serving as a marker of cellular immune activation [16]. IFN‐γ also increases the expression of the enzyme indoleamine 2,3 dioxygenase (IDO) [17], catalyzing the oxidative cleavage of tryptophan to kynurenine, which is further metabolized to compounds collectively termed kynurenines (Fig. 1) [18]. The kynurenine/tryptophan ratio (KTR) is a sensitive marker of IDO activity and immune activation [18]–[19].
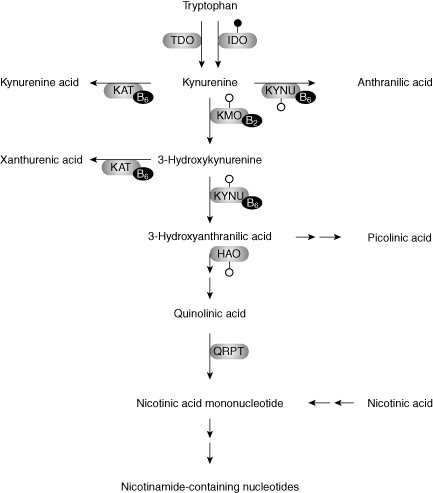
The kynurenine pathway of tryptophan metabolism. Tryptophan is an essential amino acid obtained through the diet. Tryptophan metabolism is initiated by cleavage of the indole-ring catalyzed by either tryptophan dioxygenase (TDO) or indoleamine 2,3-dioxygenase (IDO). TDO resides primarily in the liver and is induced by tryptophan and corticosteroids, whereas IDO is an extrahepatic enzyme induced by cytokines, mainly interferon (IFN)-γ, as indicated by the attached filled circle. Other enzymes of the kynurenine pathway are probably also induced by cytokines, as indicated by the attached open circles. AMO: anthranilate monooxygenase; HAO: hydroxyanthranilate dioxygenase; KAT: kynurenine aminotransferase; KMO: kynurenine monooxygenase; KYNU: kynureninase; QRPT: quinolinate phosphoribosyl transferase.
IDO is an immunomodulatory enzyme [20,21] which may, as for the kynurenines, have an impact upon T cell activity. This influence may be through modification of the properties of antigen-presenting cells [22] and induction of regulatory T cells (Tregs) [23], inhibition of T cell proliferation [24] or through tryptophan depletion, creating a microenvironment suppressing T cell activity [25]. In some diseases, suppression of Tregs has been suggested as a mechanism for bone loss [26–28].
Activation of the kynurenine pathway, as well as an increase in serum neopterin, has been linked to several chronic conditions, including rheumatic diseases [29–32], cardiovascular disease [33], mental and neurological illness [34,35] and osteoporosis [36].
Little is known about the relation between neopterin, the kynurenine pathway and BMD. Thus, the aim of this study was to investigate whether neopterin, KTR and metabolites of the kynurenine pathway are associated with BMD in a large community-based sample of middle-aged and older adults.
Materials and methods
Subjects
The bone mineral substudy of the Hordaland Health Study (HUSK) was conducted during 1998–2000. Some 9187 inhabitants of Bergen and three neighbouring suburban municipalities, born in 1925–27 and 1950–51, who had participated previously in the Hordaland Homocysteine Study [37], were invited. The 7074 (77·0% of invited) subjects taking part in HUSK answered questions concerning lifestyle factors, health status and medication use. BMD was measured in 5408 participants (76·4% of participating subjects); 33 scans were invalid or rejected because of bilateral hip prostheses, leaving 5375 valid bone scans. Of these, blood samples were available for 5314 subjects, leaving 75·1% of participants eligible for the study. The study protocol was approved by the Regional Committee for Medical Research Ethics and the Norwegian Data Inspectorate. All participants signed an informed consent. The study was conducted according to the principles of the Declaration of Helsinki of the World Medical Association.
Blood samples
Non-fasting blood samples were collected and stored as described earlier [38]. Plasma was analysed for tryptophan, kynurenines (kynurenine, kynurenic acid, anthranilic acid, 3-hydroxykynurenine, xanthurenic acid and 3-hydroxyanthranilic acid), neopterin and cotinine (a nicotine metabolite used as a biomarker of recent nicotine exposure) using liquid chromatography-tandem mass spectrometry (LC/MS/MS) in the laboratory of Bevital A/S (http://www.bevital.no), Bergen, Norway [39]. Before analyses, the blood samples had been stored for up to 13 years at −80°C. Plasma concentrations of some kynurenines, which may change in samples that have not been properly stored, were similar in our analyses to those obtained in fresh samples [40], indicating that sample collection and storage were adequate.
Sensitive C-reactive protein ethylenediamine tetraacetic acid (EDTA) plasma levels were analysed at Bevital A/S by an immunoassay based on matrix-assisted laser desorption/ionization time-of-flight mass spectrometry (MALDI-TOF MS).
Bone mineral density
Bone mineral density was measured during 1998–2000 using a stationary, dual X-ray densitometer (EXPERT-XL, software versions 1·72 and 1·90; Lunar Company Inc., Madison, WI, USA).
A scan of the left hip was used, except in those with a left hip prosthesis or former hip fracture. The right hip was scanned in 3·8% of subjects. The scanner was calibrated daily against a standard calibration block. The coefficient of variation for total hip BMD measurements based on duplicate measurement in 27 individuals was 1·2% [41]. Daily phantom measurements were performed and showed no drift. Several areas of the hip were measured; in this study we report the findings for total hip BMD.
Additional data
Participants provided information on health status, use of medication, socio-demographic data and lifestyle factors by self-administered questionnaires. Height and weight were measured in light clothing and body mass index (BMI; in kg/m2) was calculated.
Statistical analyses
Distribution of continuous variables is reported as means and standard deviations (s.d.) or medians and interquartile range for skewed distributions. For categorical variables, counts (percentages) are reported. BMD, BMI and tryptophan were normally distributed, as determined by Q-Q plot. CRP, neopterin, KTR, the kynurenines and cotinine displayed right-skewed distributions. Cotinine was categorized to show the proportions of participants with no, light or heavy nicotine exposure, but was used as a continuous variable in all the analyses. Potential differences between sex and age groups were compared using two-way analysis of variance for continuous outcome variables and binary logistic regression for the categorical outcome.
Correlations between inflammatory markers/tryptophan metabolites and BMD were assessed by Spearman's rho (rs) for the four sex and age groups. The relationships between BMD and neopterin, KTR and the kynurenines were further examined using multiple linear regression. Further, BMD was dichotomized into low (lowest 20% in each sex and age group) or normal BMD. Odds ratios (OR) for risk of low BMD were estimated across sex- and age-specific quartiles of neopterin, KTR, tryptophan and kynurenines by binary logistic regression. The multivariable model includes BMI, cotinine and estimated glomerular filtration rate (eGFR) calculated by the Modification of Diet in Renal Disease (MDRD) formula [42]. eGFR was dichotomized according to normal (60 ml/min or above) or reduced (below 60 ml/min) renal function.
The significance level was set to 0·05. Analyses were conducted using the statistical packages r (version 2·13·1 for Windows) and spss (version 18 for Windows; SPSS Inc., Chicago, IL, USA).
Results
Characteristics of the study participants, according to sex and age group, are shown in Table 1. The plasma neopterin concentration was higher in women than men, whereas KTR was similar between the sexes within each age group. For tryptophan and most of the kynurenines, median values were higher among men than women. The exception was 3-hydroxykynurenine, which was higher among women than men in the middle-aged group. In both age groups, reduced eGFR was substantially more prevalent in women than men.
Characteristics of participants in the Hordaland Health Study (n = 5312) according to age and sex.
| 46–49 years | 71–74 years | P-values | |||||
| Men n = 1229* | Women n = 1862* | Men n = 1017* | Women n = 1204* | Sex | Age | Sex × age interaction | |
| BMD total hip (g/cm2), mean (s.d.)† | 1·03 (0·14) | 0·98 (0·13) | 0·96 (0·15) | 0·80 (0·13) | <0·001 | ||
| BMI (kg/ m2), mean (s.d.)† | 26·2 (3·3) | 24·8 (4·0) | 26·0 (3·1) | 26·2 (4·2) | <0·001 | ||
| eGFR below 60 ml/min, n (%)‡ | 12 (1·0) | 294 (15·8) | 194 (19·1) | 652 (54·2) | <0·001 | ||
| Cotinine, n (%)† | 0·001 | <0·001 | n.s. | ||||
| <85 (no nicotine exposure) | 784 (63·8) | 1180 (63·4) | 834 (82·0) | 1016 (84·4) | |||
| 85–1000 (light nicotine exposure) | 139 (11·3) | 258 (13·9) | 60 (5·9) | 97 (8·1) | |||
| >1000 (heavy nicotine exposure) | 306 (24·9) | 424 (22·8) | 123 (12·1) | 91 (7·6) | |||
| Inflammatory markers, median (IQR) | |||||||
| CRP (μg/ml)† | 1·2 (2·1) | 1·0 (2·1) | 2·1 (3·2) | 2·1 (3·2) | 0·030 | <0·001 | n.s. |
| Neopterin (nmol/l)† | 6·6 (2·2) | 7·0 (2·3) | 8·6 (3·3) | 8·7 (3·2) | 0·004 | ||
| KTR (×1000)† | 20·1 (6·3) | 20·0 (6·8) | 25·8 (9·9) | 26·2 (9·7) | n.s. | <0·001 | n.s. |
| Metabolites, median (IQR) | |||||||
| Tryptophan (μmol/l)† | 72·3 (18·8) | 65·7 (17·2) | 68·5 (17·8) | 62·5 (17·5) | <0·001 | <0·001 | n.s. |
| Kynurenine (μmol/Ll)† | 1·5 (0·4) | 1·3 (0·4) | 1·8 (0·6) | 1·7 (0·6) | <0·001 | <0·001 | n.s. |
| Kynurenic acid (nmol/l)† | 45·1 (18·4) | 39·2 (17·5) | 54·7 (26·9) | 48·4 (25·6) | <0·001 | <0·001 | n.s. |
| Anthranilic acid (nmol/l)† | 13·0 (5·0) | 12·7 (5·3) | 17·0 (7·9) | 15·9 (6·6) | 0·004 | <0·001 | n.s. |
| 3-Hydroxykynurenine (nmol/l)† | 28·5 (11·8) | 30·2 (13·2) | 36·1 (15·1) | 35·3 (15·3) | <0·001 | ||
| Xanthurenic acid (nmol/l)† | 17·2 (10·2) | 15·4 (9·8) | 17·0 (11·1) | 14·2 (9·1) | 0·001 | ||
| 3-Hydroxyanthranilic acid (nmol/l)† | 34·8 (17·3) | 30·9 (15·1) | 36·7 (19·0) | 32·9 (17·1) | <0·001 | <0·001 | n.s. |
*Total numbers may vary between variables according to different numbers of missing data. †Groups compared by two-way analysis of variance. ‡Groups compared by binary logistic regression. BMD = bone mineral density; BMI = body mass index; eGFR = estimated glomerular filtration rate; IQR = interquartile range; KTR = kynurenine/tryptophan ratio; n.s. = not significant; P > 0·01; s.d. = standard deviation.
The association between neopterin and KTR for both age groups combined was stronger (rs = 0·55, P < 0·001) than the associations between neopterin and CRP (rs = 0·23, P < 0·001) and KTR and CRP (rs = 0·27, P < 0·001). Spearman's correlation coefficients of CRP, neopterin, KTR, tryptophan and the kynurenines with BMD and the covariables BMI, cotinine and eGFR are shown in Table 2. BMD was associated inversely with neopterin and KTR (KTR only in men) in the oldest age group. For kynurenic acid, xanthurenic acid and 3-hydroxyanthranilic acid, positive associations with BMD were found in all age and sex groups (P < 0·001). Additionally, KTR, kynurenine, kynurenic acid, 3-hydroxykynurenine and 3-hydroxyanthranilic acid, but not neopterin, were correlated significantly with BMI in all age and sex groups.
Spearman's correlation coefficients for C-reactive protein (CRP), neopterin, kynurenine/tryptophan ratio (KTR) and kynurenines versus bone mineral density (BMD) and covariates [body mass index (BMI), cotinine and eGFR] in the Hordaland Health Study (n = 5312).
| 46–49 years | 71–74 years | |||||||||||||||
| Men (n = 1229) | Women (n = 1862) | Men (n = 1017) | Women (n = 1204) | |||||||||||||
| BMD | BMI | Cot | eGFR | BMD | BMI | Cot | eGFR | BMD | BMI | Cot | eGFR | BMD | BMI | Cot | eGFR | |
| CRP | 0·02 | 0·27a | 0·26a | −0·04 | 0·10a | 0·37a | 0·12a | 0·00 | −0·07c | 0·18a | 0·16a | −0·06 | 0·14a | 0·34a | 0·04 | −0·09c |
| Neopterin | 0·05 | −0·01 | −0·14a | −0·06c | 0·00 | −0·01 | −0·03 | −0·15a | −0·13a | 0·02 | −0·03 | −0·33a | −0·07c | 0·00 | 0·00 | −0·26a |
| KTR | 0·04 | 0·10b | −0·10b | −0·09b | 0·04 | 0·12a | −0·01 | −0·16a | −0·08a | 0·11c | −0·04 | −0·36a | 0·01 | 0·16a | 0·03 | −0·29a |
| Tryptophan | 0·06 | 0·13a | −0·05 | −0·03 | 0·05c | 0·02 | −0·08b | 0·01 | 0·15a | 0·09b | −0·10b | 0·11a | 0·14a | 0·06c | −0·11a | 0·00 |
| Kynurenine | 0·09b | 0·20a | −0·16a | −0·10a | 0·09a | 0·14a | −0·08a | −0·17a | 0·02 | 0·21a | −0·13a | −0·34a | 0·13a | 0·22a | −0·05 | −0·33a |
| Kynurenic acid | 0·12a | 0·19a | −0·10a | −0·10a | 0·08a | 0·08a | −0·03 | −0·16a | 0·13a | 0·25a | −0·07c | −0·39a | 0·17a | 0·21a | −0·09b | −0·30a |
| Anthranilic acid | 0·07c | 0·00 | −0·21a | −0·06c | −0·02 | −0·04 | −0·14a | −0·13a | 0·01 | 0·03 | −0·14a | −0·21a | 0·05 | 0·07c | −0·10b | −0·22a |
| 3-Hydroxykynurenine | 0·06c | 0·14a | −0·03 | −0·13a | 0·07b | 0·12a | −0·01 | −0·13a | 0·03 | 0·14a | −0·04 | −0·33a | 0·07c | 0·18a | −0·02 | −0·28a |
| Xanthurenic acid | 0·10a | 0·15a | −0·04 | −0·08b | 0·11a | 0·04 | −0·08b | −0·11a | 0·20a | 0·18a | −0·06 | −0·24a | 0·19a | 0·16a | −0·06c | −0·17a |
| 3-Hydroxyanthranilic acid | 0·10a | 0·23a | −0·02 | −0·04 | 0·11a | 0·14a | −0·07b | −0·05c | 0·16a | 0·20a | −0·11a | −0·14a | 0·16a | 0·18a | −0·10b | −0·09b |
aP < 0·001; bP < 0·01; cP < 0·05. Cot = cotinine; eGFR = estimated glomerular filtration rate (over/below 60 ml/min).
In multiple adjusted linear regression analyses, BMD was associated negatively with CRP only in the oldest men (Table 3). Further, BMD was associated negatively with neopterin and KTR in the oldest, but not in the middle‐aged group. Among the kynurenines, positive associations with BMD were found for xanthurenic acid (all sex and age groups) and 3‐hydroxyanthtranilic acid (women only).
Associations between inflammatory markers/metabolites of the kynurenine pathway and bone mineral density in multiple linear regression analysis,* the Hordaland Health Study (n = 5312).
| 46–49 years | 71–74 years | |||||||
| Men (n = 1166–1229) | Women (n = 1776–1862)† | Men (n = 976–1017)† | Women (n = 1161–1204)† | |||||
| Beta‡ | P-value | Beta | P-value | Beta | P-value | Beta | P-value | |
| CRP (μg/ml) | −0·02 | 0·39 | 0·00 | 0·92 | −0·09 | 0·003 | 0·01 | 0·73 |
| Neopterin (nmol/l) | 0·01 | 0·67 | −0·02 | 0·34 | −0·13 | <0·001 | −0·06 | 0·019 |
| KTR | 0·00 | 0·88 | −0·02 | 0·34 | −0·12 | <0·001 | −0·09 | 0·001 |
| Tryptophan (μmol/l) | 0·03 | 0·29 | 0·03 | 0·19 | 0·11 | <0·001 | 0·10 | <0·001 |
| Kynurenine (μmol/l) | 0·02 | 0·60 | 0·00 | 0·98 | −0·04 | 0·16 | 0·00 | 0·89 |
| Kynurenic acid (nmol/l) | 0·03 | 0·28 | 0·04 | 0·054 | 0·01 | 0·69 | 0·03 | 0·26 |
| Anthranilic acid (nmol/l) | 0·04 | 0·17 | −0·03 | 0·15 | −0·02 | 0·48 | −0·01 | 0·80 |
| 3-Hydroxykynurenine (nmol/L) | 0·03 | 0·22 | −0·01 | 0·73 | −0·03 | 0·38 | −0·04 | 0·12 |
| Xanthurenic acid (nmol/l) | 0·07 | 0·013 | 0·08 | <0·001 | 0·14 | <0·001 | 0·12 | <0·001 |
| 3-Hydroxyanthranilic acid (nmol/l) | 0·03 | 0·35 | 0·06 | 0·010 | 0·05 | 0·11 | 0·07 | 0·005 |
*Adjustments were made for body mass index, cotinine and estimated glomerular filtration rate (over/below 60 ml/min). †Numbers vary according to analysed metabolite. ‡Beta = estimated standardized regression coefficient; CRP = C-reactive protein; KTR = kynurenine/tryptophan ratio.
The risk of having low BMD (being in the lowest quintile of BMD) was assessed by logistic regression analyses (Table 4). In the oldest, a higher OR for low BMD was found in the highest, compared to the lowest, quartiles of CRP (only men), neopterin and KTR. The OR for low BMD was decreased significantly in the highest compared to the lowest quartiles of tryptophan, xanthurenic acid and 3‐hydroxyanthranilic acid among both older men and women, and increased for the highest quartile of 3‐hydroxykynurenine in older women. Corresponding analyses in the age group 46–49 years yielded no significant trends or associations (data not shown).
Multiple logistic regression analyses†0 of low bone mineral density (lowest quintile of BMD) among older men and women, according to quartiles (Q1: lowest, Q4: highest) of CRP, neopterin, KTR and metabolites of the kynurenine pathway, the Hordaland Health Study (n = 2221).
Men 71–74 years (n = 976–1017)† | Women 71–74 years (n = 1161–1204)† | |||||||||
| Q1 (ref) | Q2 OR (95% CI) | Q3 OR (95% CI) | Q4 OR (95% CI) | P for trend | Q1 (ref) | Q2 OR (95% CI) | Q3 OR (95% CI) | Q4 OR (95% CI) | P for trend | |
| CRP | 1·00 | 1·31 (0·82, 2·10) | 1·30 (0·79, 2·15) | 1·68 (1·05, 2·69) | 0·041 | 1·00 | 0·96 (0·62, 1·47) | 1·14 (0·73, 1·79) | 1·44 (0·91, 2·27) | 0·11 |
| Neopterin | 1·00 | 1·04 (0·65, 1·67) | 0·97(0·60, 1·57) | 2·01 (1·26, 3·21) | 0·007 | 1·00 | 1·50 (0·95, 2·37) | 1·28 (0·80, 2·05) | 2·34 (1·48, 3·71) | 0·001 |
| KTR | 1·00 | 1·31 (0·82, 2·10) | 1·41 (0·88, 2·26) | 1·80 (1·10, 2·95) | 0·022 | 1·00 | 1·38 (0·90, 2·13) | 1·17 (0·74, 1·86) | 2·04 (1·30, 3·21) | 0·007 |
| Tryptophan | 1·00 | 0·77 (0·50, 1·19) | 0·69 (0·44, 1·08) | 0·51 (0·32, 0·82) | 0·006 | 1·00 | 1·06 (0·70, 1·61) | 0·70 (0·45, 1·09) | 0·66 (0·43, 1·03) | 0·022 |
| Kynurenine | 1·00 | 0·74 (0·46, 1·17) | 1·10 (0·70, 1·73) | 1·12 (0·69, 1·81) | 0·41 | 1·00 | 0·84 (0·55, 1·29) | 0·84 (0·54, 1·31) | 1·40 (0·89, 2·20) | 0·22 |
| Kynurenic acid | 1·00 | 0·86 (0·55, 1·32) | 0·71 (0·45, 1·13) | 0·81 (0·50, 1·34) | 0·27 | 1·00 | 0·65 (0·43, 1·00) | 0·81 (0·53, 1·25) | 0·79 (0·50, 1·25) | 0·43 |
| Anthranilic acid | 1·00 | 1·04 (0·66, 1·63) | 0·82 (0·51, 1·32) | 1·05 (0·66, 1·68) | 0·93 | 1·00 | 0·77 (0·49, 1·19) | 0·92 (0·60, 1·43) | 1·02 (0·66, 1·59) | 0·76 |
| 3-Hydroxykynurenine | 1·00 | 1·03 (0·66, 1·62) | 0·94 (0·59, 1·51) | 1·26 (0·78, 2·04) | 0·45 | 1·00 | 1·01 (0·65, 1·55) | 0·96 (0·61, 1·51) | 1·65 (1·06, 2·58) | 0·050 |
| Xanthurenic acid | 1·00 | 0·57 (0·37, 0·89) | 0·77 (0·50, 1·19) | 0·54 (0·33, 0·87) | 0·033 | 1·00 | 0·92 (0·61, 1·38) | 0·76 (0·49, 1·16) | 0·53 (0·33, 0·84) | 0·007 |
| 3-Hydroxyanthranilic acid | 1·00 | 0·61 (0·39, 0·94) | 0·59 (0·38, 0·93) | 0·56 (0·35, 0·88) | 0·011 | 1·00 | 0·85 (0·57, 1·27) | 0·66 (0·43, 1·01) | 0·57 (0·37, 0·90) | 0·007 |
*Adjusted for body mass index, cotinine and eGFR. †Numbers vary according to analyzed metabolite. BMD = bone mineral density; CI = confidence interval; CRP = C-reactive protein; eGFR = estimated glomerular filtration rate (over/ below 60 ml/min); KTR = kynurenine/tryptophan ratio; OR = odds ratio.
Discussion
In this study, we have investigated BMD in relation to two markers of IFN-γ-mediated inflammation, neopterin and KTR, as well as the relation between BMD and metabolites of the kynurenine pathway. BMD was associated inversely with neopterin and KTR in the older (71–74 years) but not the middle-aged (46–49 years) groups. BMD showed a positive association with xanthurenic acid in all age–sex groups and with 3-hydroxyanthranilic acid among women in both age groups. Further, the proportion of older men and women with low BMD was significantly smaller in the lowest compared to the highest quartile of 3-hydroxyanthranilic acid.
The strengths of this study include the large number of participants of both genders, and the comprehensive laboratory analyses quantifying neopterin as well as all kynurenines along the pathway from tryptophan to 3-hydroxyanthranilic acid by a single analytical method for each subject. A limitation includes the cross-sectional design, which does not preclude reverse causation. In this study plasma metabolites were measured only at a single time-point, which does not necessarily reflect possible long-term changes during the progression of osteoporosis [43].
The inflammatory markers neopterin and KTR have been reported previously to be associated positively with age-related diseases [33,44]. KTR is also associated directly with BMI [45,46] and smoking [47], and inversely with renal function [46,48]. These three factors are strong predictors of BMD [49] and were therefore adjusted for as potential confounders in the analyses. Concentrations of neopterin, tryptophan and kynurenine were comparable to levels found in other studies [33,50]. 3-Hydroxykynurenine and 3-hydroxyanthranilic acid are labile compounds, but concentrations in the present study were comparable to previously published levels from analyses in fresh blood [40].
Tumour necrosis factor (TNF), interleukin (IL)-1 and IL-6 are major stimulators of CRP release. These inflammatory cytokines may mediate bone loss directly by stimulating osteoclast formation and maturation or indirectly by promoting RANKL release, thereby increasing osteoclast activity [15,51]. In the present study a negative association between CRP and BMD was found only among elderly men. Among elderly women we found an association of BMD in total hip with CRP in bivariate, but not in multiple adjusted analyses, which is in concordance with one other study [11]. Previously, an inverse association between BMD and CRP has been found in some [7,8] but not all studies [9,10].
IFN-γ is the principal inducer of neopterin production and the kynurenine pathway, and is produced locally in bone tissue by cells of immune origin and mesenchymal stem cells [52]. IFN-γ is an inhibitor of osteoclast formation and bone resorption [52], but may exhibit a dual effect on bone [15]. In a mouse model mimicking inflammation, infection and oestrogen deficiency, i.e. various conditions predisposing to bone loss, the net effect of IFN-γ was pro-resorptive [5]. This finding is in concordance with our study, where the inflammatory markers neopterin and KTR were associated inversely with BMD among the oldest participants. This inverse association was most evident in elderly patients with low BMD, and strongest among older women. IFN-γ signalling as a target for treatment of osteoporosis has been proposed [5,53]. In contrast, in a study comparing cytokine gene expression in bone tissue from osteoporotic versus osteoarthritic patients, a higher expression of IFN-γ-related genes in osteoarthritic hip specimens was found, indicating an anti-osteoclastogenic activity of IFN-γ [54]. Although this study is not directly comparable with the present study, the conflicting results may indicate a difference in local versus systemic impact of IFN-γ activity.
Besides being a marker of IFN-γ activity, elevated neopterin also reflects increased production of reactive oxygen species [55], and its concentration in serum is correlated with the clinical course of infections with viruses, intracellular bacteria or parasites and is increased in patients with malignant tumour [56,57]. Patients with chronic infection or cancer are predisposed to bone loss [1,58], and additional mechanisms may be involved that are not mediated by IFN-γ.
As the kynurenine pathway is induced by inflammation, a negative association with the kynurenine metabolites and BMD could be expected. An unexpected finding was the positive association of BMD with xanthurenic acid and 3-hydroxyanthranilic acid. However, 3-hydroxyanthranilic acid has been found earlier to inhibit proinflammatory cytokines and may down-regulate neuroinflammation [59]. Further, low 3-hydroxyanthranilic acid among osteoporotic patients compared to controls was found in a study by Forrest et al. [36], findings which are in concordance with ours. Xanthurenic acid has been associated with cell apoptosis and oxidative stress in experimental studies and putatively related to ageing and disease development [60,61]. We found, however, that xanthurenic acid was associated positively with BMD in both age and sex groups, suggesting a bone protective role for this metabolite. This finding illustrates the complexity of the kynurenine pathway, as metabolites may possess both pro- and anti-inflammatory properties, possibly dependent upon the organs or tissues involved.
Cortical bone loss is particularly rapid during the first years after menopause in women, but gradually slows down and becomes more similar to bone loss in men [62]. Experimental evidence suggests that oestrogen withdrawal at menopause leads to activation of T cells and thereby increased release of IFN-γ [14]. We did not find any significant associations between BMD and the inflammation markers among women aged 46–49 years in our study, the age during which postmenopausal-accelerated bone loss is expected to begin. However, the cross-sectional design of our study is not optimal to detect any such associations related to bone loss induced by oestrogen deficiency.
In conclusion, the previously reported association between inflammation and BMD [1] was confirmed for the oldest subjects in this study. Associations between several of the kynurenines and BMD indicate a role of the IFN-γ-activated kynurenine pathway in bone metabolism. Our study suggests that neopterin and KTR are independent risk factors for low BMD, but it remains unclear as to whether this is mediated directly by these metabolites, or whether IFN-γ-mediated inflammation and bone degradation are stimulated by a common causal factor through separate mechanisms. Possible separate effects of tryptophan degradation products on bone tissue should be investigated further in experimental studies. Prospective studies are required to assess whether altered levels of kynurenines precede the onset of bone loss.
Disclosures
All authors state that they have no conflicts of interest.
Author contributions
E. M. A., C. G. G., P. M. U. and G. S. T. designed the study. The study was conducted by P. M. U. and G. S. T. C. G. G., P. M., Ø. M., K. M. and G. S. T. collected the data. The data were analysed by E. M. A., G. E. E. and A. U. and were interpreted by E. M. A., C. G. G., P. M. U., Ø. M., A. U., G. E. E., K. M. and G. S. T. E. M. A., C. G. G., P. M. U. and G. S. T. drafted the manuscript and E. M. A., C. G. G., P. M. U., Ø. M., A. U., G. E. E., K. M. and G. S. T. revised the manuscript content. E. M. A., C. G. G., P. M. U., Ø. M., A. U., G. E. E., K. M. and G. S. T. approved the final version of manuscript. E. M. A. takes responsibility for the integrity of the data analysis.
References
