


Abstract
To study the flow, heat transfer, and reaction performance of the microchannel multistream heat exchangers coupled with ortho–para hydrogen conversion, this work develops a one-dimensional model of heat exchanger, while considering the flow arrangement inside heat exchanger. The model reveals the temperature and pressure distributions across various streams in the exchanger and the changes in the concentration of para-hydrogen in the feed stream. The results show that the thermal load from ortho–para hydrogen conversion accounts for about one-third of the total thermal load of feed hydrogen. Increasing the feed hydrogen pressure is beneficial to reducing the heat transfer temperature difference, which can optimize heat transfer and reaction performance. When the temperature difference is reduced by 1.86 K, the outlet temperature decreases from 85.37 to 82.06 K, and para hydrogen concentration increases from 24.99% to 39.77%. Meanwhile, a larger heat transfer area is required. Proper allocation of thermal loads among the multiple cold streams is crucial to prevent performance deterioration. Further, simply increasing the reaction rate has a limited effect on performance, and the performance will be improved 83.45% while maintaining the heat exchanger area unchanged. This work provides a reference for designing multistream heat exchangers and lays the groundwork for continuous ortho–para hydrogen conversion in hydrogen liquefaction process simulations.
1. Introduction
Liquefying hydrogen can effectively address the issue of low volumetric energy density [1] when hydrogen is used as an energy carrier [2]. However, storing and transporting liquid hydrogen at ultra-low temperatures requires not only thermal insulation considerations but also accounting for the heat released from the ortho–para hydrogen conversion (OPC). Due to quantum effects [3, 4], hydrogen exists in two spin isomers, ortho-hydrogen (oH2) and para-hydrogen (pH2), with pH2 being in a lower energy state [5]. Therefore, as the temperature drops, oH2 spontaneously but slowly converts to pH2 while releasing heat.
To ensure long-term storage of liquid hydrogen, OPC is necessary during the hydrogen liquefaction process [6], to achieve a pH2 molar concentration of over 95% [7] in the liquid hydrogen product. The heat released from OPC is temperature-dependent, with more heat at a lower temperature [5]. Teng et al. [8] found that continuous conversion results in the smallest heat release and lowest energy consumption compared to isothermal and adiabatic conversion. Continuous OPC requires catalysts to be arranged within the heat exchanger, coupling the OPC reaction with the heat exchange process.
Current commercial software, such as Aspen HYSYS [9, 10] and UniSim [11], use zero-dimensional models for the heat exchangers in hydrogen liquefaction processes, which can neither capture the internal heat transfer effects nor couple the continuous OPC. Some researchers [8, 12] have integrated the heat from OPC as an internal heat source in heat exchanger, but the methods are still zero-dimensional models. Others [13] have proposed one-dimensional models for two-stream plate-fin heat exchangers, including OPC, but research is still needed on multistream heat exchangers [14–16], which are more commonly used in hydrogen liquefaction, to explore the coupling of OPC and flow heat transfer. Currently, there is still a lack of models to characterize the performance of multistream heat exchangers.
Additionally, the reported hydrogen liquefaction systems all use the brazed plate-fin heat exchangers [15, 17]. Due to material limitations, the temperature drop across a single plate-fin heat exchanger typically does not exceed 50 K, and the exchangers are relatively large, which hinders cost reduction. In recent years, microchannel heat exchangers have attracted significant attention from researchers [18–20]. The microchannel heat exchangers offer larger heat transfer area, which helps to reduce the temperature difference across the exchanger and to lower its cost, presenting a promising application outlook.
To investigate the performance of multistream microchannel heat exchangers coupled with the catalytic OPC, this work considers the flow arrangement within the heat exchanger and proposes a one-dimensional model for multistream heat exchangers. The model reveals the internal flow, heat transfer, and continuous OPC, providing structural and performance parameters for equipment selection. The results are expected to improve the heat exchanger model in the simulation calculations of hydrogen liquefaction processes.
2. Physical model of heat exchanger
This section presents the heat exchanger models, including both geometric and mathematical aspects. The geometric model describes the flow arrangement within the multistream heat exchanger, serving as the basis for calculating the heat transfer area. The mathematical model primarily discusses the differential equations of the one-dimensional model. Additionally, to solve those equations, the methods for calculating the heat transfer area and the kinetic model of catalytic OPC are introduced.
2.1 Geometric model
The microchannel heat exchanger is fabricated with the stacked substrates by diffusion welding method [20]. Semicircular grooves of specific radii are etched on both surfaces of the substrates. Based on the flow channel layout, the substrates with various groove are stacked and welded in sequence to form circular flow channels, as shown in Fig. 1. In Fig. 1a, there are two different types of substrates. Alternating the stacking of these substrates can form two circular flow channels with different diameters. The principle of the three-stream heat exchanger is similar. As in Fig. 1b, there are four different types of substrates stacked in a specific periodic order, forming three flow channels of varying diameters. The different diameters mentioned here are only used to distinguish the flow channels for different streams. In actual production, the diameters of the flow channels for different streams can be the same.
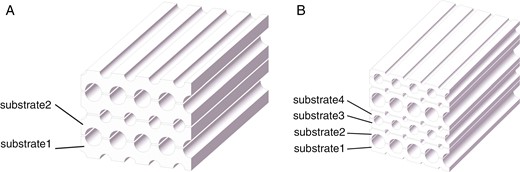
Schematic diagram of the assembly of substrates: (a) two-stream heat exchanger and (b) three-stream heat exchanger.
2.2 Mathematical model
The control equations are introduced for multistream heat exchanger using the three-stream heat exchanger as an example, with the stream arrangement shown in Fig. 1b. For convenience, the three streams are named Stream A, Stream B, and Stream C. Stream A is the hot stream, specifically the feed hydrogen stream, while Streams B and C are the cold streams.
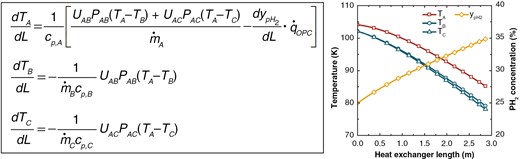
For Streams A, B, and C, the energy conversion equations are:
Where is the length of heat exchanger, is the temperature, is the mass flow rate, is the specific heat capacity, is the heat transfer coefficient, is the heat transfer area per unit length of heat exchanger, is the mole fraction of pH2, and is the heat released per unit mass of oH2 converting to pH2. Subscripts A, B, and C represent Streams A, B, and C, respectively. Subscripts AB and AC represent the parameters between Streams A and B, and between Streams A and C, respectively.
For a zero-dimensional model, it is sufficient to satisfy the energy conservation Equation (8):
Where is the temperature difference between the inlet and outlet of stream, and subscripts A, B, and C represent Streams A, B, and C, respectively.
The mass flow rates and of the two cold streams are unconstrained. However, for the one-dimensional model, the following relationship exists between the two cold streams:
Where is the heat exchange between Streams A and B, and is the heat exchange between Streams A and C.
Under ideal conditions, Streams B and C maintain a small temperature difference with Stream A, so the temperature difference between Streams B and C is also small. Thus, and . The Equation (6) can be simplified into:
Where represents the physical properties, and represents the structural parameters. When the fluids and the heat exchanger structure are fixed, the mass flow rate ratio between Streams B and C is influenced by the ratio of their heat transfer coefficients. In determining the mass flow rates of cold streams, it is necessary to consider their actual heat exchange performance to allocate the appropriate thermal load.
The change in pH2 concentration in Stream A depends on the reaction rate:
Where is the molar mass of hydrogen, is the OPC reaction rate, and is the cross-sectional perimeter of Stream A.
Microchannel heat exchangers pose challenges in calculating heat transfer area due to the irregularity of the heat transfer surface. The area compensation method is introduced [21]. As shown in Fig. 2, the actual heat transfer area of adjacent channels is represented by , and the equivalent area by . The relationship between the actual heat transfer area and the equivalent area is as follows:
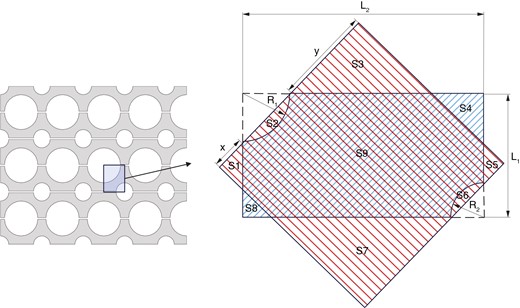
Schematic diagram of the area compensation method.
The heat transfer area is:
Where and are the radii of two channels, and and are the horizontal and vertical distances between the central axes of two channels, respectively.
Hydrogen is a mixture of pH2 and oH2, and there is a reversible reaction OPC:
At room temperature (300 K), the molar concentration ratio of oH2 to pH2 in hydrogen is 0.75:0.25, and this mixture is commonly referred to as normal hydrogen. As the temperature drops, oH2 gradually converts to pH2, releasing heat. The hydrogen with oH2 and pH2 concentrations at their equilibrium values for a given temperature is known as equilibrium hydrogen, in which the concentration of pH2 depends solely on the temperature and increases as the temperature drops. At room temperature, the pH2 concentration is 0.25, and at 20 K, it approaches 1. However, at lower temperature, OPC would release more heat. At 20 K, the heat from OPC is 700 kJ/kg, which is 20.77 times the value at room temperature and 1.56 times the latent heat of hydrogen. The equilibrium concentration of oH2 and pH2, and the heat from OPC as functions of temperature are shown in Fig. 3.
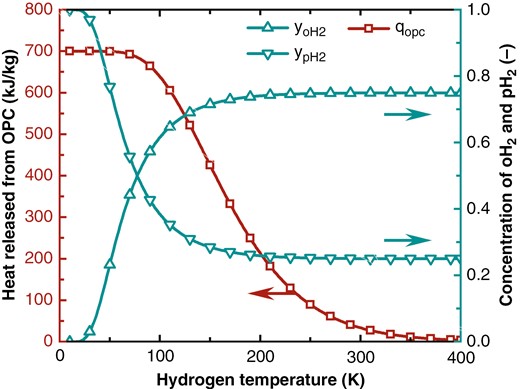
Changes in oH2 and pH2 concentrations in equilibrium hydrogen and the heat released from OPC.
Reaction progress is typically described using kinetic models. Common models for describing the kinetics of the catalytic OPC include the first-order kinetic model [13], the Langmuir–Hinshelwood model [22], and the Elovich model [23]. Among these, the Elovich model is noted for its higher accuracy and better agreement with experimental data [24]. The Elovich model is given by [23]:
Where is the molar concentration of pH2 in equilibrium hydrogen at the current temperature, and and are the reaction parameters.
Based on the above model, Wilhelmsen et al. [25] fitted the parameters and using experimental data:
Where and are the reaction temperature and pressure, respectively. is the critical temperature of hydrogen, 32.937 K. is the critical pressure of hydrogen, 1.28 MPa. , , , and are the constants with values of 1.0924, 0.0597, −0.2539, and −0.0116 kmol·m−3·s−1, respectively.
3. Model validation
3.1 Step size independence verification
Since directly solving the differential equations in the heat exchanger model is challenging, the equations are converted into difference equations through temperature discretization. A larger discretization step size can speed up the computation but increase the error compared to the differential equations, and vice versa. The results for different discretization step sizes are shown in Fig. 4.
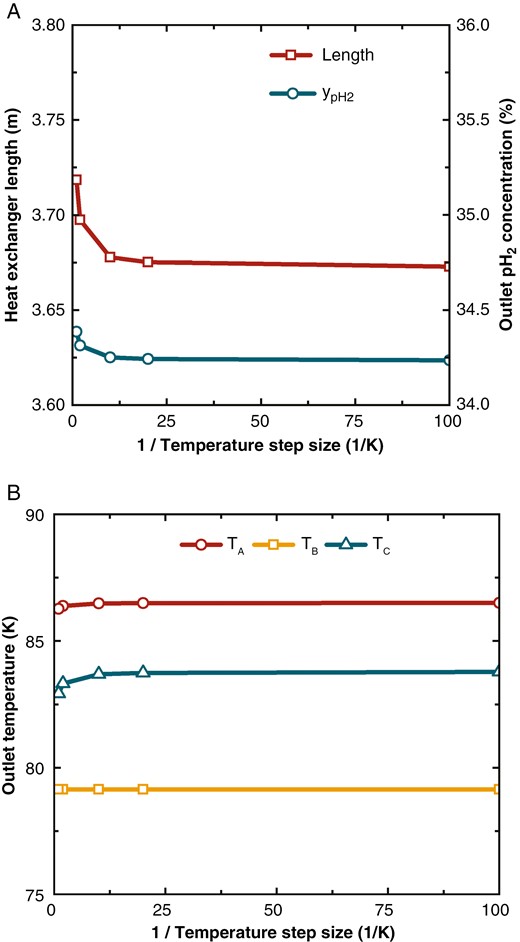
Parameter variations with different temperature step sizes. (a) Heat exchanger length and outlet pH2 concentration, and (b) outlet temperatures of the streams.
The length of heat exchanger varies significantly with the discretization step size. A larger step size can increase the deviation between the temperature difference in the difference equations and that in the differential equations, affecting the heat exchange area, which is indicated by the length of heat exchanger. Changes in the heat exchanger length cause variations in the hydrogen concentration, as the OPC is related to the reaction volume. The temperature changes in the three streams are minor because the heat is calculated mainly through enthalpy differences, which are not affected by the temperature step size. However, due to the heat from OPC, stream temperatures also vary, with the most noticeable change in Stream C, which has the smallest mass flow rate.
Overall, when the discretization step size is greater than 0.05 K (1/ΔT < 20), key parameters such as heat exchanger length, pH2 outlet concentration, and Stream C outlet temperature show significant changes with varying step size. When the step size is less than 0.05 K (1/ΔT > 20), the parameters remain nearly constant. Thus, a discretization step size of 0.05 K balances accuracy and computational speed effectively.
3.2 Comparison with computational fluid dynamics simulation results
Computational fluid dynamics (CFD) simulation can yield result close to experimental data but faces the challenge in integrating CFD with hydrogen liquefaction processes, while a one-dimensional model can easily be integrated. In this section, the CFD simulation results [24] are used as the standard for validating the one-dimensional model.
For the outlet temperature of feed hydrogen, the CFD result is 43.7 K, while this model result is 42.6 K, indicating a temperature error of approximately 1 K. For the outlet concentration of pH2, the CFD result is 0.8127, compared to this model result of 0.8373, resulting in a concentration error of less than 2%. Regarding the heat exchanger length, the CFD result is 2.5 m, whereas this model estimates 2.58 m, leading to a length error of less than 3%. Given that current industrial temperature sensors have an accuracy of around 1 K, and hydrogen concentration measurement deviations are about 3% [26], the model’s results are considered reliable, taking into account the measurement instrument’s accuracy.
4. Result and discussion
4.1 Case analysis
Stream A is the feed hydrogen, which undergoes an OPC while transferring heat, releasing reaction heat. Stream B is the low-pressure expanded hydrogen, with its low temperature derived from the cooling of the expansion machine. Stream C is the low-temperature nitrogen, serving as an external cooling source to assist in cooling the feed hydrogen [21]. The operating parameters of each stream are shown in Table 1.
Parameters of different streams.
| Parameters | Stream A | Stream B | Stream C | ||||
|---|---|---|---|---|---|---|---|
| With OPC | Without OPC | With OPC | Without OPC | With OPC | Without OPC | ||
| Temperature of hot end | K | 104.15 | 104.15 | 102.15 | 102.15 | 102.15 | 102.15 |
| Pressure of hot end | MPa | 1.14 | 1.14 | 0.16 | 0.16 | 0.1 | 0.1 |
| Temperature of cold end | K | 85.23 | 87.67 | 79.15 | 79.15 | 78.10 | 81.36 |
| Pressure of cold end | MPa | 1.13 | 1.13 | 0.15 | 0.15 | 0.11 | 0.11 |
| Inlet pH2 concentration | % | 25.00 | 25.00 | ||||
| Outlet pH2 concentration | % | 34.88 | 25.00 | ||||
| Mass flow rate | kg/s | 1.034 | 1.034 | 0.868 | 0.677 | 2.690 | 1.076 |
| Channel diameter | mm | 2 | 2 | 6 | 6 | 3 | 3 |
| Channel number per layer | 150 | 150 | 150 | 150 | 150 | 150 | |
| Layer number | 120 | 80 | 60 | 40 | 60 | 40 | |
| Total channel number | 18 000 | 12 000 | 9000 | 6000 | 9000 | 6000 | |
| Flow velocity | m/s | 6.29 | 9.53 | 7.95 | 9.35 | 10.44 | 6.55 |
The temperature, pH2 concentration, and pressure distribution inside the heat exchanger with OPC are illustrated in Fig. 5. The length direction of the heat exchanger is from the hot end to the cold end, with the hot end being the point of length 0. Across the length of the heat exchanger, the temperatures of Streams A, B, and C gradually decrease. The temperature curves of Streams B and C have very little deviation, indicating that the temperature difference between these two streams and the hot stream is nearly equal. The hydrogen concentration increases almost linearly from the initial concentration of 25% to the exit concentration of 34.88%. This is because, at the beginning of the reaction, the current concentration is significantly different from the equilibrium concentration, and the reaction rate is temporarily not limited by the equilibrium concentration. The pressure remains largely unchanged because the flow path is a smooth, circular, straight channel, which does not produce significant flow resistance. There might be substantial flow losses at the sealing and in the distributor of the microchannel heat exchanger [27], but this is beyond the scope of the current model.
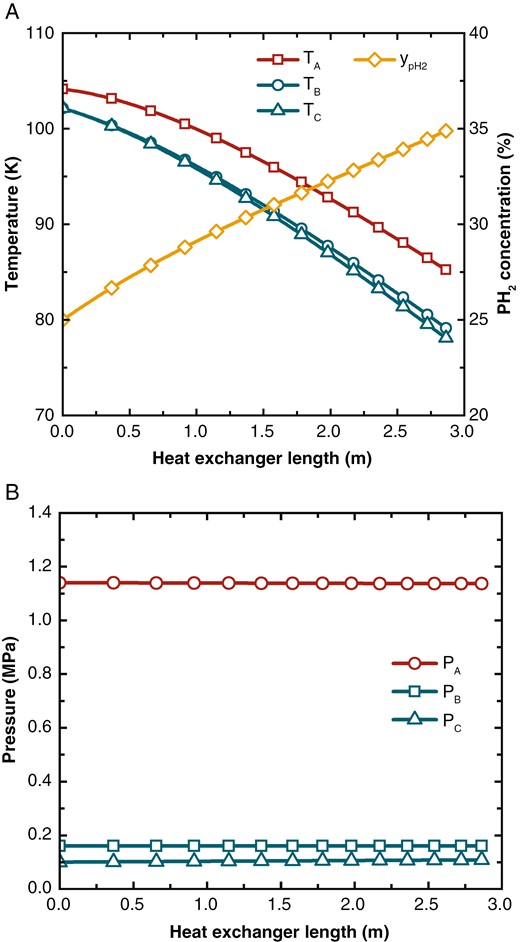
(a) Temperature and hydrogen concentration distribution and (b) pressure distribution in the three-stream heat exchanger with OPC.
From an energy distribution perspective, the total heat load of Stream A is 290.39 kW, with a sensible heat load of 224.24 kW and an OPC heat load of 66.15 kW. The heat load removed by Stream B is 219.80 kW, accounting for 75.69%, and the heat load removed by Stream C is 70.59 kW, accounting for 24.31%. The length of the heat exchanger is 2.86 m.
To study the importance of OPC on the performance of heat exchangers, we consider the case without OPC, i.e. maintaining the pH2 concentration unchanged. The parameters for each stream under this condition are listed in Table 1.
When ignoring the OPC, the thermal load reduces to 195 kW, which is a 32.8% decrease compared to the case with OPC. With the reduction in thermal load, the distribution of the loads between Streams B and C should be recalculated. The mass flow rates of Streams B and C are reduced to 0.677 and 1.076 kg/s, representing reductions of 22.0% and 60%, respectively. From the total channel number, it can be seen that the heat exchanger area has also decreased by 33.3%. The significant decrease in mass flow rate of Stream C has led to a reduction of the heat transfer coefficient on the Stream C side. Consequently, the load proportion of Stream C decreases from 24.31% under the case with OPC to 12.41%.
The thermal load from OPC accounts for about one-third of the total thermal load of feed hydrogen and significantly affects the mass flow rates of cold streams and heat exchanger area. Therefore, ignoring the impact of heat released from OPC is not advisable.
4.2 Influence of design parameters
The impact of heat exchanger design parameters on equipment performance is then analyzed, primarily including feed hydrogen pressure, cold stream mass flow rate ratio, heat exchange temperature difference, and catalyst performance. The main performance metrics are the outlet temperature of the feed hydrogen, the outlet concentration of pH2, and the length of the heat exchanger.
4.2.1 Feed hydrogen pressure
The feed hydrogen, when liquefied, generally operates at high pressure but not excessively high. If the hydrogen pressure is too low, several issues can arise: firstly, the liquefaction process might involve phase changes, leading to a significant temperature difference across the heat exchanger due to the constant temperature during phase changes. Secondly, at low temperatures, the feed hydrogen may approach the critical region, causing abrupt changes in thermophysical properties, such as isobaric specific heat capacity (), which can result in poor temperature matching between the hot and cold streams and thus deteriorate heat exchange performance [28]. On the other hand, if the feed hydrogen pressure is set too high, additional equipment such as a compression system would be required, introducing extra power consumption and reducing overall energy efficiency [29].
Therefore, the feed hydrogen pressure should be maintained within a specific range and set according to the actual process conditions. This work examines the impact of feed hydrogen pressures on heat exchange and reaction performance from the perspective of the heat exchanger.
Figure 6 shows the variation of of hydrogen with temperature under different pressures. Between 100 and 120 K, the decreases linearly with temperature at all pressures, though this decrease becomes less pronounced as pressure is increased. In the 80–100 K range, at lower pressures, the decreases slowly with temperature, while at higher pressures, there is a noticeable rebound as the temperature drops.
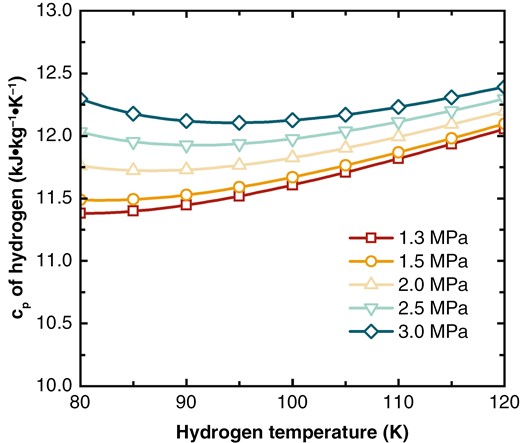
Variation of Cp with temperature and pressure.
The variation in affects the temperature difference between hot and cold streams in the heat exchanger. A greater difference in between the streams leads to a larger temperature difference. Figure 7 shows the temperature difference between the hot and cold streams in the heat exchanger under high, medium, and low pressures. The x-axis represents the normalized length: . At = 1.3 MPa, the decreases with temperature, but the decrease slows down. Consequently, the temperature difference between the hot and cold streams increases due to the mismatch in , reaching a maximum of 5.4 K.
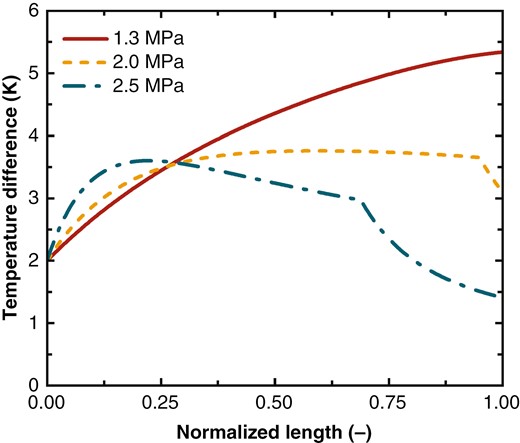
Temperature difference across the heat exchanger at various pressures.
At = 2.0 and 2.5 MPa, the rebound in at lower temperatures optimizes the matching of between the streams, which results in a reduction in the temperature difference at the cold end of the heat exchanger, with the maximum temperature differences reducing to 3.7 and 3.5 K, respectively.
Figure 8 illustrates how the length of the heat exchanger, the outlet temperature of the feed hydrogen, and the concentration of pH2 change with the varying feed hydrogen pressures. As feed hydrogen pressure increases, the matching of between hot and cold streams is optimized, which helps reduce the temperature difference in the heat exchanger. This reduction in temperature difference enhances the heat transfer efficiency, lowers the outlet temperature of the feed hydrogen, and increases the outlet concentration of pH2. However, the heat exchanger requires a larger surface area, leading to increased length and, consequently, higher cost. According to industry feedback, the cost of the heat exchanger is closely determined by its volume.
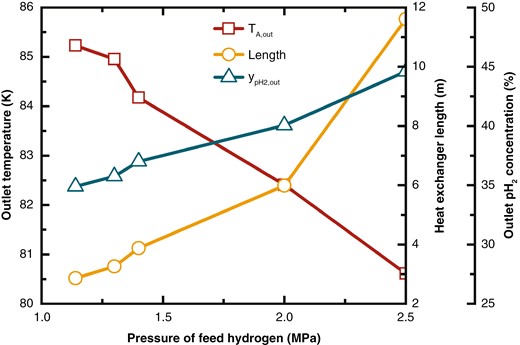
Variations in feed hydrogen outlet temperature, heat exchanger length, and outlet pH2 concentration at different pressures.
The outlet temperature of the feed hydrogen and the concentration of pH2 are linearly related to the feed hydrogen pressure, while the length of the heat exchanger increases exponentially. Therefore, feed hydrogen pressure should not be increased unreasoningly. Instead, both the performance and cost of the heat exchanger should be considered to determine an optimal range.
4.2.2 Mass flow rate ratio of Streams B and C
and need to maintain a certain ratio to keep the temperatures of the two cold streams similar, ensuring stable heat exchange temperature differences. Deviations in their mass flow rates can cause one or both streams to experience excessively large or small temperature differences.
Assume that the ratio of the current mass flow rates to the mass flow rates of the original case is denoted as mass flow rate ratio . By keeping constant and adjusting , the resulting temperature distribution and the concentration of pH2 are shown in Fig. 9.
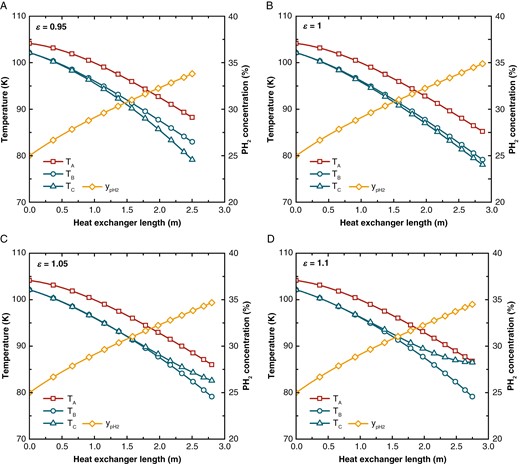
The temperature and pH2 concentration distribution across the heat exchanger at different mass flow rate ratios (ε). (a) ε = 0.95, (b) ε = 1, (c) ε = 1.05, and (d) ε = 1.1.
When is small, Stream C cannot afford the heat load, resulting in a greater temperature change. Overall, the temperature of Stream C decreases more rapidly, which increases the temperature difference with Stream A. The increased temperature difference reduces the length of the heat exchanger and also lowers the pH2 concentration. Compared to the case = 1, in the case = 0.95, the heat exchanger length decreased from 2.86 to 2.50 m, the feed hydrogen outlet temperature increased from 85.23 to 88.23 K, and the pH2 concentration decreased from 34.89% to 33.82%.
When is large, the temperature change in Stream C decreases, reducing the temperature difference with Stream A, thus diminishing the driving force for Stream C to provide cooling to Stream A. Although the increased mass flow rate of Stream C means that more cooling is provided, the limited heat transfer performance means that excess cooling cannot be effectively transferred to Stream A, resulting in an increased outlet temperature of Stream C. Due to the poor heat transfer performance of Stream C, Stream A receives insufficient cooling, evident in the increased outlet temperature of Stream A. Although the reduced temperature difference between Streams A and C benefits the pH2 concentration, the increased temperature of Stream A enlarges the temperature difference with Stream B, partially negating this benefit and potentially adversely affecting the pH2 concentration. The case = 1.05 and = 1.1 show a reduced heat exchanger length, increased feed hydrogen outlet temperature, and decreased pH2 concentration.
In summary, the deviations of from the optimal mass flow rate ratio, whether too high or too low, lead to deterioration in both heat exchanger performance and catalytic conversion efficiency.
4.2.3 Heat exchange temperature difference
Since the heat exchanger exhibits a temperature distribution, the local heat exchange temperature difference varies with length. The heat exchange temperature difference here is the average heat exchange temperature difference.
As shown in Fig. 10, as the heat exchange temperature difference decreases, the outlet temperature of Stream A significantly drops, requiring a larger heat exchange area, which increases the length of the heat exchanger. When the heat exchange temperature difference decreases from 4.50 to 2.64 K, the heat exchanger length increases from 2.92 to 5.41 m, indicating a 95% increase. The outlet temperature of feed hydrogen decreases from 85.37 to 82.06 K, and the outlet pH2 concentration increases from 34.99% to 39.77%.
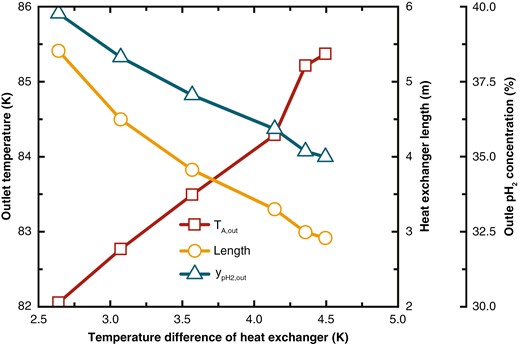
Variations in feed hydrogen outlet temperature, heat exchanger length, and outlet pH2 concentration under different heat exchange temperature differences.
4.2.4 Catalyst performance
As above mentioned, the OPC is influenced by the reactor volume. Figure 11 illustrates how the outlet pH2 concentration varies with the length of heat exchanger. When the heat exchanger is relatively short, the outlet concentration increases linearly with the length of heat exchanger. However, once a certain concentration is reached, the increase in pH2 concentration slows down due to limitations imposed by equilibrium concentration and catalyst performance.
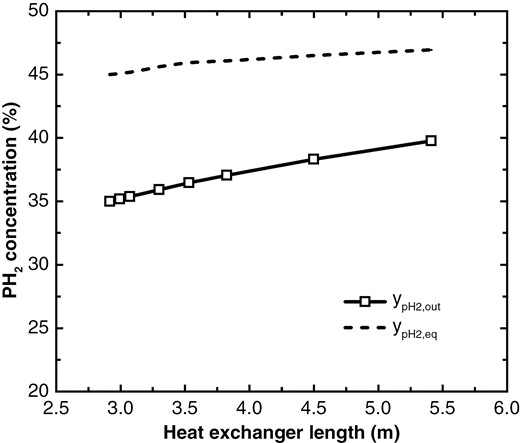
Variation of outlet pH2 concentration with heat exchanger length.
As shown in Fig. 12, with improved catalyst performance, which is indicated by an increase in the reaction rate , the feed hydrogen outlet temperature rises due to more reaction heat released, which increases thermal load. This higher temperature amplifies the temperature difference between hot and cold streams, reducing the required heat exchange area and thus shortening the heat exchanger length. Although a higher reaction rate tends to increase the outlet pH2 concentration, the reduced heat exchanger volume has a counteracting effect. Overall, the pH2 concentration slightly increases by 1.39%. With a constant heat exchanger length, the concentration shows a significant improvement of 2.55%, representing an 83.45% increase compared to before.
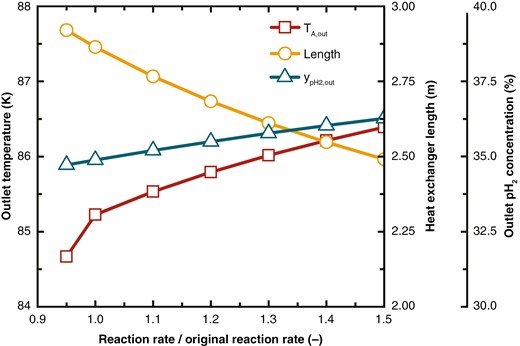
Changes in feed hydrogen outlet temperature, heat exchanger length, and outlet pH2 concentration under different reaction rates.
5. Conclusion
A one-dimensional model is established for a three-stream microchannel heat exchanger to investigate the cooling of feed hydrogen from 100 to 83 K and to analyze flow heat transfer and catalytic conversion performance. The following conclusions are drawn.
This one-dimensional model can reveal the temperature and pressure distribution across the length of the heat exchanger, while coupling the continuous OPC, providing the distribution of pH2 concentration. This facilitates the detailed design of the heat exchanger. Considering that about one-third of the total thermal load of feed hydrogen comes from OPC, it is advisable to take OPC into account.
The raise of feed hydrogen pressure can benefit the outlet temperature of the feed hydrogen and the concentration of pH2, but it also requires a larger heat transfer area. As the pressure increases, both the outlet temperature and the concentration of pH2 change linearly, while the heat transfer area increases exponentially, and additional pressurization equipment may be needed. Therefore, it is necessary to balance performance and cost to select an appropriate feed hydrogen pressure.
The thermal load distribution between the two cold streams, i.e. the mass flow rate ratio, is influenced by their heat transfer performance with the hot stream. However, the heat transfer coefficient also depends on the mass flow rates of the cold streams, as mass flow rate affects the velocity within the flow channels. Therefore, multiple iterations are needed to achieve optimal heat exchanger performance when determining the mass flow rates. Deviations from the optimal mass flow rate ratio in the cold streams, whether higher or lower, negatively impact the heat exchanger's performance.
Reducing the temperature difference across the heat exchanger significantly improves both heat transfer and reaction performance, but also markedly increases the length of the heat exchanger. For instance, reducing the temperature difference from 4.5 to 2.64 K results in a 95% increase in heat exchanger length. Hence, practical design should balance heat exchanger performance with cost.
Enhancing catalyst performance can improve reaction performance, with an increase in catalyst performance leading to a 1.39% rise in the outlet concentration of pH2. However, improving catalyst performance alone affects heat transfer, reducing the heat exchanger area and hindering the reaction performance improvements. When the heat exchanger length is fixed, the benefits from enhanced catalyst performance increased by 83.45% compared to before.
Stream A
Heat transfer area (m2)
Stream B
Stream C
Specific heat capacity at constant pressure (kJ/kg·K)
Temperature difference between the inlet and outlet of stream
Equilibrium hydrogen
Mass flow rate ratio
Length of heat exchanger (m)
Horizontal distance between the central axes of the two channels (mm)
Vertical distances between the central axes of the two channels (mm)
Mass flow rate (kg/s)
Molar mass of hydrogen (kg/mol)
- oH2
Ortho-hydrogen
Heat transfer area per unit length of the heat exchanger (m2/m)
Cross-sectional perimeter (m)
Pressure (MPa)
Critical pressure (MPa)
- pH2
Para-hydrogen
Heat (J)
Heat released from 1 kg ortho-hydrogen conversing to para-hydrogen (J/kg)
Conversion reaction rate (mol/m3·s)
radii of channel (mm)
Temperature (K)
Heat transfer coefficient (W/m2·K)
Temperature (K)
Critical temperature (K)
Molar concentration
Nomenclature
Author contributions
Yajie Shen (Conceptualization [equal], Data curation [equal], Methodology [equal], Writing—original draft [equal]), Wenjing Zhao (Conceptualization [equal], Investigation [equal], Supervision [equal]), Wenping Dong (Validation [equal]), Guangli He (Investigation [equal], Supervision [equal]), and Tao Jin (Investigation [equal], Supervision [equal], Writing—review & editing [equal])
Conflict of interest statement
The authors declare that they have no known competing financial interests or personal relationships that could have appeared to influence the work reported in this paper.
Funding
This research was funded by the Basic Research Funds for the Central Government "Innovative Team of Zhejiang University" (no. 2022FZZX01-09).
Data availability
The data underlying this article will be shared on reasonable request to the corresponding author.
