


Abstract
This study explores the effects of magnesium (Mg) and lanthanum (La) doping on the performance of dye-sensitized solar cells (DSSCs) utilizing TiO2(98%)−ZrO2(2%) (TZ, TZM, and TZL) photoanodes. The photoanodes were fabricated using a spin-coating sol–gel method, followed by calcination at 400°C. The structural, morphological, crystallographic, and optical properties of the proposed photoanode composites were characterized by X-ray diffraction, transmission electron microscopy, and ultraviolet–visible spectroscopy. The crystallite sizes of the synthesized thin films varied from 21.16 to 59.04 nm for the TZ, TZM, and TZL compositions. The current–voltage measurements of DSSCs based on TZL8 photoanode, cobalt sulfide-doped graphene counter electrode, and N719 dye revealed the highest efficiency of nearly 5.052%. The assembled DSSCs exhibited an open-circuit voltage of 0.74 V, a short-circuit current density of 9.964 mA/cm2, and a fill factor of 0.685. The enhancement in open-circuit voltage and short-circuit current density could be attributed to the improved electronic and microstructures of the proposed photoanodes.
1. Introduction
Titanium dioxide, also known as titania and represented by the chemical formula TiO2, is a metal oxide semiconductor characterized by a large band gap and high electron mobility [1, 2]. TiO2 is one of the most widely used metal oxide semiconductors owing to several advantageous properties, including nontoxicity, low cost, chemical stability, long-lasting photo-generated charge carriers, and ease of fabrication [3, 4]. Due to these qualities, TiO2 shows promise for a diverse range of applications such as gas sensing, antireflective coatings, photocatalysis, optoelectronics, and solar cells. Zirconium doping of TiO2 was researched because Zr and Ti belong to the same subgroup in the periodic table, granting them an identical valence state allowing successful incorporation of Zr into the TiO2 crystal lattice to form a Ti1−xZrxO2 [5, 6]. This increases the bond length and stabilizes the anatase crystalline phase by delaying crystal growth kinetics. As a result, numerous studies have explored Zr-doped TiO2 [7, 8]. This stabilization is particularly important for maintaining the anatase phase of TiO2, which is known for its favorable photocatalytic properties. By delaying the crystal growth, zirconium doping helps preserve the desired anatase structure, which is crucial for applications in photocatalysis and solar energy conversion [9, 10].
Zirconium oxide (ZrO2) also has various uses as a gas sensor and electrocatalyst due to its outstanding dielectric and optical properties [8, 11].
Lanthanum (La) is a rare earth element known to improve the photocatalytic and surface properties of TiO2 through doping [12]. Over the past few decades, TiO2 nanoparticles (NPs) have attracted significant global interest due to their advantages, such as high refractive index, dielectric constant, photocatalytic abilities, and photoelectric conversion efficiency [13, 14]. Considering the importance of TiO2, extensive research has explored and established many methods for synthesizing TiO2. However, developing cost-effective and simple synthetic techniques for producing high-quality TiO2 remains an area of ongoing investigation. TiO2 exists in three phases: anatase, rutile, and brookite, with anatase and rutile possessing tetragonal crystal structures but different space groups [10, 15]. TiO2 and ZrO2 mixtures have proven valuable in optoelectronic, catalytic, and solar cell materials, and their compounds have found application in ceramic materials and microwave technology for various advanced uses [16, 17]. Nanosized particles of TiO2 and ZrO2 have a high specific surface area and stability, demonstrating enhanced performance and applicability compared to their individual particles [18, 19]. TiO2 and ZrO2 work well together in many applications due to their unique properties. The TiO2–ZrO2 complex shows improved photocatalytic efficacy under ultraviolet (UV) light, as ZrO2 stabilizes TiO2 and improves light absorption [20].
Among the various synthesis techniques, the sol–gel method has distinct advantages. It provides higher stability and enables processing at lower temperatures. Additionally, it offers excellent control over structure and high homogeneity at the molecular level. Furthermore, the simplicity and low cost of the sol–gel method allow for large-scale production [16, 21, 22].
Rare earth element doping is used to compensate for the nonabsorbable wavelength range of dye-sensitized solar cells (DSSCs) by converting UV–near-infrared (NIR) radiation to the visible region, known as phosphorescence [23–25]. Among transition metals, Zr can suppress electronic recombination reactions and increase electrical conductivity by reducing charge carrier extraction and electron trap-state density. Zr–TiO2 nanofibers were found to prevent electron recombination and increase the power conversion efficiency (PCE) to 6.72%. Additionally, Ju et al. [26] synthesized a DSSC based on Zr–TiO2 nanowires that achieved an efficiency of 9.93%, compared to only pure TiO2 nanowires without Zr doping.
Xu et al. [23] prepared La-doped TiO2 photocatalysts using the sol–gel process. They investigated the effects of La on the structure, surface chemical state, and photocatalytic activity of the catalysts. The Zr–TiO2 system based on the surfactant-assisted sol–gel synthesis method was studied by Kitiyanan et al. [27] to improve DSSC efficiency. By adding a small amount of zirconium dioxide into nanostructured titanium dioxide, the structure of the TiO2–ZrO2 mixed oxide maintained the anatase type of titanium dioxide. The addition of 5% ZrO2 adjusted the band gap and surface area, increasing the open-circuit voltage (VOC) by 4% and short-circuit current density (JSC) by 11%, respectively, compared to a titanium dioxide electrode-based DSSC. These increases enhanced the PCE by up to 17% [27]. ZrO2 surface-modified Zn/TiO2 composite film was used as a photoanode (PA) in DSSCs and compared to an unmodified zinc oxide/titanium dioxide DSSC. The DSSC exhibited VOC of 0.87 V, JSC of 13.6 mA/cm2, fill factor (FF) of 0.65, and an efficiency of ~6.97% under simulated AM1.5 solar irradiation [28].
A hydrothermal method was used for La:TiO2 preparation facilitated by TiO2 particles adsorbing lanthanide ions in a hydrosol. The DSSC fabricated using 0.05 g La: TiO2 achieved a PCE of 7.02%, representing an efficiency improvement of 10.36% compared to DSSCs made with pure TiO2 [29]. TiO2 was doped with La, Mg, Ca, and Al at respective molar contents of 0.5%. The doped TiO2 and TiO2 powders were prepared using a sol–gel method. The DSSC based on Mg–La co-doped TiO2 had the highest efficiency of around 6.6%, while the DSSC based on Al–La co-doped TiO2 had the lowest efficiency [30].
TiO2 and La–TiO2 were synthesized via chemical hydrolysis [31]. It was found that by increasing the La concentration, the PCE of 3% La–TiO2 DSSC gave a better efficiency of 0.85% compared to pure TiO2 NPs.
An effective strategy to synthesize ZrO2 and graphene oxide (GO)-coated TiO2 nanofibers with low axial ratio and anatase structure involved electrospinning and hydrothermal processing. The DSSC using these nanofibers demonstrated notable performance with JSC, VOC, FF, and η of 10.78 mA/cm2, 0.73 V, 0.647, and 5.09%, respectively [32].
La2O3-modified TiO2 nanoporous PAs were fabricated for DSSCs using an organic La solution and the dip-coating method. This resulted in a dramatic boost in the PCE of the La2O3- modified DSSC to 9.67% compared to 6.84% for the original DSSCs [33].
The study by Toraya et al. [34] aimed to enhance DSSCs by replacing pure TiO2 with a 70% TiO2–30% MgO composite, prepared via spin-coating sol–gel method and calcined at 400°C for 1 hour. Structural [X-ray diffraction (XRD) and scanning electron microscopy] and optical characterizations were conducted to assess the effects of Mg doping. Another study by Ju et al. [26] focused on doping TiO2 with Cu and Zr using the sol–gel method [21, 35, 36], which extended light absorption into the visible region and improved electrical conductivity. This Cu and Zr doping increased electron generation and flow, boosting the efficiency of DSSCs by up to 3.28%.
This doping strategy broadened the light absorption spectrum of TiO2 into the visible range, resulting in increased electron generation and improved electrical conductivity. The incorporation of Cu and Zr into the photoelectrode significantly enhanced electron generation and flow within TiO2, leading to an increase in the DSSC efficiency.
This study aims to investigate the impact of both Mg and La doping on the performance of DSSCs using TiO2 and ZrO2 as PAs. The aim is to advance the microstructural and optical properties of TiO2(98%)–ZrO2(2%) PAs fabricated through a spin-coating sol–gel method followed by calcination. The study investigates various doping combinations and concentrations to enhance the efficiency of DSSCs. The paper is organized into four sections. Section 2 details the experimental procedures, including the chemicals used, the preparation of the PAs and counter electrodes, the assembly of the DSSCs, and the measurements and characterization techniques employed. The results obtained from the synthesized films are presented in Section 3, while Section 4 concludes the study.
2. Experimental work
2.1 Chemicals
The chemicals used to prepare the TiO2(98%)−ZrO2(2%) (TZ), Mg-doped TZ (TZM), and La-doped TZ (TZL) thin films were titanium isopropoxide (TIP) [Ti(OCH(CH3)2)4], zirconium nitrate [ZrO(NO3)2.xH2O], lanthanum nitrate hexahydrate [La(NO3)3.6H2O], and magnesium nitrate hexahydrate [Mg(NO3)3.6H2O], all from Solaronix Company. Acetylacetone (C5H8O2), deionized (DI) water, sulfuric acid (H2SO4), and distilled water (H2O) were employed as solvents. Citric acid (C6H8O7) was utilized as a catalyst from Merck Company. Materials used for counter electrode preparation included sodium nitrate (NaNO3) from Kemiou Chemical Reagent Ltd. (Tianjin); graphite, cobalt nitride [CO(NO3)2.6H2O], and thiourea [CS(NH2)2], all from Sigma Aldrich Company; and potassium permanganate (KMnO4) from Merck Company. The dye used was N719 (Ruthenizer 535 bis-TBA) from Solaronix Company. Potassium iodate (KI) and iodine-127 (I2), sourced from ElNasr Pharmaceutical Chemical Company, were used for electrolyte preparation.
2.2 PA preparation
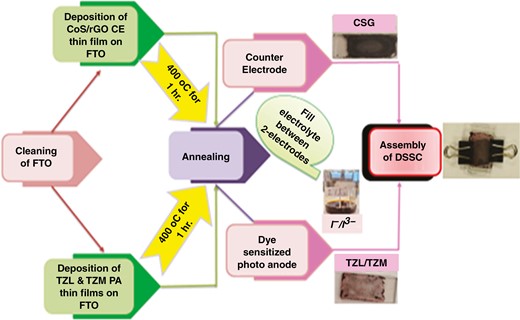
Thin films of TiO2(98%)−ZrO2(2%) (TZ), Mg-doped TZ (TZM), and La-doped TZ (TZL) were prepared using the sol–gel spin-coating method on a glass substrate, as depicted in Fig. 1. Firstly, the substrates were cleaned at 60°C for 15 minutes in acetone and ethanol, ultrasonically, and then rinsed in distilled water. TiO2 was prepared by dissolving TIP [Ti(OCH(CH3)2)4] in 15 ml of acetylacetone (C5H8O2), along with a mixture of distilled water (H2O) and citric acid (C6H8O7) as a catalyst.
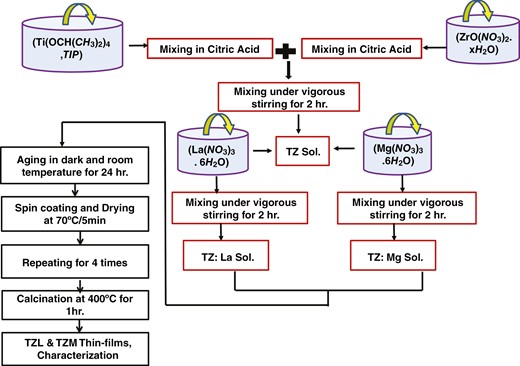
Sol–gel preparation process of TZ, TZM, and TZL thin films.
The TZ precursor was prepared by adding 2% zirconia nitrate [ZrO(NO3)2.xH2O] dissolved in citric acid. The mixture was then stirred at room temperature for 2 hours. To produce different atomic ratios (0.4%, 0.8%, and 1.2%) of Mg-doped TZ films, appropriate amounts of magnesium nitrate hexahydrate [Mg(NO3)3.6H2O] were added, and the mixtures were stirred at room temperature for 2 hours. The resulting thin films were named TZM4, TZM8, and TZM12. For the La-doped TZ solution, lanthanum nitrate hexahydrate [La(NO3)3.6H2O] was added to the prepared solution to obtain the required doping concentrations of 0.4%, 0.8%, and 1.2% La-doped TZ, and the mixtures were stirred at room temperature for 2 hours.
The thin films were named as TZL4, TZL8, and TZL12. All the films were coated at 3000 rpm for 30 seconds to form TZ, TZM, and TZL thin films. This process was repeated four times to achieve a substantial coating thickness. After each layer was deposited, the film was dried at 70°C for 5 minutes. Finally, the resulting films were annealed at 400°C for 1 hour.
2.3 Counter electrode preparation
GO was synthesized using the modified Hummers method described by Mohamedy et al. [37] and Zaaba et al. [38]. Briefly, 5 g of graphite and 2.5 g of sodium nitrate (NaNO3) were added to 115 ml of concentrated sulfuric acid (H2SO4) and stirred for 1 hour in an ice bath. Potassium permanganate (KMnO4) was then slowly added to the mixture. DI water was added slowly to terminate the reaction. Subsequently, 30% hydrogen peroxide (H2O2) was added dropwise to stop the reaction. An excess amount of DI water was added to the solution to obtain the final GO. Thermal reduction was then used to obtain the reduced GO (rGO) thin film. To prepare cobalt sulfide-doped GO (CSG) solution, 3 g of dehydrated GO powder was ultrasonically dispersed in 1 L of DI water for 2 hours to achieve extensive exfoliation of GO. For the synthesis of CSG, 50 mg of the GO suspension was ultrasonically dispersed in 100 ml of DI water to form a clear suspension. Then, 8.5 mmol of cobalt nitrate hexahydrate [CO(NO3)2.6H2O] and 17 mmol of thiourea [CS(NH2)2] were dissolved into the above suspension. The drop-coating method was employed to deposit films of the desired thickness for the counter electrode. Finally, the films were sintered at 400°C for 2 hours to obtain the required thickness.
2.4 DSSC assembling
The nanostructured TZM and TZL films grown on a fluorine-doped tin oxide (FTO) substrate were soaked in a dye solution containing the N719 sensitizer for 24 hours to allow sufficient adsorption of the dye. The PA was then rinsed with water to remove any excess dye molecules that were not fully adsorbed. The PA was assembled opposite the CSG/FTO counter electrode in a DSSC, such that the conductive sides of the two electrodes face each other. An iodide/triiodide redox electrolyte was prepared by dissolving 2 g of iodine crystals and 2 g of potassium iodate in 30 ml of distilled water. The solution was vigorously stirred for 30 minutes. The prepared electrolyte was covered with foil to prevent evaporation, as it is volatile, and left to equilibrate. To fill the cell, the electrolyte was introduced between the electrodes, and the device was sealed on two sides using tape.
2.5 Characterization measurements
The XRD patterns of the promising sensitized thin films were obtained using a Bruker D8 diffractometer from Germany equipped with a CuKα (λ = 1.54 Å) radiation source. The measurements were carried out in the 2θ range of 10°–80° at an operating voltage of 40 kV and a current of 40 mA. The structure of the proposed PA was analyzed using a transmission electron microscope (TEM) (JEOL JEM-2100Plus) to capture highly detailed images. The optical properties of the film were measured using a Shimadzu-2540 UV–VIS–NIR spectrophotometer in the wavelength range of 300–1000 nm. A Keithley 4200 source-measure unit was used to measure the resistance of the prepared thin films and to obtain the current density–voltage (J–V) characteristics of the DSSCs.
3. Results and discussion
3.1 Transmission electron microscopy
We used TEM measurements to examine the structure of the prepared nanocomposite. Figure 2a presents a TEM image of pure TZ NPs, showing that they have a consistent spherical shape with minimal aggregation. The particle sizes ranged from 7.23 to 36.9 nm, with an average size of approximately 23.05 nm.
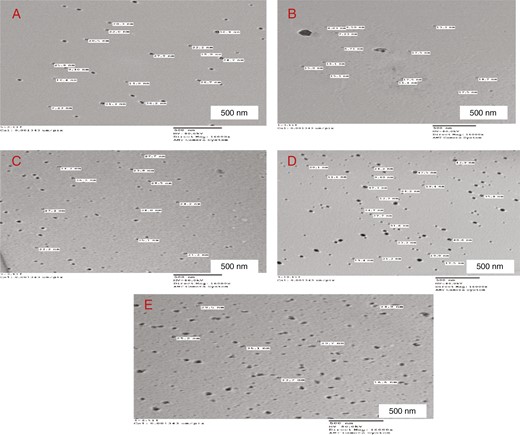
High-resolution TEM images of (a) TZ, (b) TZL4, (c) TZL8, (d) TZL12, and (e) TZM4.
As shown in Fig. 2b, the TZL4 NPs also exhibit a spherical morphology without significant aggregation. Here, the mean particle sizes ranged from 4.03 to 18.7 nm, with an average size of around 13.4 nm. Next, in Fig. 2c, we see the TEM image of the TZL8 NPs, again showing a similar spherical morphology without significant aggregation. The mean particle sizes ranged from 21.2 to 38 nm, with an average size of about 27.825 nm.
The spherical morphology observed in the TEM images indicates uniformity in the synthesis process, which is crucial for achieving consistent optical and electrical properties across the PA. A uniform morphology can cause better electron transport and reduced defects and recombination.
Figure 2d shows the TEM image of the TZL12 NPs, displaying a similar spherical morphology without significant aggregation. The mean particle sizes fell within the range of 9.4 to 47.5 nm, and the average size was about 26.05 nm.
Figure 2e shows an image of the TZM4 NPs, which exhibit a spherical shape without significant aggregation. The average particle sizes ranged from 16.6 to 36.1 nm, with an approximate mean size of 29.38 nm. Moreover, upon introducing Mg doping, we observed increased aggregation of some nanocrystallites compared to the pure TZ NPs.
3.2. XRD analysis
Figure 3 shows the XRD patterns of TZ, TZL4, TZL12, TZM4, TZM8, and TZM12 samples. The TZ sample exhibited a weak peak corresponding to the (121) plane of brookite appearing at 2θ = 31.2°. Upon doping with Mg and La, a broad peak of the anatase phase emerged at 2θ ~ 25° assigned to the (101) peak with a significant increase in the intensity of the brookite (121) phase. In the XRD patterns of samples TZM12 and TZL12, an additional peak was observed at 2θ = 65°. This additional peak was attributed to the (204) lattice plane, indicative of the anatase phase. The crystalline structure changed from brookite to a brookite–anatase phase. From the obtained XRD patterns of La- and Mg-doped TZ NPs, changes in the broadening and intensity of the peaks were conspicuous. The increasing diffraction peak intensity of the La- and Mg-doped samples revealed that the crystallinity of TZM and TZL NPs was higher than that of TZ.
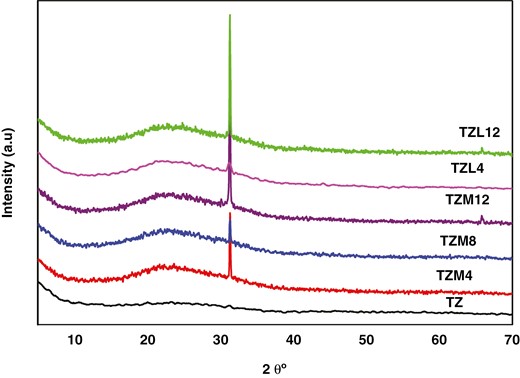
XRD patterns of TZ, TZL, and TZM thin films.
Also, the irregular increase in grain size with La and Mg concentrations indicated a change in the degree of crystallization of these samples. Moreover, the XRD analysis revealed no evidence of secondary or impurity-related peaks for any of the doped TZ samples.
The crystallite sizes were determined by the Scherrer equation at an intense peak located at 2θ = 31.20°. The XRD analysis revealed that the full width half maximum (FWHM) of the most intense diffraction peak (121) of the TZM samples decreased with increasing doping concentration from 0.4% to 1.2%. This can be explained by the fact that the ionic radii of Ti and Mg are 0.68 Å and 0.72 Å, respectively. Since the radius of Ti is very close to the radius of Mg, Ti ions in the lattice structure can be well substituted by Mg ions. The grain sizes of the 0.4% La-doped TZ sample were smaller than those of the TZ sample.
The growth in intensity with doping proposes enhanced crystallinity, which is advantageous for charge transport and global efficiency in the DSSCs. The sharpening of peaks may indicate a reduction in crystallite size, which can enhance the surface area available for dye adsorption.
However, with 1.2% La dopant, the grain size increased. This suggests that higher La incorporation leads to crystal growth of the TZ, resulting in larger crystallite sizes for the doped materials. Based on Scherrer’s equation, the crystallite size (D) was calculated as follows [39, 40]:
To get more data about the structural characteristics of the proposed PA samples, the dislocation density (δ) and the d-space are calculated as follows:
Where D is the crystalline size, β is the XRD peak FWHM appearing at the diffraction angle (θ), and λ is the X-ray wavelength (=1.54056 Å).
Table 1 summarizes the grain size, dislocation density, and d-spacing of TZ, TZL4, and TZL12. The grain size was 21.16 nm for TZ, 14.73 nm for TZL4, and 58.62 nm for TZL12, showing an increase with La incorporation. The dislocation density was 2.23 × 10¹⁵ lines/m2 for the TZ sample and decreased from 4.6 × 10¹⁵ to 2.91 × 10¹⁴ lines/m2 as La concentration increased. The variation of grain size and dislocation density with La increase is irregular. Additionally, the d-spacing values obtained are consistent with previous literature reports. Adding Mg resulted in a diffraction peak at 31.38° and a small peak at 65°, confirming the presence of a plane parallel to the surface in TZM. The intensity corresponding to the characteristic line at 31.38° increased with higher Mg concentrations. A thin (204) peak of TiO2 at 65°, attributed to the anatase phase, was also detected.
Structural parameters of TZ, TZL, and TZM thin films.
| Film name | D (nm) | d-spacing (Å) | δ (lines/m2) |
|---|---|---|---|
| TZ | 21.16003 | 2.863975 | 2.23 × 10¹⁵ |
| TZL4 | 14.73699 | 2.862633 | 4.6 × 10¹⁵ |
| TZL12 | 58.62485 | 2.855267 | 2.91 × 10¹⁴ |
| TZM4 | 59.04705 | 2.853517 | 2.87 × 10¹⁴ |
| TZM8 | 52.57645 | 2.854725 | 3.62 × 10¹⁴ |
| TZM12 | 55.80711 | 2.85751 | 3.21 × 10¹⁴ |
In Table 1, the calculated D for TZ, TZM4, TZM8, and TZM12 samples are 21.16 nm, 59.04 nm, 52.57 nm, and 55.80 nm, respectively. These values increase with the incorporation of Mg. The dislocation density for the TZ sample was 2.23 × 10¹⁵ lines/m2, while for TZM samples, it was in the range of 2.87 × 10¹⁴–3.62 × 10¹⁴ lines/m2. The increase in grain size with Mg incorporation may be due to a decrease in dislocation density, leading to reduced crystal lattice imperfections. Enormous D and small δ indicate enhanced crystallization of the films. Additionally, the obtained d-spacing values are somewhat consistent with the standard value.
Based on the XRD analysis, it was observed that there were no peaks for Mg, La, and their oxides due to the radius of La3+ (0.1061 nm) being much larger than that of the Ti4+ ion (0.0605 nm). As a result, it is difficult for ions of La3+ to replace Ti4+ ions in the TiO2 lattice. It is reasonable to assume that La3+ ions were situated on the surface of TiO2. These La3+ ions function as charge carrier trapping centers on the surface of TiO2, effectively inhibiting the photo-generated recombination of electron–hole pairs and prolonging their lifetime, thereby enhancing photocatalytic activity [41]. As for Mg, the ionic radius of Mg2+ is slightly larger than that of TiO2, leading to minor distortions in the lattice structure of TiO2 upon its entry, leading to a slight expansion of the lattice structure [30].
Figure 4a and b show the grain size and d-spacing variation with Mg and La dopants concentrations. Figure 4a reveals that the highest grain size and minimum d-spacing values are recorded for TZM4 sample. Figure 4b displays that the uppermost grain size and least d-spacing are noted for TZL12 sample.
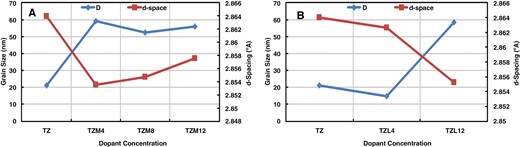
Grain size and d-spacing variation with dopant concentrations: (a) Mg dopant and (b) La dopant.
3.3 Optical properties of synthesis films
The synthesized thin film’s optical parameters were determined using UV–Vis spectrophotometry. The refractive index, extinction coefficient, absorption coefficient, band gap, and electrical conductivity were calculated within the 300–1000 nm wavelength range.
Transmission spectra for TZ, Mg-doped TZ (TZM4, TZM8, TZM12), and La-doped TZ (TZL4, TZL8, TZL12) NP films are shown in Fig. 5a. Transmittance of the TZ sample decreased with increasing Mg content in the TZ composite, achieving approximately 78% optical transparency in the visible range for the TZ. Transmittance values at 550 nm wavelength were around 69.4%, 59.9%, and 67.2% for TZM4, TZM8, and TZM12, respectively.
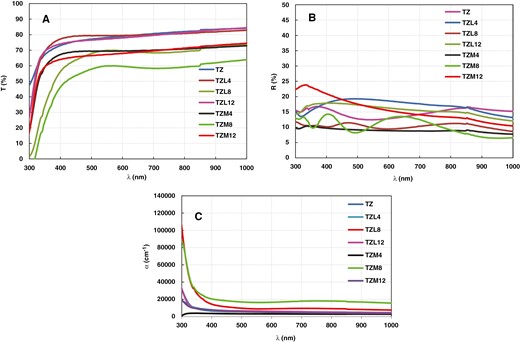
Transmission, reflection, and absorption coefficient of TZ, TZL, and TZM thin films.
For La-doped TZ films, dopant concentration significantly impacted optical transmittance. Notable changes in transmittance were observed. The highest transmittance of around 79.4% was obtained for the TZL4 sample, while the lowest of around 69.9% was measured for the TZL8 sample at 550 nm. Transmission did not exhibit a linear relationship with doping concentration. La-doped TZ thin film transmittance was higher than Mg-doped TZ thin films.
The optical reflectance spectra of TZ, Mg-doped TZ (TZM4, TZM8, TZM12), and La-doped TZ (TZL4, TZL8, TZL12) NP thin films are presented in Fig. 5b. It is evident that the doping concentration mainly affects the optical reflectance of the Mg-doped TZ films; however, the reflectance value does not have a linear relationship with the doping concentration. The reflectance of the La-doped TZL thin films irregularly changes with increasing La content. The reflectance curves for the TZL4 and TZL12 samples are slightly higher than that of the TZ sample, while the reflectance curve of TZL8 is lower than that of TZ. The TZL8 sample has the lowest reflectance value. The absorption coefficient, which quantifies a material’s ability to absorb light, was determined using Lambert’s law [42] for the TZ, TZM4, TZM8, TZM12, TZL4, TZL8, and TZL12 films with the following equation [34, 40]:
Where, t and T are the film’s thickness and film transmittance, respectively.
Absorption coefficient values indicate high absorption at low wavelengths within the UV region, gradually declining at higher wavelengths. All prepared samples demonstrated high absorption coefficients (α > 104/cm), suggesting an increased probability of direct electronic transitions. Furthermore, the absorption coefficient decreased with increasing wavelength, being most prominent at lower wavelengths and tapering off gradually at higher wavelengths as depicted in Fig. 5c.
The Fresnel formula used to calculate refractive index (n) and extinction coefficient (K) is as follows [7, 34]:
Figure 6a shows the K variation with photon wavelength for TZ, TZL (TZL4, TZL8, and TZL12), and TZM (TZM4, TZM8, and TZM12) films. The K values changed from 0.0139 for TZM4 to 0.0716 for TZM8 to 0.0231 for TZM12, while the TZ sample had a value of 0.027 at 550 nm wavelength. All samples also exhibited similar absorption coefficient trends. For the La-doped samples, K values changed from 0.0252 for TZL4 to 0.039 for TZL8 to 0.0282 for TZL12 at 550 nm wavelength.
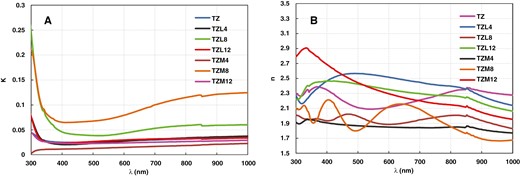
Extinction coefficient and refractive index of TZ, TZL, and TZM thin films.
Figure 6b displays the n dependence on photon wavelength for the TZ, La-doped TZ, and Mg-doped TZ thin films. The n parameter values are between 1.91 for TZM4 and 2.089 for TZM12. For TZL samples, the n parameter ranged from 1.857 for TZL4 to 2.36 for TZL12 at 550 nm wavelength.
The dielectric permittivity has both real (εr) and imaginary (εi) parts. The estimated dielectric function of the deposited nanosized films was calculated using Equations (7) and (8). The εr and εi values were determined using the following formulas [34, 43]:
Figure 7 depicts the εr and εi parts fluctuation of the optical dielectric permittivity of the synthesized TZ, TZL (TZL4, TZL8, and TZL12), and TZM (TZM4, TZM8, and TZM12) thin films over the wavelength range of 300–1000 nm. The εr exhibited a similar trend as the n, while the εi showed a tendency similar to the K regarding the incident wavelength. However, the change in εi and εr values with wavelength were nonlinear.
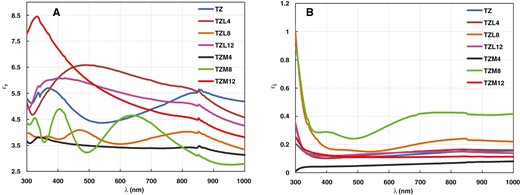
Variation of εi and εr of TZ, TZL, and TZM thin films.
From the transmittance spectra, we calculated the optical band gaps (Eg) of PA films by using the Tauc model, as shown in the following equation [44, 45]:
Where, α is the absorption coefficient, A is a constant, h and ϑ are Planck’s constant and light frequency, respectively, and Eg is band gap energy. The Eg is calculated by considering the direct transition since it is more favorable for anatase TiO2.
We extracted the band gap values by linearly extrapolating plots of the squared direct band gap (αhϑ)2 against photon energy (hϑ) to the x-axis. Figure 8 displays the determined Eg values for TZ, Mg-doped TZ, and La-doped TZ thin films. The computed Eg energies for TZ, TZM4, TZM8, and TZM12 were 3.63, 2.24, 3.75, and 3.8 eV, respectively. The estimated band gap for TZ was around 3.63 eV, aligning with literature reports. Doping with La changes the Eg from 3.65 to 3.8 eV.
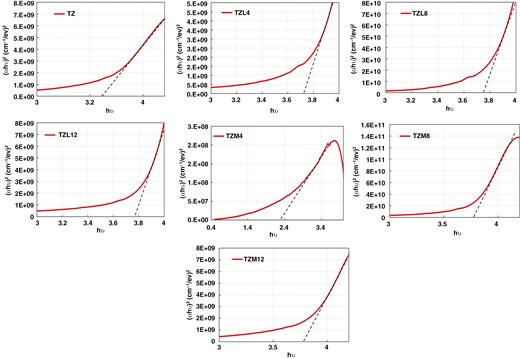
Variations of (αhϑ)2 with hϑ of TZ, TZL, and TZM thin films.
Particularly, the doping of La resulted in a small increment in the band gap from 3.65 to 3.8 eV. This increase can be ascribed to the electronic structure modification of TiO2 owing to La ions’ presence, which can generate additional energy levels in TiO2 band structure [5].
The widened band gap of TZM and TZL films may result from an elevated free electron concentration in the conduction band, known as the Burstein–Moss effect.
We calculate the optical and electrical conductivity of PA thin films using the absorption coefficient (α) as in the following equations [34]:
Where, n and c are the refractive index and the velocity of light, respectively.
Figure 9a and b show how optical conductivity (σopt) and electrical conductivity (σelect), respectively, vary with wavelength for the proposed thin films of TZ, La-doped TZ (TZL4, TZL8, and TZL12), and Mg-doped TZ (TZM4, TZM8, and TZM12). σopt increased as the wavelength decreased to 400 nm, corresponding to higher photon energies. Of all the films, the TZL8 film exhibited the highest optical conductivity. Above 400 nm, σopt did not noticeably change with variations in wavelength. Additionally, the trend in σopt mirrored the trend in the absorption coefficient concerning incident photon wavelength. At short wavelengths, the large σopt attributed to the highest absorbance in that optical region. It decreased as the wavelength increased up to 400 nm, behaving analogously to the absorption coefficient, after which it remained constant.
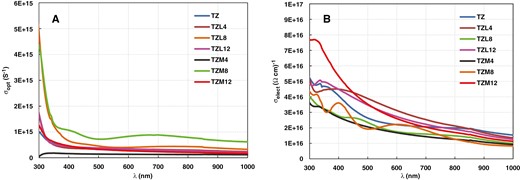
Optical and electrical conductivity variation with wavelength of TZ, TZL, and TZM thin films.
3.4 DSSC performance
Figure 10 shows the J–V curves of DSSC based on TZM4, TZM8, TZM12, TZL4, TZL8, and TZL12 PA. Table 2 lists the PV parameters enclosing the Jsc, Voc, FF, and η. The device fabricated using TZL8 PA exhibited the highest efficiency value of 5.052% because a 0.8% dopant concentration is sufficient to improve the properties of TZ. It is also evident from the results that the efficiency value decreases with increasing dopant concentration due to enhanced charge recombination, diminishing electron transport efficiency. The DSSC based on the 0.8% Mg-doped composite PA achieved the highest η of 4.574%. Overall, the TZL composite PA-based DSSC exhibited superior PV performance.
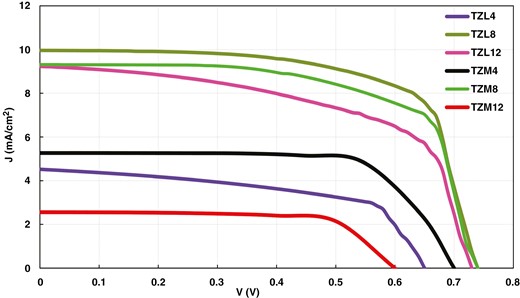
The DSSC J–V characteristics of TZL and TZM.
DSSC electrical parameters at 100 mW/cm2.
| TZL4 | TZL8 | TZL12 | TZM4 | TZM8 | TZM12 | |
|---|---|---|---|---|---|---|
| Voc | 0.65 | 0.74 | 0.73 | 0.7 | 0.74 | 0.60 |
| Jsc | 4.524 | 9.964 | 9.232 | 5.268 | 9.314 | 2.559 |
| FF | 0.569 | 0.685 | 0.578 | 0.719 | 0.663 | 0.699 |
| η | 1.674 | 5.052 | 3.896 | 2.653 | 4.574 | 1.073 |
| TZL4 | TZL8 | TZL12 | TZM4 | TZM8 | TZM12 | |
|---|---|---|---|---|---|---|
| Voc | 0.65 | 0.74 | 0.73 | 0.7 | 0.74 | 0.60 |
| Jsc | 4.524 | 9.964 | 9.232 | 5.268 | 9.314 | 2.559 |
| FF | 0.569 | 0.685 | 0.578 | 0.719 | 0.663 | 0.699 |
| η | 1.674 | 5.052 | 3.896 | 2.653 | 4.574 | 1.073 |
4. Conclusion
The study introduced a new composite material that could enhance the efficiency of DSSCs. Thin films of TZ, La-doped TZ (TZL4, TZL8, and TZL12), and Mg-doped TZ (TZM4, TZM8, and TZM12) were synthesized using the sol–gel method. The properties of these films were then thoroughly investigated as:
When Mg was added to TZ, XRD results indicated the crystalline structure changed from brookite to brookite–anatase phase. From the obtained XRD patterns of La- and Mg-doped TZ NPs, changes in the broadening and intensity of the peaks were conspicuous. The crystallite sizes for TZ, TZM4, TZM8, and TZM12 films were 21.16, 59.04, 52.57, and 55.8 nm, respectively. The transmittance of the films decreased as the concentration of Mg increased. Additionally, the refractive index increased with higher Mg concentration, and the extinction coefficient of TZM8 had the highest value of 0.0716.
On the other hand, when we added La to TZ, a similar effect was observed with Mg. The crystallite size also increased with higher La concentration. Surprisingly, the transmittance initially increased with higher La concentration up to TZL8 and then decreased again with a further increase to TZL12. As the La-doped films, the refractive index increased with higher La concentration, and the extinction coefficient of TZL8 had the highest value of 0.039.
Moreover, the study found that the energy gap widened as the concentrations of Mg and La dopants increased due to the electron carrier concentration exceeding the density of states at the conduction band edge, leading to higher energy absorption.
By comparing the electrical performance of six DSSCs, TZL8 had the best performance with Voc of 0.74 V, Jsc of 9.964 mA/cm2, FF of 0.685, and η of 5.052%.
Author contributions
Doaa M. Atia (Conceptualization [lead], Data curation [equal], Formal analysis [lead], Funding acquisition [lead], Investigation [lead], Methodology [lead], Project administration [lead], Resources [lead], Software [lead], Supervision [lead], Validation [lead], Visualization [lead], Writing—original draft [lead], Writing—review & editing [lead]), Ninet M. Ahmed (Conceptualization [equal], Data curation [equal], Formal analysis [equal], Funding acquisition [equal], Investigation [equal], Methodology [equal], Resources [equal], Writing—original draft [equal], Writing—review & editing [equal]), Ali A. Abou Hammad (Investigation [equal], Validation [equal], Writing—review & editing [equal]), Marwa M. Toraya (Investigation [supporting], Methodology [supporting]), and Amany M. El Nahrawy (Formal analysis [equal], Methodology [equal], Validation [equal], Writing—review & editing [equal])
Conflict of interest statement
The authors declare that they have no known competing financial interests or personal relationships that could have appeared to influence the work reported in this paper.
Funding
None declared.
Data availability
All data generated are included in the paper.
