


Abstract
Rodent models are important research tools for studying the pathophysiology of traumatic brain injury (TBI) and developing new therapeutic interventions for this devastating neurological disorder. However, the failure rate for the translation of drugs from animal testing to human treatments for TBI is 100%. While there are several potential explanations for this, previous clinical trials have relied on extrapolation from preclinical studies for critical design considerations, including drug dose optimization, post-injury drug treatment initiation and duration. Incorporating clinically relevant biomarkers in preclinical studies may provide an opportunity to calibrate preclinical models to identical (or similar) measurements in humans, link to human TBI biomechanics and pathophysiology, and guide therapeutic decisions. To support this translational goal, we conducted a systematic literature review of preclinical TBI studies in rodents measuring blood levels of clinically used GFAP, UCH-L1, NfL, total-Tau (t-Tau) or phosphorylated-Tau (p-Tau) published in PubMed/EMBASE up to 10 April 2024. Although many factors influence clinical TBI outcomes, many of those cannot routinely be assessed in rodent studies (e.g. intracranial pressure monitoring). Thus we focused on blood biomarkers’ temporal trajectories and discuss our findings in the context of the latest clinical TBI biomarker data.
Of 805 original preclinical studies, 74 met the inclusion criteria, with a median quality score of 5 (25th–75th percentiles: 4–7) on the CAMARADES checklist. GFAP was measured in 43 studies, UCH-L1 in 21, NfL in 20, t-Tau in 19 and p-Tau in seven. Data from rodent models indicate that all biomarkers exhibited injury severity-dependent elevations with distinct temporal profiles. GFAP and UCH-L1 peaked within the first day after TBI (30- and 4-fold increases, respectively, in moderate-to-severe TBI versus sham), with the highest levels observed in the contusion TBI model. NfL peaked within days (18-fold increase) and remained elevated up to 6 months post-injury. GFAP and NfL show a pharmacodynamic response in 64.7% and 60%, respectively, of studies evaluating neuroprotective therapies in preclinical models. However, GFAP's rapid decline post-injury may limit its utility for understanding the response to new therapeutics beyond the hyperacute phase after experimental TBI. Furthermore, as in humans, subacute NfL levels inform on chronic white matter loss after TBI. t-Tau and p-Tau levels increased over weeks after TBI (up to 6- and 16-fold, respectively); however, their relationship with underlying neurodegeneration has yet to be addressed. Further investigation into biomarker levels in the subacute and chronic phases after TBI will be needed to fully understand the pathomechanisms underpinning blood biomarkers’ trajectories and select the most suitable experimental model to optimally relate preclinical mechanistic studies to clinical observations in humans. This new approach could accelerate the translation of neuroprotective treatments from laboratory experiments to real-world clinical practices.
Introduction
Traumatic brain injury (TBI) is a leading cause of death and disability worldwide that affects 60 million individuals annually.1 With a global economic burden of approximately 400 billion USD each year1 and 82 000 TBI-related deaths recorded annually in Europe alone,2 the impact of TBI is unmistakably significant. Indeed, TBI is a multifaceted and dynamic neurological condition, with the primary biomechanical injury to the brain triggering a series of secondary pathophysiological events, including neuronal and astroglial damage, microvascular injury, blood–brain barrier (BBB) disruption and persistent inflammation, among others. These secondary injury mechanisms are potential targets for new therapeutic strategies aimed at improving the long-term consequences of TBI.3 A major challenge to the development of therapies for TBI is the heterogeneity across injury severities, complex biomechanics, and patient characteristics, which can affect secondary intracerebral, systemic and long-term recovery processes. Animal models have proven useful to mitigate this inherent heterogeneity, and many drug treatments have been demonstrated to be effective in improving neurologic outcomes in rodents. However, there has been 100% failure in translating promising preclinical drug treatment strategies to the bedside.4 Previous clinical trials directly extrapolated from preclinical studies for critical design decisions, such as optimization of drug dose, timing from injury to the start of therapy and duration of drug treatment in the absence of robust preclinical data that aligns with human TBI biomechanics and disease trajectories. Hence, efforts are now being redirected towards integrating clinically relevant measures into preclinical research to optimally align preclinical models with clinical observations and neuropathology.5,6 The incorporation of these alignment measures will facilitate the transition of new therapeutic strategies developed in robust preclinical models for human TBI and overcome this major block in translation. Protein biomarkers measured in blood have emerged as critical tools to investigate the pathophysiological mechanisms underlying secondary injury post-TBI, classify injury severity,7,8 track injury progression,9-11 guide clinical decision making,12 predict clinical outcomes10,13-16 and monitor the responsiveness to treatment.17,18 Incorporation of blood biomarkers into preclinical models may serve as an important calibration tool for TBI. Preclinical modelling can reveal how different biomarkers associate with distinct intracranial lesion types and ongoing secondary intracranial injuries and will likely inform the selection of the most suitable experimental model that will optimally relate preclinical mechanistic studies with clinical observations. This alignment of clinically relevant biomarkers may enhance the likelihood of effectively translating neuroprotective treatments from laboratory experiments to real-world medical practices.19
Below, we provide a brief introduction to key blood-based biomarkers currently being developed as diagnostic and prognostic indicators of brain injury severity and outcome in humans.
Glial fibrillary acidic protein
GFAP is an intermediate filament III protein expressed by astrocytes that plays a role in the maintenance of both astrocytic skeletal structures and the integrity of the BBB.20 GFAP protein displays regional differences within the brain, with higher levels observed in the hippocampus compared to the cortex in naïve rodent brains.21 Biochemically, GFAP consists of a central alpha-helical rod domain flanked by non-helical N-terminal head and C-terminal tail domains, responsible for filament assembly and stability.22 GFAP protein is increased in astrocytes after experimental TBI typically between 3 and 7 days post-injury.23 Furthermore, the activation of calpain enzymes leads to the conversion of GFAP to its breakdown products (i.e. GBDPs), which display toxic properties.24 This suggests that targeting GFAP may hold therapeutic validity.25,26 After TBI, GFAP is released into the bloodstream through a complex interplay of BBB breakdown and glymphatic clearance.27 In human TBI, GFAP levels in blood are increased at intensive care unit (ICU) admission and are predictive of clinical outcomes at 6 months.28,29 The combination of blood GFAP and UCH-L1 biomarkers is US Food and Drug Administration (FDA) and European Conformity (CE) approved to assist in determining the need for head CT after mild TBI (mTBI),30,31 and GFAP is associated with lesion positivity on neuroimaging scans in mTBI patients.13,32
UCH-L1
UCH-L1 is a 25 kDa cytoplasmic deubiquitinating enzyme primarily found in neuronal cell bodies where it is involved in axonal transport and regulates brain protein metabolism.33 Specifically, UCH-L1 regulates the ubiquitination of proteins marked for degradation via the ubiquitin-proteasome pathway. Dysfunction in the ubiquitin-proteasome pathway worsens secondary injury after TBI.34 Clinical investigations show an early increase in serum UCH-L1 in mild and moderate TBI patients detectable within 1-h post-injury associated with injury severity, CT lesions and neurological intervention.33,35
Neurofilament light
Neurofilaments are structural proteins located in the neuronal cytoplasm that confer essential stability to neurons, particularly in those with large myelinated axons.36 Among the neurofilaments, NfL is the most abundant and soluble constituent, and circulating NfL levels remain low under physiological conditions.37 Following a TBI, the biomechanical forces involved lead to significant axonal injury due to white matter tracts being highly susceptible to mechanical stress.30,38 Secondary injury can also lead to progressive and exacerbated axonal damage.39 Following acute axonal injury and/or chronic neurodegeneration, NfL is released into the interstitial fluid, which communicates freely with the CSF and the bloodstream when the BBB is damaged. NfL is an established blood biomarker of axonal injury in several neurodegenerative conditions, including TBI.10,40,41 Notably, clinical investigations in moderate-to-severe TBI have documented a distinct sub-acute peak in plasmatic NfL levels, which remains persistently elevated up to 5 years post-injury in humans.10,17,42
Total- and phosphorylated-Tau
Tau, a microtubule-associated protein found mainly in axons, plays a critical role in maintaining neuronal cytoskeletal structure. In its phosphorylated form, Tau regulates cellular function.43 However, aberrant post-translational modifications, misfolding, and the assembly of Tau into filaments destabilizes microtubules, affects axonal transport and disrupts neuronal function. p-Tau is implicated in the pathogenesis of Alzheimer's disease and other tauopathies. It contributes to chronic neurodegeneration in TBI,44 including chronic traumatic encephalopathy.45 p-Tau epitopes have been identified and validated in blood as biomarkers, with p-Tau231 and p-Tau217 plasma levels being associated with early cerebral amyloid-β (Aβ) changes in patients with Alzheimer's disease.46 The plasma p-Tau:t-Tau ratio has higher diagnostic and prognostic accuracy over t-Tau levels for acute TBI, and there is a sustained elevation—up to 1-year post-injury—among moderate-to-severe TBI patients.47-49
Here, we performed a systematic review of preclinical TBI studies in rodents, measuring blood protein biomarkers that are widely used in clinical studies. We focused on circulating protein biomarkers of TBI, including GFAP, UCH-L1, NfL, t-Tau and p-Tau (Fig. 1). We examine the kinetics of the preclinical biomarkers across multiple TBI models that reflect distinct pathomechanisms of injury and following varying degrees of injury severity to understand their potential to inform on secondary injury evolution and guide treatment strategies for TBI. Finally, we address how blood-based biomarker trajectories can be used to calibrate pathophysiological mechanisms in rodent TBI models with human disease, thus enhancing bidirectional translational research in the field.
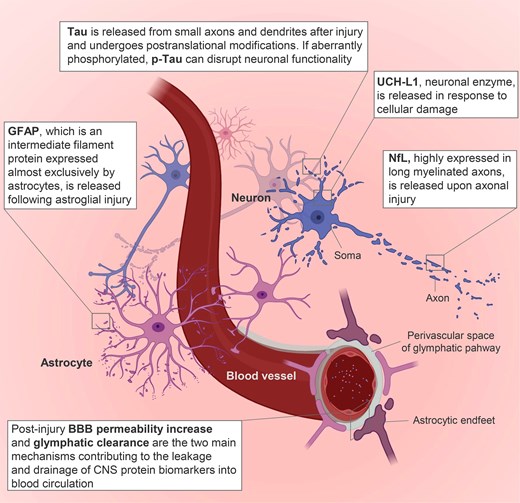
Key protein biomarkers and pathobiological changes associated with traumatic brain injury. BBB = blood–brain barrier; p-Tau = phosphorylated Tau. Image generated using Biorender.
Methods
This study was pre-registered on the International Prospective Register of Systematic Reviews (PROSPERO)—identification number: CRD42023423859 (https://www.crd.york.ac.uk/prospero/display_record.php?RecordID=423859).
Search strategy and data extraction
PubMed/EMBASE was searched for articles in English without date restriction up to 10th April 2024. The search strategy used was: [(rat) OR (mouse) OR (rodent)] AND [(serum) OR (plasma) OR (blood)] AND [(traumatic brain injury) OR (TBI) OR (neurotrauma)] AND [(GFAP) OR (glial fibrillary acidic protein) OR (UCHL1) OR (UCH-L1) OR (NFL) OR (NF-L) OR (Neurofilament) OR (TAU)]. No filters were applied to PubMed search, while for the Embase search we directly excluded conference abstracts, reviews and chapters with the ‘publication types’ filter. We included all relevant preclinical rodent studies assessing at least one of the five main blood biomarkers identified (GFAP, UCH-L1, NfL, t-Tau and p-Tau). The screening of titles, abstracts and full text articles and data extraction was performed by three independent reviewers (F.M., I.L. and E.M.) and any disagreement was discussed and resolved by a fourth independent reviewer (F.P.). Duplicates, reviews, studies assessing other or non-blood-based biomarkers and studies investigating biomarkers not in TBI were excluded. Data extraction sought to obtain information on the TBI model type and severity, age, sex and genetic background of the rodents used, the time points at which the biomarkers were measured, the statistical analyses performed, the main findings in relation to the biomarkers and the approximate biomarkers values with respect to controls. Whenever age was not reported, we used publicly available conversion tables to infer the rodents’ age from their weight.50 To facilitate interpretation, injury severity in each study was categorized as mild (single mild TBI, smTBI), repetitive mild (rmTBI) or moderate-to-severe TBI. This categorization was based on the definitions provided by the authors of each study, rather than predefined parameters. Injury severity emerged as the most frequently reported parameter across the studies, prompting us to adopt this clustering approach for a more coherent analysis. When generating figures and interpreting the data, the time points across studies were grouped as follows: all blood samples collected during the initial 24 h post-injury were designated as ‘hours’; between 24 h and 7 days as ‘days’; between 7 days and 4 weeks as ‘weeks’; and any duration exceeding 1 month was labelled as ‘months’.
The quality of the studies included was assessed by two independent investigators (I.L. and E.M.), based on a checklist from the Collaborative Approach to Meta-Analysis and Review of Animal Data from Experimental Studies (CAMARADES) (quality score range 0–8).51
Results
Our search for preclinical rodent studies investigating blood-based TBI biomarkers yielded 805 studies, of which 74 met eligibility criteria and were included for data extraction. A PRISMA flow diagram outlining each step of our search strategy is presented in Supplementary Fig. 1.
The quality score for each included study was determined using the checklist modified from the CAMARADES (Supplementary Table 1 for complete evaluation and Fig. 2A and B for summary data). The median quality score across the 74 studies was 5 (25th–75th percentile 4–7). Forty-three studies assessed GFAP, 21 UCH-L1, 20 NfL, 19 t-Tau and 7 p-Tau (Fig. 2C), with 28 studies assessing more than one marker at a time. Thirty-seven studies assessed the biomarkers in moderate-to-severe TBI, 13 in smTBI and 9 in rmTBI. Six studies assessed both smTBI and moderate-to-severe injury, one rmTBI and moderate-to-severe injury, seven smTBI and rmTBI, and one study assessed all three injury severities. Most studies investigated TBI in rats (n = 48), 25 in mice, and one in both species (Supplementary Fig. 2A). Fifty-six studies assessed blood biomarkers in male animals, 10 in both males and females, one in females only and seven did not report the sex of the animals used (Supplementary Fig. 2B). Sixty-eight studies used adult rodents (of which for 23 studies age had to be inferred from the animal weight and was not otherwise reported), two paediatric, and two aged (and adult) rodents, while two did not report the age of the rodents used, nor their weight (Supplementary Fig. 2C). Blood biomarkers were assessed in serum (n = 50) or plasma (n = 24). For each biomarker, average trajectories are shown in Fig. 3 and were inferred from individual studies (study count for each time point is shown in the secondary y-axis; trajectories from individual studies are shown in Supplementary Fig. 3). Overall, there was a good alignment between studies with the largest number addressing the acute and subacute times, but more scattered data available for the chronic phase.
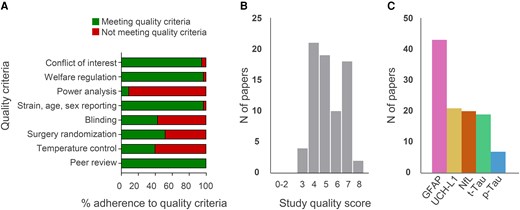
Characteristics of the 74 studies included in the review. Quality score (A), adherence to quality score criteria by the Collaborative Approach to Meta-Analysis and Review of Animal Data from Experimental Studies (CAMARADES) checklist (B) and number of papers investigating each biomarker (C). p-Tau = phosphorylated Tau.
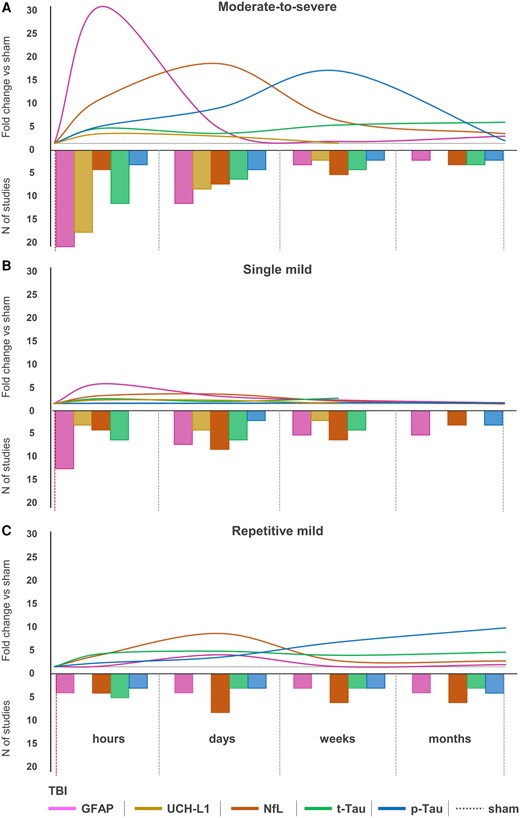
Biomarkers’ trajectories in experimental traumatic brain injury. Average trajectories of biomarkers (primary y-axis) in the hours, days, weeks and months following moderate-to-severe injury (A), single mild traumatic brain injury (smTBI) (B) or repetitive mild TBI (rmTBI) (C). On the secondary y-axis are represented the number of studies assessing each biomarker at the time points of interest and used to infer fold-changes. p-Tau = phosphorylated Tau; t-Tau = total Tau.
Seventeen studies investigated changes in the biomarker levels after interventions (Table 1). The techniques used for biomarkers’ measurement varied widely and are schematically represented in Supplementary Fig. 2D, with ELISA being the most widely used technique to quantify protein biomarker levels (54%).
Changes in biomarker levels after intervention
| Intervention | Model | Time points | GFAP | UCHL-1 | NfL | Tau | Statistics | Funct.a | Hist.a |
|---|---|---|---|---|---|---|---|---|---|
| Levatiracetam52 | FPI | 2 days, 1 weeks | = | ↓ (2 days) | ↑ | = (t-Tau), ↑ (p-Tau, 2 days) | ANOVA+ROC | = | NA |
| Levatiracetam53 | FPI | 4 h, 1 day | = | = | NA | NA | K-W | + | = |
| CCI | 4 h, 1 day | ↓(1 day) | = | NA | NA | K-W | + | + | |
| PBBI | 4 h, 1 day | = | = | NA | NA | K-W | = | = | |
| Erythropoietin54 | FPI | 4 h, 1 day | = | = | NA | NA | K-W | = | = |
| CCI | 4 h, 1 day | = | = | NA | NA | K-W | = | = | |
| PBBI | 4 h, 1 day | = | = | NA | NA | K-W | = | − | |
| Omega-3+Vitamin D55 | WD | 2 days, 2 weeks, 1 month | = | = | = | = (t-Tau) | ANOVA | = | = |
| Cyclosporin-A56 | FPI | 4 h, 1 day | = | = | NA | NA | K-W | = | = |
| CCI | 4 h, 1 day | = | ↑ (1 day) | NA | NA | K-W | = | = | |
| PBBI | 4 h, 1 day | = | = | NA | NA | K-W | = | = | |
| Cyclosporin A57 | PBBI | 2 h | ↓ | NA | NA | NA | ANOVA | + | NA |
| Glibenclamide58 | FPI | 4 h, 1 day | ↑ (4 h) | = | NA | NA | K-W | + | = |
| CCI | 4 h, 1 day | = | ↑ (4 h) | NA | NA | K-W | = | + | |
| PBBI | 4 h, 1 day | = | = | NA | NA | K-W | = | = | |
| Simvastatin59 | FPI | 4 h, 1 day | = | = | NA | NA | K-W | = | = |
| CCI | 4 h, 1 day | = | = | NA | NA | K-W | = | = | |
| PBBI | 4 h, 1 day | = | = | NA | NA | K-W | = | = | |
| Kollidon VA6460 | FPI | 4 h, 1 day | ↑ (4 h) | = | NA | NA | K-W | − | = |
| CCI | 4 h, 1 day | = | = | NA | NA | K-W | = | = | |
| PBBI | 4 h, 1 day | = | = | NA | NA | K-W | = | = | |
| Nicotinamide61 | FPI | 4 h, 1 day | = | = | NA | NA | K-W | = | = |
| CCI | 4 h, 1 day | = | = | NA | NA | K-W | = | + | |
| PBBI | 4 h, 1 day | ↓ (1 day) | = | NA | NA | K-W | = | = | |
| Aspirin62 | CCI | 4 days | ↓ | ↓ | NA | NA | ANOVA | NA | NA |
| Clopidogrel62 | CCI | 4 days | = | ↓ | NA | NA | ANOVA | NA | NA |
| Aspirin+Clopidogrel62 | CCI | 4 days | ↓ | ↓ | NA | NA | ANOVA | NA | NA |
| Ubiquinol63 | CCI | NA | ↓ | ↓ | NA | NA | M-W | NA | + |
| Etanercept64 | WD | 1 day | = | NA | NA | = | ANOVA | NA | + |
| LiCl64 | WD | 1 day | = | NA | NA | = | ANOVA | NA | + |
| Etanercept+LiCl64 | WD | 1 day | = | NA | NA | = | ANOVA | NA | + |
| Thyroxine65 | WD | 1 day, 3 days, 1 week | ↓(1 day, 3 days, 1 week) | NA | NA | NA | ANOVA | + | + |
| Synaptamide66 | WD (rmTBI) | 1 day, 1 week | ↓(1 day, 1 week) | NA | NA | NA | ANOVA | NA | + |
| Suberoylanilide67 | FPI | 1 week | = | NA | NA | NA | ANOVA | + | NA |
| Curcumin67 | FPI | 1 week | = | NA | NA | NA | – | = | NA |
| Pyrimidine derivative68 | WD | 1 week | ↓ | NA | NA | NA | ANOVA | + | NA |
| LiCl+r-roscovitine69 | CCI (rmTBI) | 1, 10 days and 2, 4, 6, 8, 10, 12 months | NA | NA | NA | =(t-Tau) ↓(p-Tau) | ANOVA | + | NA |
| Hyperoxia70 | BI | 1 day, 3 days | NA | NA | NA | ↓(t-Tau, 1 day) | ANOVA | + | + |
| Turmeric extract71 | WD (rmTBI) | 1 week | NA | NA | NA | ↓(t-Tau) | t-test | NA | NA |
| Aβ1-6A2V(D)72 | CCI | 3 days | NA | NA | ↓ | NA | t-test | + | NA |
| Docosahexaenoic73 | CCI | 1 month | NA | NA | ↓ | NA | ANOVA | + | + |
| Immunocal®74 | CCI (rmTBI) | 3 days | NA | NA | = | NA | ANOVA | + | + |
Differences are versus vehicle traumatic brain injury (TBI) mice. BI = blast injury; CCI = controlled cortical impact; FPI = fluid percussion injury; Funct = functional; Hist = histopathology; K-W = Kruskal–Wallis test; M-W = Mann–Whitney test; NA = not available; p-Tau = phosphorylated Tau; PBBI = penetrating ballistic brain injury; rmTBI = repetitive mild TBI; ROC = receiver operating characteristic; t-Tau = total Tau; WD = weight drop. Treated TBI versus untreated TBI: ↓, reduction; ↑, increase; +, positive effect; −, negative effect; =, no difference.
aDifferences in at least one outcome.
Glial fibrillary acidic protein
Circulating blood GFAP levels were assessed in 43 preclinical TBI studies (Supplementary Table 2). Injury severity was moderate-to-severe TBI in 28, smTBI in 17 and rmTBI in seven studies. Thirty studies performed a longitudinal assessment of GFAP levels after TBI.47,52-61,65,66,75-92
Biomarker kinetics
In moderate-to-severe TBI models, circulating GFAP levels were assessed at ‘hours’ in 19 studies,47,53,54,56-61,64,65,77,79,81,83,86-88,93 at ‘days’ in 10 studies,47,52,57,62,65,67,79,86,88,94 at ‘weeks’ in two studies88,95 and ‘months’ in one study (Fig. 3A).90 One study did not report the time point of GFAP sampling.63 Following moderate-to-severe TBI, GFAP sharply increased within 2 h post-injury,53,54,57,79 peaked at 4–24 h,53,54,57,59-61,83,87 and returned to sham levels at 1 week.52,57,79,88 Only one study reported GFAP levels, which were increased at 2 months post-injury.90 In smTBI models, GFAP was assessed at ‘hours’ by 11 studies,66,75,80,81,84,85,89,92,96-98 at ‘days’ by six studies,55,66,75,80,82,89 at ‘weeks’ by four studies55,75,84,91 and at ‘months’ by four studies (Fig. 3B).75,82,90,91 Following smTBI, GFAP was reported to marginally increase in the ‘hours’ after smTBI,88,92,93,96,97 and then returned to sham values 2–7 days post-injury.76,80,82 There was an exception in one study using a weight drop injury model that reported increased GFAP levels at 1 month post-injury.55 In rmTBI models, GFAP was assessed at ‘hours’ in three studies,76,78,84 at ‘days’ in three studies,68,78,82 at ‘weeks’ in two studies78,84 and at ‘months’ in three studies (Fig. 3C).75,82,90 Following rmTBI, there was a slower increase in blood GFAP levels detected at 1 day post-injury,76 and increased GFAP levels were observed many weeks after rmTBI.68,84,90,99
Associations with outcome measurements
Associations of circulating GFAP with outcomes were tested in five preclinical studies (Supplementary Table 2).52,57,87,93,97 Blood GFAP levels at 4 h post-injury correlated with 24 h motor function impairment, assessed by the composite neuroscore and tissue GBDPs levels on Day 3 post-injury57 and contusion volume/tissue loss at 3 weeks post-injury.87 Blood GFAP levels at 24 h correlated with the biomechanical response to head impact,93 and with the latency on the Morris water maze (MWM) cognitive test at 3 weeks post-injury.87 One study reported no significant association of GFAP with acute recovery of sensorimotor impairment (from 2 to 7 days),52 and one with motor function 30 days after TBI.97
Changes in biomarker levels after intervention
Changes in circulating GFAP levels after intervention were assessed in 17 preclinical studies (Table 1).52-68 Tested therapeutic approaches ranged from lifestyle interventions55,67 to anti-epileptic drugs52,53 to immunomodulatory agents.56,57,64 Of the tested interventions, 10 showed efficacy on either histopathological or behavioural outcomes.53,57,58,61,63-68 Of these, six (levetiracetam, cyclosporin-A, ubiquinol, thyroxine, synaptamide, pyrimidine derivative) also resulted in a significant reduction in GFAP levels,53,57,63,65,66,68 while one induced an increase in GFAP levels.58 Treatment with aspirin and clopidogrel (in combination or alone) resulted in a significant reduction in GFAP levels, although behavioural or histopathological outcomes were not assessed. Thus, the alignment of biomarker changes with other potential effects could not be determined.62 Two treatments resulted in a negative effect on behaviour (kollidon VA64)60 and histopathology (erythropoietin),54 with kollidon increasing GFAP levels. Four treatments (levatiracetam, omega-3+vitamin D, cyclosporin-A, simvastatin) showed no effects on behaviour nor histopathology, or GFAP levels.52,55,56,59 Overall, of the 17 interventional studies where either behavioural or histopathological outcomes were assessed, 10 (64.7%) studies showed an agreement between changes in circulating GFAP levels and histopathological/behavioural outcomes post-treatment (Table 1).
UCH-L1
Circulating blood UCH-L1 was assessed in 21 preclinical TBI studies (Supplementary Table 3). Injury severity was moderate-to-severe TBI in 19 studies and smTBI in three studies. Circulating UCH-L1 levels were not assessed in rodent rmTBI. Fifteen studies performed a longitudinal assessment of UCH-L1.52-61,83,86-89,100-102
Biomarker kinetics
In moderate-to-severe TBI models, circulating UCH-L1 was assessed at ‘hours’ in 16 studies,53,54,56-61,83,86-88,100-103 at ‘days’ in seven studies52,57,62,86,88,100,102 and at ‘weeks’ in one study (Fig. 3A).88 No studies assessed changes in UCH-L1 in the ‘months’ post-injury. One study63 did not report the time point at which UCH-L1 was assessed. Following moderate-to-severe TBI, there was a 2–3-fold increase in circulating UCH-L1 compared to sham levels between 4 and 24 h,54,56-58,60,83,86-88,100,101 and UCH-L1 levels returned back to sham levels by 24 h (Fig. 3A).58,59,61 There were two exceptions and both studies reported increased circulating UCH-L1 levels up to 3 days100 and 7 days57 after injury. In smTBI models, circulating UCH-L1 was assessed at ‘hours’ by two studies,89,100 at ‘days’ by three studies55,89,100 and at ‘weeks’ by one study (Fig. 3B),55 with only minor increases reported.55,89,100
Associations with outcome measurements
Only one study tested the association of UCH-L1 levels with structural damage and cognitive impairments following TBI. There was a correlation between UCH-L1 levels at 4 h and cortical tissue loss at 3 weeks in the fluid percussion injury (FPI) model [but not in controlled cortical impact (CCI) or penetrating ballistic brain injury (PBBI) models] and MWM latency at 3 weeks post-injury in the PBBI model (but not FPI or CCI models).87 A correlation between UCH-L1 2 days after TBI and presence of early seizures up to 2 or 7 days post-injury was reported in a second study.52 (Supplementary Table 3).
Changes in biomarker levels after intervention
Changes in the level of UCH-L1 after interventions were assessed in 11 studies (Table 1).52-56,58-63 Of the tested interventions, four showed efficacy on either histopathological or behavioural outcomes.53,58,61,63 Of these, treatment with ubiquinol reduced circulating UCH-L1 levels,63 while glibenclamide increased them.58 No changes in UCH-L1 were reported for the other tested interventions. Treatment with aspirin and clopidogrel (in combination or alone) resulted in a significant reduction in circulating UCH-L1 levels; however, these studies did not include behavioural or histopathological outcomes, the alignment of biomarker changes with other potential effects cannot be determined.62 Two treatments worsened behavioural function (kollidon VA64)60 or histopathology (erythropoietin),54 without altering UCH-L1 levels. Finally, four interventions (levatiracetam, cyclosporin-A, simvastatin, and omega-3+vitamin D) showed no efficacy on behavioural or histopathological outcomes,53,55,56,59 with levetiracetam reducing UCH-L1 levels, cyclosporin-A increasing UCH-L1 levels, and the remaining treatments having no effects on UCH-L1 levels. Overall, three of the five interventional studies (60%) found an agreement between changes in circulating UCH-L1 levels and histopathological/behavioural outcomes post-treatment (Table 1).
Neurofilament light
Circulating blood NfL was assessed in 20 preclinical TBI studies (Supplementary Table 4). Injury severity was moderate-to-severe TBI in nine studies, smTBI in seven studies, and rmTBI in nine studies. Fifteen studies performed a longitudinal assessment of NfL after injury.10,52,55,70,78,80,104-112
Biomarker kinetics
In moderate-to-severe TBI models, NfL was assessed at ‘hours’ by three studies,70,111,113 at ‘days’ by six,10,52,70,72,106,114 at ‘weeks’ by four10,73,106,111 and at ‘months’ by two (Fig. 3A).106,111 Following moderate-to-severe TBI, NfL increased and peaked at 1–3 days10,70,106,114 with levels remaining elevated up to 6 months after TBI.106 In smTBI models, NfL levels were assessed at ‘hours’ by three studies,80,104,108 at ‘days’ by seven,55,80,104,107,108,110,112 at ‘weeks’ by five55,107,108,110,114 and at ‘months’ by two studies (Fig. 3B).107,110 Following smTBI, NfL peaked between 6 h104 and 3 days108,112 post-injury, with levels remaining elevated at 1 week,107 2 weeks108,112 and even 4 weeks110 after smTBI. NfL levels returned to baseline by 5 weeks.107 In rmTBI models, NfL levels were assessed at ‘hours’ by three studies,78,108,111 at ‘days’ by seven,74,78,107-110,112 at ‘weeks’ by five,78,108,110-112 and at ‘months’ by five studies (Fig. 3C).105,107,109-111 Following rmTBI, there was a delayed peak in NfL levels between 3 days108 and 30 days110 post-injury. NfL levels were reported to return to baseline by 3 months post-injury,107,109,112 with the exception of one study that showed elevated NfL levels at 4 months following a blast injury.105
Associations with outcome measurements
Associations of circulating NfL with outcomes were examined in seven preclinical studies (Supplementary Table 4).10,52,106-109,112 Acute NfL levels were associated with (i) same day hyperactivity in an open field test105 and motor impairment on the beam walk test108,109 after rmTBI, lesion size and sensorimotor impairments (neuroscore) after moderate-to-severe FPI106; (ii) subacute neurological signs of brain injury after rmTBI (including post-impact seizures, motionlessness and forelimb or hindlimb incoordination)112; and (iii) chronic callosal atrophy in the rmTBI and moderate-to-severe CCI models.10,107 Two studies found no association between NfL levels and either chronic memory deficits in the MWM106 or sensorimotor recovery following FPI.52
Changes in biomarker levels after intervention
Changes in circulating NfL levels were assessed in five preclinical drug treatment studies (Table 1).52,55,72-74 Of the tested interventions, three showed efficacy on either histopathological or behavioural outcomes [Aβ1-6A2V(D),72 Immunocal74 and docosahexaenoic acid73]. Of these, Aβ1-6A2V(D) and docosahexaenoic acid treatment also resulted in reduced NfL levels.72,73 Two interventions (levatiracetam52 and omega3+vitamin-D supplemented diet55) demonstrated no therapeutic efficacy on the tested behavioural or histopathological outcomes, with levetiracetam inducing an increase in circulating NfL levels, while the dietary intervention had no effect on NfL levels. Overall, three of the five interventional studies (60%) found an agreement between changes in circulating NfL levels and histopathological/behavioural outcomes post-treatment (Table 1).
Total-Tau and phosphorylated-Tau
Circulating blood t-Tau and p-Tau were assessed in 19 and seven preclinical TBI studies respectively (Supplementary Table 5). For blood t-Tau, injury severity was moderate-to-severe TBI in 11 studies, smTBI in six studies and rmTBI in five studies. For blood p-Tau, injury severity was moderate-to-severe TBI in four studies, smTBI in two studies and rmTBI in four studies. Fifteen studies performed a longitudinal assessment of t-Tau or p-Tau after TBI.47,52,55,69,75,76,82,86,111,115-120
Biomarker kinetics
After moderate-to-severe TBI, circulating t-Tau levels were assessed at ‘hours’ in 10 studies47,64,86,111,113,115,117,120-122 and p-Tau in two (pSer-202)47,120; at ‘days’ in five48,52,86,117,120 and three studies (pSer20247,120 and Thr23152); at ‘weeks’ in three111,115,120 and one study (pSer-202)120; and at ‘months’ in two111,115 and one study (unspecified phosphorylation site),90 respectively (Fig. 3A). The increase in t-Tau was observed within hours of TBI,86,117,121 and its levels remained elevated at weeks post-injury.115,120 For p-Tau, there was a slower increase starting within days of TBI,47,120 with a steady increase over weeks120 and months90 post-injury. In smTBI models, t-Tau was assessed at ‘hours’ in five studies99,116-118,121 and p-Tau in none. t-Tau was assessed at ‘days’ in five studies55,99,116-118 and p-Tau (Thr231) in one study.82 t-Tau was assessed at ‘weeks’ in three studies55,75,118 and p-Tau in none. There were no t-Tau studies at ‘months’, while pTau was assessed in two studies (Thr23182 and unspecified phosphorylation site90) (Fig. 3B). Following smTBI, there was an increase in t-Tau 1–6 h after injury,75,117,121 with values elevated compared to sham at 30 days post-injury.55 There were no changes in p-Tau levels compared to sham after smTBI.82,90 For rmTBI models, t-Tau was assessed at ‘hours’ in four studies69,76,111,119 and p-Tau in two studies (pSer-202).69,119 t-Tau was assessed at ‘days’ in two studies71,119 and p-Tau in two studies (Thr23182 and pSer-202119). t-Tau was assessed at ‘weeks’ in two studies71,119 and p-Tau in two studies (Thr23182 and pSer-202119). t-Tau was assessed at ‘months’ in two studies69,111 and p-Tau in three studies (Thr231,82 unspecified phosphorylation site90 and pSer-20269; Fig. 3C). Following rmTBI, both t-Tau and p-Tau gradually increased over time, from 24 h up to 14 days,76,119 with values persistently elevated up to 1-year post-injury.69
Associations with outcome measurements
Only one preclinical TBI study assessed associations of circulating t-Tau and p-Tau levels with outcomes, focusing on seizures. It reported that early post-traumatic seizures were associated to higher levels of p-Tau at Day 2.52 (Supplementary Table 5).
Changes in biomarker levels after intervention
Changes in t-Tau levels after interventions were assessed in six preclinical studies,52,55,64,69,71,116 with two also assessing p-Tau changes52,69 (Table 1). Of the tested interventions, three (etanercept+lithium chloride,64 hyperoxia,116 lithium chloride+r-roscovitine69) showed efficacy on either histopathological or behavioural outcomes. Of these, hyperoxia and lithium chloride+r-roscovitine also induced a reduction in t-Tau levels, with the latter being tested in a human tau-expressing transgenic mouse model. Intervention with turmeric extract resulted in a significant reduction in t-Tau levels71; however, since no behavioural or histopathological evaluations were performed, the association of these biomarker changes with other potential effects cannot be determined. Two interventions (levetiracetam52 and omega-3+vitamin D diet55) showed no therapeutic efficacy on the tested behavioural or histopathological outcome, with levetiracetam reducing p-Tau 2 days post-injury and omega-3+vitamin D diet not inducing any changes in circulating t-Tau levels. Overall, three of the five interventional studies (60%) found an agreement between alterations in t-Tau or p-Tau levels and histopathological/behavioural outcomes post-treatment (Table 1).
Discussion
The blood-based biomarkers evaluated in this systematic review are all increased after experimental TBI in rodents and show injury-severity dependency. After single mild or moderate-to-severe TBI, GFAP and UCH-L1 peak in the hours after injury, while NfL shows a persistent increase in the days following TBI. There is a delayed increase in t-Tau and p-Tau in the weeks following TBI. The available data in rmTBI models suggest that blood biomarkers levels’ peaks are delayed, pointing to a sensitivity to repeated brain injury. Since these preclinical findings generally parallel what is observed in humans after TBI,30,33,36 we next discuss the main findings for each biomarker and draw connections with existing knowledge from human TBI studies and/or gyrencephalic preclinical models (Box 1 for key points).
The pattern of blood-based biomarkers in preclinical traumatic brain injury (TBI) models mimics what is observed in human TBI but with distinct temporal profiles.
GFAP, UCH-L1, NfL, total-Tau (t-Tau) and phosphorylated-Tau (p-Tau) exhibit injury severity-dependent elevations in preclinical TBI models.
NfL shows significant promise as a pharmacodynamic TBI biomarker.
Comparing human and rodent biomarker trajectories facilitates preclinical TBI model calibration for human TBI outcomes.
TBI biomarker conversion rates between human and rodent studies appear to be unique to each biomarker, suggesting that they depend on specific pathomechanisms.
Incorporation of biomarker trajectories in preclinical research will aid in effectively identifying TBI endophenotypes and predicting outcomes in human TBI.
GFAP
Circulating GFAP levels are sharply increased following moderate-to-severe TBI57 (and modestly after smTBI)80,81,92,93,98 with levels doubling from 2 to 4 h post-injury.57 In contrast, there is a delayed peak occurring at 1 week following rmTBI,68,84,99 which may indicate a dependence of GFAP on the biomechanical load. Acute GFAP levels have been shown to be associated with same-day sensorimotor impairment in both rodent and human TBI.123 Moreover, acute GFAP elevations correlate with long-term outcomes, including contusion volume/tissue loss and latency on the MWM at 3 weeks post-injury.87 Most studies report that circulating GFAP returns to sham levels within 10 days after TBI, which may explain the paucity of preclinical TBI studies examining GFAP levels at chronic time points. However, in TBI patients, while the initial peak in circulating GFAP overlaps with the pattern observed in rodents (Fig. 4), there is a second peak occurring many years after TBI.42 Astrocytic endfeet that support BBB integrity can sustain damage following biomechanical impacts, thereby compromising BBB permeability and facilitating the release of GFAP into the circulation.10 Post-traumatic BBB disruption manifests in a biphasic manner, commencing with acute shear stress/injury to endothelial cells in capillaries and arterioles due to the biomechanical damage, followed by a delayed phase characterized by an increase in transcytosis of plasma proteins, contributing to oedema.124 Of note, a recent study showed that increased astrocytic reactivity was associated with elevated blood GFAP and cognitive impairment, suggesting a link between reactive astrogliosis, GFAP levels and chronic neurodegeneration.125 Additional preclinical studies that include chronic time points are needed to determine whether circulating GFAP also displays a biphasic response in rodents and to understand the distinct contributions of reactive astrocytosis, astrocyte injury and BBB leakage to circulating GFAP levels.
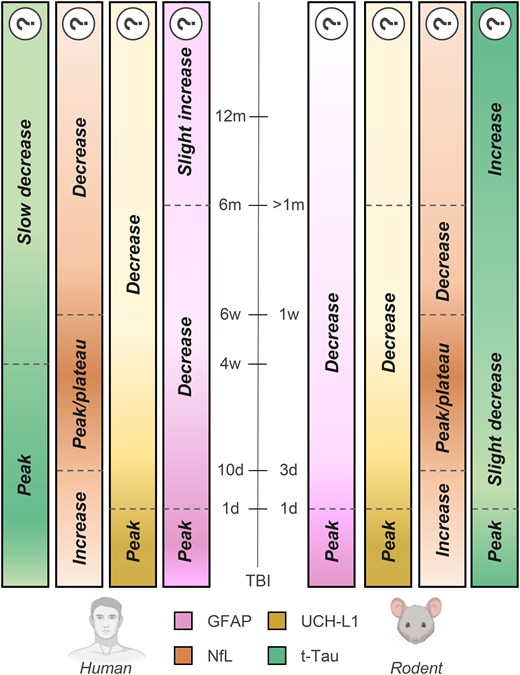
Biomarkers’ temporal dynamics after traumatic brain injury in humans and rodents. Biomarkers’ temporal dynamics after moderate-to-severe traumatic brain injury (TBI) in humans (left) and rodents (right). Question marks indicate scarce data available. ‘Decrease’ means a reduction from the peak values. d = days, w = weeks, m = months; t-Tau = total Tau. Image generated using Biorender.
Due to the outstanding efforts of the Operation Brain Trauma Therapy (OBTT) consortium, circulating GFAP has been widely measured in preclinical TBI intervention trials.126 GFAP levels showed a drug treatment response aligned with histopathological or behavioural outcomes across injury severities and models,57,58,63,65,66,68 with only a few exceptions.53,61,64,67 The lack of a reduction of a given circulating biomarker in these few negative preclinical therapeutic trials is also valuable because all of the interventions that did not have neuroprotective effects as measured by histopathology or behaviour also failed to reduce GFAP levels.52,55,56,59 Levetiracetam, the highest scoring drug in the OBTT studies, was associated with a reduction in post-traumatic GFAP levels only when administered after CCI, but not PBBI53 nor FPI, despite behavioural improvements in the FPI model.52,53 Notably, when tested in a gyrencephalic FPI model, levetiracetam reduced axonal swelling, but there were no changes in post-traumatic GFAP levels.127 Collectively, these data suggest that post-traumatic biomarker changes after interventions depend on the target mechanisms and may be model-dependent.53,127
UCH-L1
Circulating UCH-L1 levels are modestly altered by TBI in rodents, with marginal increases early after injury,54,56-58,60,83,86-88,100,101 or no changes at all,56,77,84,95,96 even after moderate-to-severe TBI. In larger animals such as the micro-pig, UCH-L1 levels do not change following mTBI.127 In addition, the preclinical data indicate that blood UCH-L1 responds weakly to drug treatments, with only 27% of pharmacological studies indicating an agreement between alterations in UCH-L1 levels and histopathological/behavioural outcomes post-treatment.55,59,63 Post-traumatic UCH-L1 responses in rodent models do not mirror the changes observed in TBI patients, where UCH-L1 may have clinical utility in the hyperacute window (although it is outperformed by GFAP in mTBI).12 It will be important to determine whether this discrepancy is attributed to species-specific variations in protein biomarker levels or involves other mechanisms.
NfL
NfL is highly sensitive to TBI in preclinical models, with only three studies reporting no variations after either moderate-to-severe,52 smTBI104 or rmTBI.78 Across multiple models of single TBI, including closed head injury, CCI, penetrating injury, blast injury and CHIMERA, NfL peaks in the days following injury10,70,106,108,112,114,115 with an injury-severity-dependent elevation,10 indicating that axonal injury/damage is a common pathophysiological mechanism across the different preclinical models. Notably, following rmTBI, NfL responds to cumulative injuries107,108,110 and injury intervals,107,112 suggesting that NfL levels could inform on susceptibility to subsequent mild TBIs. The overall temporal pattern of NfL blood levels closely aligns with studies in gyrencephalic swine models,128 and with human data.10,42 However, there is a difference in the time-to-first-peak between rodents (2–3 days),70,106,114 swine (5–10 days)127 and humans (10–21 days),42 possibly related to species-specific differences in protein turnover rates or clearance mechanisms,129 white matter anatomy130 and BBB permeability.131 Peripheral nerve damage132 and physiological ageing133 can also increase NfL levels. However, studies in both rodents114 and humans9 suggest that following moderate-to-severe TBI, the contribution of injured peripheral nerves to NfL blood levels is negligible. Nonetheless, how co-occurring systemic injuries influence circulating NfL in mTBI has not been examined and preclinical models represent a promising setting to dissect the specific contribution of central and peripheral injuries. Circulating NfL levels correlate with same-day hyperactivity,107 sensorimotor impairments108 and lesion volume,106 supporting NfL's value as a marker of injury severity. Subacute NfL levels are also associated with long-term callosal atrophy.10,107 These findings align with observations in injured swine128 and humans,10,42 highlighting the cross-species associations of post-traumatic NfL levels with brain volume loss and white matter abnormalities. The fact that circulating NfL levels in rodents remain elevated for 1–2 weeks is a significant advantage for neurotherapeutic-based preclinical research as it can inform on disease-modifying interventions. Neuroprotection studies have assessed NfL changes after interventions in CCI, FPI and weight drop models. Overall, there was a concordance between TBI outcomes and circulating NfL changes in three out of five studies, with promising indications that NfL levels change after effective interventions when measured in the subacute phase after TBI72,73 or mirror lack of drug treatment efficacy.55 Additional studies are needed to confirm NfL as a pharmacodynamic biomarker across other TBI models and species.
Total and phosphorylated Tau
In preclinical models, t-Tau and p-Tau can be detected in the circulation in the days following TBI. Data in the chronic phase post-injury are scarce, with a progressive increase observed following moderate-to-severe TBI115,120 and rmTBI71,76,119 but not after smTBI.99,116,118,121 Notably, one study reported increased t-Tau and p-Tau levels up to 1 year following rmTBI in transgenic tauopathy-prone TghTau/PS1 mice expressing human tau.69 In TBI patients, circulating t-Tau and p-Tau peak within 30 days and subsequently decline towards baseline levels,10,42,47 before becoming elevated once again at 1 year post-injury, possibly due to ongoing white matter injury and chronic neurodegeneration.42,47 The biomechanical load (either by a single high-intensity injury or a milder repeated event) is critical in triggering chronic neurodegenerative processes characterized by Tau pathology, as shown by post-mortem analyses in mice and humans.134,135 There are few studies investigating the relationship between circulating tau proteins and TBI outcomes, with only one study showing that p-Tau was associated with post-traumatic seizures in rats, thereby limiting the possibility of rigorous comparisons between rodents and humans.52 Preclinical interventional studies found an agreement between neuroprotective effects and a reduction in circulating t-Tau or p-Tau levels in 60% of the cases.69,71,116 Of note, the acute increase in t-Tau and p-Tau levels after TBI is of much lesser magnitude when compared to circulating GFAP or NfL levels, limiting the possibility of observing reliable treatment-induced reductions in blood. Additional studies are needed to assess whether chronic t-Tau and p-Tau levels are associated with the development of neurodegeneration and their potential as biomarkers of disease-modifying interventions.
Biomarker trajectories to provide anchor points and improve validity of preclinical models
The validity of preclinical models hinges on their ability to replicate the evolution of structural and functional abnormalities associated with TBI in humans. However, pathophysiological processes, such as axonal damage, microvascular injury and neuroinflammation, operate on distinct timescales in rodents and humans, and there is no universal ‘conversion rate’ between these processes.130 In Fig. 4, we attempt to align the temporal dynamics of biomarkers between rodents and humans. During the acute phase following injury, there is a similarity in the time-to-first peak for GFAP and UCH-L1 in rodents and humans (within the first 24 h). For NfL, however, the initial peak occurs at 3 days post-injury in rodents and at 10–21 days in humans. Notably, data available for the chronic phase suggest the conversion rate for NfL remains stable over time with the time-to-decrease nearly six times slower in humans (6 weeks) compared to rodents (1 week).10 Total tau's temporal dynamics are less well-characterized in the preclinical setting; thus estimates are represented with a question mark. Conversion rates appear to be unique to each biomarker, likely reflecting distinct pathobiological processes. Acute GFAP increases might reflect damage to astrocytic endfeet enveloping the BBB, thus releasing GFAP directly into the blood10 with no differences in time to peak across species. In contrast, the subacute NfL peak reflects ongoing axonal damage/degeneration with faster kinetics in rodents.
From a methodological perspective, the use of comparable analysis platforms is key to limiting variability between preclinical and clinical data, and obtaining reliable reference ranges for biomarkers. The surge in clinical protein TBI biomarker data has been made possible in large part by the development of ultrasensitive immunoassays that have a high degree of analytical validation, including measures of precision, robustness, dilution linearity, upper and lower limits of detection, and coefficients of variation. Assays used clinically may not always be translatable to rodent models, particularly if the primary antibody used in the clinical assay does not cross-react with its murine counterpart (e.g. GFAP, Tau). Therefore, there is a need to develop additional biomarker assays for use in rodents that have rigorous analytical validation, low volume requirements and sensitivity that parallels the established clinical assays. Furthermore, the use of different antibodies in assays may contribute to the variability in the biomarkers’ levels. However, it is worth noting that individual biomarker trajectories (see Supplementary Fig. 3) from each study align closely with the mean trajectory depicted in Fig. 3. While the variability in measurement tools may affect absolute values, it does not undermine the general conclusions drawn regarding the biological significance of the identified trajectories.
To address these variables and foster greater alignment, collaborative efforts to share preclinical and clinical data and biospecimens are needed. In this context, the establishment of a virtual preclinical biobank within new or existing preclinical and clinical consortia (i.e. the International Initiative for Traumatic Brain Injury Research, InTBIR) would foster centralized, rigorous analyses of preclinical TBI biomarkers across different models and species. It is anticipated that such a research platform would provide the missing anchor points between preclinical and clinical studies, which will greatly enhance the overall quality and translational potential of research in the TBI field.
Knowledge gap 1: biomarkers as measures of mechanistic endophenotypes
In principle, blood biomarker trajectories may identify TBI endophenotypes, inform outcome prediction and identify candidates for targeted interventions more effectively than many bedside physiological parameters.11,136 So far, GFAP, UCH-L1, NfL, tau and S100β have emerged as the top descriptors of TBI disease trajectories in an ICU setting over the first seven post-injury days.11 However, relatively little is known about how these biomarkers relate to pathologic mechanisms (such as axonal injury, inflammation, BBB disruption, microvascular injury). Thus, clinical data underscores the need to investigate biomarker trajectories across TBI models reflecting distinct endophenotypes. Leveraging data from the OBTT initiatives, a unique coordinated multicentre effort using multiple preclinical TBI models with centralized biomarkers analysis, we compared acute GFAP and UCH-L1 levels in models of focal (CCI), penetrating (PBBI) and diffuse (FPI) injury (Fig. 5). Data indicate that biomarker levels were more elevated after CCI than after FPI and PBBI, with the latter showing the least impact on biomarker levels, albeit with similar temporal dynamics across models. Detailed analysis of biomarker cellular origin may inform on distinct injured cell populations and pathogenic pathways dictating disease trajectories.137,138 For example, proteins expressed in membranes of extracellular vesicles (EVs) allow for the identification of the cellular origin of EVs and their cargo139 within the CNS and in the periphery. Clinical data show that exosomal levels of GFAP,140,141 NfL,140-142 UCH-L1143 and t-Tau140,143,144 increase after TBI. Currently, there is a dearth of preclinical data on CNS-specific EV/exosomes and biomarker trajectories in TBI, and future studies are needed to understand the cellular origin of pathobiological TBI biomarkers. Furthermore, the understanding of the pathobiology underlying biomarker changes may also critically inform on study design to assess target engagement and therapeutic effect. Different therapies might require different biomarkers and models. For example, GFAP might be optimal to interrogate what might represent an ‘ICU phase’ in a patient with severe TBI, while for therapies targeting axonal damage and its chronic consequences (e.g. white matter atrophy), NfL might be better suited. Future studies matching TBI endophenotype to preclinical models and biomarker profiles will be essential to inform the design of clinical trial based on TBI endophenotypes.
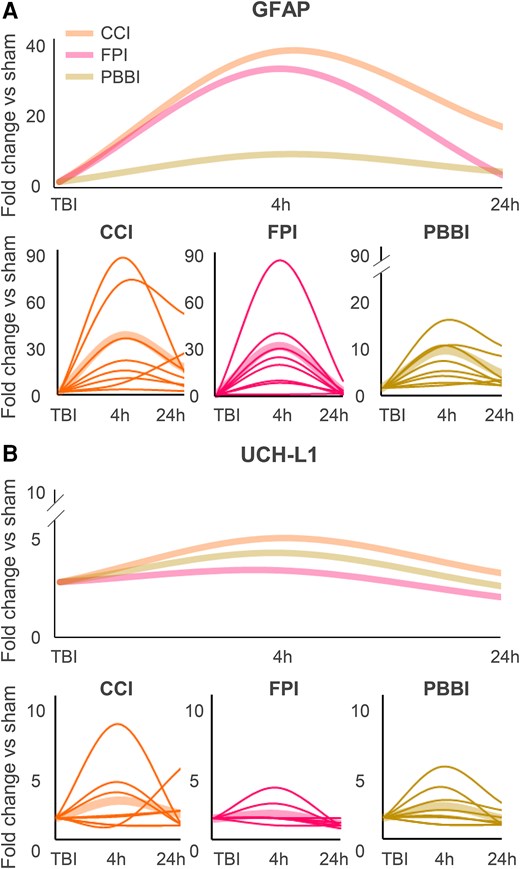
Kinetics of GFAP and UCH-L1 in different traumatic brain injury models. Kinetics of GFAP (A) and UCH-L1 (B) following controlled cortical impact (CCI), fluid percussion injury (FPI) or penetrating ballistic brain injury (PBBI). Data have been extrapolated from Operation Brain Trauma Therapy (OBTT) studies and are depicted as averages (thicker fainter lines, top and bottom) and as individual studies (thinner lines, bottom). h = hours; TBI = traumatic brain injury.
Knowledge gap 2: TBI and time-dependent changes in barrier function
Under physiological conditions, the clearance of brain-derived proteins is regulated by the BBB and blood–CSF barrier, in addition to the meningeal barrier and glymphatic system.145,146 Independent of whether protein clearance occurs directly from the brain to blood or via glymphatic drainage they reach the blood circulation (for a review, see Jessen et al.147). Following TBI, these barriers are dynamically altered,148-150 and TBI can cause glymphatic system dysfunction in both humans and rodents.151 Structural damage to the BBB is known to contribute to the release of proteins into the bloodstream acutely after TBI.149 Recent evidence suggests that blood concentrations of neurodegeneration biomarkers are correlated with measures of glymphatic and meningeal lymphatic functions in a disease and biomarker specific manner.152 Therefore, rigorous preclinical studies on the subacute and chronic phases of TBI are urgently needed to inform on glymphatic dysfunction and neurodegenerative evolution following TBI. An important avenue of future preclinical research will be to understand the contribution of TBI model and time-dependent changes in barrier function and how they relate to blood biomarker alterations after TBI.
Knowledge gap 3: effect of sex and age
Preclinical studies examining the effect of sex and age on the levels and kinetics of blood biomarkers following TBI are currently lacking.153 Most preclinical TBI studies evaluate biomarkers exclusively in male animals, a disparity mirrored in large clinical studies (e.g. Czeiter et al.8 and Bazarian et al.154). Similarly, few studies have examined circulating biomarker changes in geriatric or pediatric TBI models. This is particularly noteworthy considering that the elderly population have the highest frequency of TBI-related hospital admissions and have significantly poorer outcomes compared to young patients with similar injury severity.155 This pattern is mirrored in aged TBI mice.156 Notably, blood NfL levels exhibit an age-related increase in TBI patients, indicating an age-related vulnerability to neuronal damage.155 Determining whether this susceptibility is attributed to age itself, or to age-related comorbidities, presents challenges in the clinical context. Therefore, preclinical models of TBI using aged animals offer an excellent opportunity to disentangle these complex mechanisms and shed light on their interactions. Additionally, in paediatric populations the use of blood-based biomarkers is preferable to avoid CT/MRI scans in vulnerable children with TBI. Thus, preclinical studies using juvenile rodent TBI models could be used to identify paediatric TBI blood-based biomarkers for children and fill this major research gap and unmet clinical need.
Study limitations
Firstly, the panel of biomarkers investigated to date is incomplete. Other biomarker types, such as miRNAs (CE approved)157 and different proteins, merit attention in future research endeavors. Secondly, species-specific variations in biomarker levels were not explicitly addressed. Even though mice and rats share a high degree of homology,158 interspecies differences exist that could alter biomarker kinetics after TBI.159,160 The only study directly assessing rat and mouse biomarker changes after moderate-to-severe TBI showed a faster t-Tau increase in mice compare to rats at one day post-injury, thus compatible with slower kinetics in the latter.120 Importantly BBB permeability changes are closely aligned and overlap in mice and rats.161 It is worth considering that compared to the heterogeneity of TBI patients, changes in blood biomarker levels between mice and rats are relatively modest. Third, our data analysis involved categorizing studies based on injury severity, which ranged from ‘mild’ to ‘moderate-to-severe’, as defined by the authors. It is important to acknowledge that this terminology is overly simplistic. Indeed, efforts are currently underway to establish a more standardized classification system for TBI that offers a more objective representation of injury severity and disease trajectories precisely by incorporating biomarkers (NINDS TBI Classification and Nomenclature Workshop, Jan 2024, NIH, Bethesda, MD). In the context of preclinical studies, maintaining alignment with clinical definitions is crucial, and the utilization of blood biomarkers could prove instrumental in facilitating translation within this domain. Fourth, few studies performed power calculations, and we only retrieved three studies performing power analyses on biomarker-related outcomes.95,101,121 It is likely that many preclinical studies may have been underpowered to evaluate associations with biomarkers. Therefore, future preclinical studies should include sample sizes powered for both traditional outcome measures and blood-based biomarker. Additionally, this review is limited to a focus on the temporal profiles of rodent versus human biomarker trajectories after TBI. Clustering data from the initial 24 h after injury allows dimensionality reduction of a complex scenario, and it may provide a practical approach given the limited nature of available data. Few studies have obtained blood samples hourly from the same patient and estimates for day one after TBI often come from cross-sectional samples taken at various hours after injury. Preclinical studies with high-sampling frequency, at a rate that is 2–3 times faster than the expected temporal changes of the signal studied are warranted but have been hampered by the relatively large volume of blood required for assays, along with ethical constraints on the amount of blood that can be drawn serially from rodents. Advances in the development of multiplex rodent panels requiring lower volumes are anticipated to address this limitation, enabling more detailed longitudinal assessments of blood biomarkers.
Conclusions
Preclinical models generally replicate the pattern and trajectories of blood biomarkers in human TBI. Preclinical biomarkers have the potential to bridge the gap in understanding of fundamental pathobiological mechanisms required to develop new therapeutic interventions for TBI that can be used clinically (see Box 2). GFAP along with NfL hold pharmacodynamic potential, showing changes after therapeutic interventions. However, GFAP rapid kinetic profile may limit its translational utility for guiding interventions beyond the hyperacute phase. Moreover, NfL may be associated with long-term clinically relevant outcomes. By including longitudinal assessment of circulating biomarkers in preclinical TBI drug screening studies, the development pipeline will be improved, increasing the likelihood of translating preclinical discoveries into new therapeutics with clinical efficacy for human TBI.
Develop comparable biomarker assay platforms, including sensitive immunoassays with high analytical validation in both human and rodent models, to minimize variability between preclinical and clinical data (near-term).
Understand biomarkers levels and trajectories during the chronic phase of injury (mid-term).
Define pathophysiological mechanisms underlying biomarker levels and trajectories in traumatic brain injury (TBI) (mid-term).
Investigate the contribution of biological variables, including sex, age, and genetic background, on biomarker trajectories in healthy controls and TBI (mid-term).
Establish a federated preclinical biobank within existing consortia (e.g. the International Initiative for Traumatic Brain Injury Research, InTBIR) to facilitate centralized and rigorous analyses of TBI biomarkers across preclinical models, fostering greater model alignment with clinical TBI and opportunities for translational research in the field (long-term).
Funding
No funding was received towards this work.
Competing interests
N.M. is scientific advisor of Teqcool Inc. and has received speaker honoraria for Balt International Inc.—of no relevance to the present study. V.D.P. declares conflict of interest with TBI biomarkers (sncRNAs) not mentioned in the present paper. K.K.W.W. is a share-holder of Gryphon Bio, Inc. and Owl Therapeutics, and receives patent inventor royalties from the University of Florida.
Supplementary material
Supplementary material is available at Brain online.
References
Author notes
Ilaria Lisi and Federico Moro contributed equally to this work.

