


Abstract
Charcot-Marie-Tooth disease (CMT) is one of the most common and genetically heterogeneous inherited neurological diseases, with more than 130 disease-causing genes. Whole genome sequencing (WGS) has improved diagnosis across genetic diseases, but the diagnostic impact in CMT is yet to be fully reported. We present the diagnostic results from a single specialist inherited neuropathy centre, including the impact of WGS diagnostic testing.
Patients were assessed at our specialist inherited neuropathy centre from 2009 to 2023. Genetic testing was performed using single gene testing, next-generation sequencing targeted panels, research whole exome sequencing and WGS and, latterly, WGS through the UK National Health Service. Variants were assessed using the American College of Medical Genetics and Genomics and Association for Clinical Genomic Science criteria.
Excluding patients with hereditary ATTR amyloidosis, 1515 patients with a clinical diagnosis of CMT and related disorders were recruited. In summary, 621 patients had CMT1 (41.0%), 294 CMT2 (19.4%), 205 intermediate CMT (CMTi, 13.5%), 139 hereditary motor neuropathy (HMN, 9.2%), 93 hereditary sensory neuropathy (HSN, 6.1%), 38 sensory ataxic neuropathy (2.5%), 72 hereditary neuropathy with liability to pressure palsies (HNPP, 4.8%) and 53 ‘complex’ neuropathy (3.5%). Overall, a genetic diagnosis was reached in 76.9% (1165/1515). A diagnosis was most likely in CMT1 (96.8%, 601/621), followed by CMTi (81.0%, 166/205) and then HSN (69.9%, 65/93). Diagnostic rates remained less than 50% in CMT2, HMN and complex neuropathies. The most common genetic diagnosis was PMP22 duplication (CMT1A; 505/1165, 43.3%), then GJB1 (CMTX1; 151/1165, 13.0%), PMP22 deletion (HNPP; 72/1165, 6.2%) and MFN2 (CMT2A; 46/1165, 3.9%). We recruited 233 cases to the UK 100 000 Genomes Project (100KGP), of which 74 (31.8%) achieved a diagnosis; 28 had been otherwise diagnosed since recruitment, leaving a true diagnostic rate of WGS through the 100KGP of 19.7% (46/233). However, almost half of the solved cases (35/74) received a negative report from the study, and the diagnosis was made through our research access to the WGS data. The overall diagnostic uplift of WGS for the entire cohort was 3.5%.
Our diagnostic rate is the highest reported from a single centre and has benefitted from the use of WGS, particularly access to the raw data. However, almost one-quarter of all cases remain unsolved, and a new reference genome and novel technologies will be important to narrow the ‘diagnostic gap’.
Introduction
Charcot-Marie-Tooth disease (CMT) encompasses a spectrum of neuropathies often termed ‘CMT and related disorders', including both demyelinating (CMT1) and axonal (CMT2) forms of CMT, hereditary neuropathy with liability to pressure palsies (HNPP), CMT with intermediate conduction velocities (CMTi), hereditary sensory neuropathy (HSN) and hereditary motor neuropathy (HMN).1-3 Genetically the disease is vastly heterogeneous with more than 130 genes now known to cause CMT and many hundreds more where neuropathy forms part of a broader phenotype, often termed ‘complex neuropathies'.3-5
CMT is the most common inherited neurological disorder with an estimated prevalence ranging from 1 in 2500 to 1 in 10 000.6-9 Currently there is no treatment for any form of CMT, but most potential disease modifying therapies will be gene- and sometimes allele-specific, thus reaching a genetic diagnosis for an individual is essential.10 Genetic testing has evolved with the development of next-generation sequencing (NGS). Initially, causative genes were individually tested with Sanger sequencing. The exception to this is the chromosome 17 1.4 Mbp duplication (or deletion in the case HNPP), containing the gene PMP22, causing CMT1A, by far the most common form of CMT. This has historically been tested with microsatellite analysis, microarrays or multiplex ligation-dependent probe amplification (MLPA); MLPA remains the preferred test for CMT1A. The time- and cost-efficiency of NGS resulted in a shift from sequencing single genes, to targeted NGS gene panels, and more recently with virtual panels applied to whole exome (WES) and whole genome sequencing (WGS). The success of the 100 000 Genomes Project (100KGP)11 in England has resulted in WGS being recently implemented as the routine method for testing for CMT in the National Health Service (NHS),12 through the NHS Genomic Medicine Service (GMS), with variable use in other European countries including in France (for selected patients under 50 years)13 and in Portugal.
Diagnostic rates in CMT have improved with the evolution of genetic testing and in 2015 the largest international registry, the Inherited Neuropathy Consortium (INC), reported a genetic diagnosis in 60.4% of patients.14 Diagnostic rates following the introduction of routine WGS diagnostic testing have not been reported to date, and this study aims to provide the current diagnostic landscape in CMT and the impact of improved diagnostic testing in one UK specialist inherited neuropathy centre.
Materials and methods
Patient selection, classification and clinical measures
Patients were seen at our specialist inherited neuropathy centre between 2009 and 2023. They were recruited to the ethically approved ‘CMT—A Natural History Study’ (ClinicalTrials.gov identifiers NCT01193075, NCT01193088 and NCT01203085). Individual patient consent was obtained for photographs. They were phenotyped by history and clinical assessment, including the validated CMT Examination Score and CMT Neuropathy Score15,16 and neurophysiology. Ancillary investigations were performed as needed including brain, spine or muscle MRI, nerve, muscle or skin biopsy and CSF studies. Patients were deemed to have an inherited neuropathy based on the clinical assessment and either a positive family history of CMT, or in apparently sporadic cases, a phenotype that suggested an inherited neuropathy including a slowly progressive disease course, often with foot deformity, and where other causes of neuropathy had been excluded where appropriate. Patients were excluded from this study if genetic testing was refused or incomplete; a minimum of NGS neuropathy panel testing was needed for inclusion, if undiagnosed. The number of genes included on the panel has varied with time, ranging from 11 to 32 genes for the first phenotype specific panels to 50–80 genes for a more recent ‘CMT’ panel and around 100 genes for the latest iterations of the NHS R78 Hereditary Neuropathy panel. The phenotype categories were defined as follows: CMT1, demyelinating neuropathy with upper limb motor nerve conduction velocities (MNCV) <25 m/s; CMT2, axonal neuropathy with MNCV >45 m/s; CMTi, intermediate conduction slowing with MNCV >25 but <45 m/s (including all GJB1 cases); HSN, sensory neuropathy with presenting features such as ulceration and painless fractures, with absent or minimal motor involvement and excluding sensory ataxic neuropathy (SAN); HMN, motor neuropathy without, or with minimal, sensory involvement on neurophysiology; SAN, isolated SAN and cases where SAN is the predominant phenotype but other non-neuropathy features are present, e.g. cerebellar or vestibular involvement; complex neuropathy, all other cases of neuropathy with at least two non-neuropathy manifestations e.g. significant upper motor neurone (UMN) involvement, intellectual disability, cerebellar ataxia; HNPP, clinical phenotype of recurrent mononeuropathies at compression sites, without alternate acquired cause, with or without underlying neuropathy.
Genetic testing and variant interpretation
Genetic testing was carried out in our NHS diagnostic laboratory with subsequent research testing as needed, and all research findings confirmed with bidirectional Sanger sequencing, or appropriate alternative molecular tests, through our NHS diagnostic laboratory. Consent for WGS included potentially uncertain or unexpected findings, findings with implications to the individual and their wider family, and explicit consent that data could be used for research. Research WES and WGS was conducted using different methods and providers: (i) WGS was performed and analysed through the 100KGP as previously described and if negative, reanalysed by our research team11; (ii) WES and WGS through the Genesis Project Foundation with the use of Illumina TruSeq DNA PCR-Free Library Prep and Novoseq 6000 sequencer or using SureSelect All Exon (Agilent) and HiSeq 2500 sequencer (Illumina) and analysed using the Genesis platform as previously described17; and (iii) WES and WGS was outsourced to Macrogen Europe (Amsterdam, The Netherlands). Libraries were generated using SureSelect All Exon V6 (Agilent, WES) or TruSeq PCR-free (Illumina, WGS). Samples were sequenced on Illumina platforms to a minimum of 30× coverage. Fastq files were aligned to the human reference genome (GRCh38) using bwa-mem v.0.7.17818 GATK v.4.1.9.0. Best practices pipeline19 was implemented for variant calling and calculation of quality control. Following quality control checks, variant calling files (vcf) were annotated using Ensembl Variant Effect Predictor v.10320 to facilitate further variant interpretation and prioritization. Variants were classified to the internationally recognised American College of Medical Genetics and Genomics (ACMG) and Association for Clinical Genomic Science criteria.21,22 Our current genetic testing strategy is illustrated in Fig. 1.
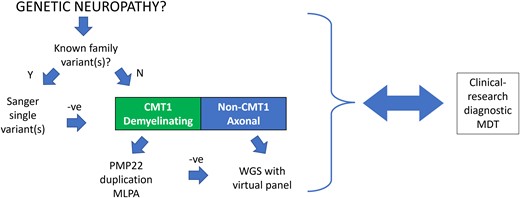
The genetic testing algorithm. CMT1 = Charcot-Marie-Tooth type 1; MDT = multidisciplinary team; MLPA = multiplex ligation-dependent probe amplification; WGS = whole genome sequencing.
Genetic multidisciplinary team
We conducted a monthly multidisciplinary team (MDT) meeting, which included clinicians (neurologists with expertise in inherited neuropathies), researchers, clinical scientists in genetics, a research nurse and clinical allied health professionals. Cases without genetic diagnosis or with unconfirmed candidate variants were discussed to try and obtain a firm diagnosis. Examples of meeting outcomes include requests to assess and genotype patient relatives or provide detailed clinical information to the reporting scientists to potentially upgrade a variant (e.g. invoking the PP4 ACMG criterion; ‘Patient's phenotype or family history highly specific for gene’).21 Other outcomes include suggestions of performing alternate genetic testing, either in the diagnostic laboratory or the research setting, additional investigations, or searching genetic databases for specific variants.
Results
Overall diagnostics
One thousand six hundred and forty-seven patients were seen with inherited neuropathy, which included 132 with hereditary ATTR amyloidosis (not included for analysis in this study), leaving 1515 with CMT and related disorders. The cohort comprised the following individual case numbers: CMT1, 621 (41.0%); CMT2, 294 (19.4%); CMTi, 205 (13.5%); HMN, 139 (9.2%); HSN, 93 (6.1%); SAN, 38 (2.5%); HNPP, 72 (4.8%); and complex neuropathies, 53 (3.5%) (Fig. 2).
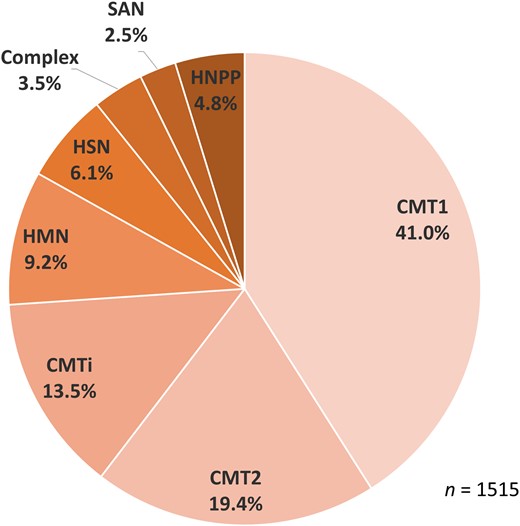
Diagnostic breakdown by phenotype. CMT1/2 = Charcot-Marie-Tooth disease type 1/2; CMT(i) = Charcot-Marie-Tooth disease (intermediate); HMN = hereditary motor neuropathy; HSN = hereditary sensory neuropathy; SAN = sensory ataxic neuropathy.
A genetic diagnosis was made in 1165/1515 (76.9%) of cases (Table 1 and Fig. 3A). When only cases of classical CMT were considered (CMT1, CMT2, CMTi, HSN and HMN), the diagnostic rate increased to 77.1% (1043/1352). The most common diagnosis was PMP22 duplication (PMP22dup, CMT1A; 505 cases, 33.3% of whole cohort, 43.3% of solved cases), followed by GJB1 (CMTX1, 151 cases; 10.0%, 13.0%), PMP22 deletion (PMP22del, HNPP; 72 cases, 4.8%, 6.2%), MFN2 (CMT2A; 46 cases, 3.0%, 3.9%), SPTLC1 (HSN1A; 41 cases, 2.75%, 3,5%) and MPZ (CMT1B/CMT2I/CMT2J/CMTDID; 40 cases, 2.6%, 3.4%). Cases of two newly discovered recessive genes SORD23 (causing distal HMN or CMT2) and RFC124 (causing cerebellar ataxia, neuropathy and vestibular areflexia syndrome, CANVAS) had a growing representation within our cohort, with 16 cases (1.1%, 1.4%) and 23 cases (1.5%, 2.0%), respectively. A full list of the 77 causative genes is available in Supplementary Table 1A and divided by phenotype in accompanying Supplementary Table 1B–H. Diagnostic rates by inheritance pattern are shown in Supplementary Table 2.
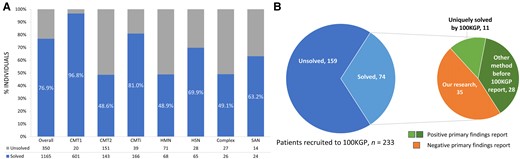
Diagnostic rates and results from the 100 000 genomes project. (A) Solved rate by clinical subtype. (B) Results from patients recruited to 100 000 genomes project; the expanded pie chart to the right denotes how the diagnosis was made. CMT1/2 = Charcot-Marie-Tooth disease type 1/2; CMT(i) = Charcot-Marie-Tooth disease (intermediate); HMN = hereditary motor neuropathy; HSN = hereditary sensory neuropathy; SAN = sensory ataxic neuropathy; 100KGP = 100 000 Genomes Project.
Genetic breakdown of Charcot-Marie-Tooth disease
| Whole cohort | Probands | |||||
|---|---|---|---|---|---|---|
| Diagnosis | n | % total | % solved | n | % total | % solved |
| Total solved | 1165 | 76.9 | 100.0 | 904 | 73.8 | 100.0 |
| PMP22dup | 505 | 33.3 | 43.3 | 388 | 31.7 | 42.9 |
| GJB1 | 151 | 10.0 | 13.0 | 108 | 8.8 | 11.9 |
| PMP22del | 72 | 4.8 | 6.2 | 67 | 5.5 | 7.4 |
| MFN2 | 46 | 3.0 | 3.9 | 34 | 2.8 | 3.8 |
| SPTLC1 | 41 | 2.7 | 3.5 | 19 | 1.6 | 2.1 |
| MPZ | 40 | 2.6 | 3.4 | 30 | 2.4 | 3.3 |
| HSPB1 | 27 | 1.8 | 2.3 | 15 | 1.2 | 1.7 |
| RFC1 | 23 | 1.5 | 2.0 | 20 | 1.6 | 2.2 |
| SH3TC2 | 20 | 1.3 | 1.7 | 20 | 1.6 | 2.2 |
| SORD | 16 | 1.1 | 1.4 | 16 | 1.3 | 1.8 |
| GDAP1 | 15 | 1.0 | 1.3 | 13 | 1.1 | 1.4 |
| SPTLC2 | 13 | 0.9 | 1.1 | 8 | 0.7 | 0.9 |
| NEFL | 10 | 0.7 | 0.9 | 9 | 0.7 | 1.0 |
| NEFH | 9 | 0.6 | 0.8 | 4 | 0.3 | 0.4 |
| GARS | 8 | 0.5 | 0.7 | 6 | 0.5 | 0.7 |
| PMP22pm | 8 | 0.5 | 0.7 | 7 | 0.6 | 0.8 |
| LRSAM1 | 8 | 0.5 | 0.7 | 8 | 0.7 | 0.9 |
| Other | 153 | 10.1 | 13.1 | 132 | 10.8 | 14.6 |
The total number of probands is 1225, total cohort 1515. PMP22dup/del/pm = PMP22 duplication/deletion/point mutation.
Considering just probands, where known, the diagnosis was made through an NHS service laboratory (NHS-SL) single genes test (SGT) in 72.5% (651/898) of cases; mainly MLPA for the PMP22 duplication. NHS-SL NGS panel testing solved 13.7% (123/898), research SGT 5.1% (46/898), research WES 3.6% (32/898) and WGS 5.1% (46/898, mostly research WGS, but two cases through the NHS-GMS WGS) of cases, respectively. Research findings were confirmed through discussion at our MDT and subsequent testing through our diagnostic laboratory.
The 132 patients with ATTR amyloidosis were all diagnosed through targeted single gene Sanger sequencing of TTR, or more recently the hereditary amyloidosis panel, through the NHS National Amyloidosis Centre. This testing was based on clinical suspicion of amyloidosis with or without family history. Asymptomatic, incidental detection of TTR variants is discussed in the section ‘Double trouble’.
Genetic diagnosis by phenotype
A genetic diagnosis is highly likely in Charcot-Marie-Tooth disease type 1
Six hundred and twenty-one patients with CMT1 were seen over the time period (excluding cases of CMT1X due to GJB1 variants, which were classified as CMTi). A genetic diagnosis was obtained in 96.8% (601/621) of cases (Fig. 4A). The majority of these cases had PMP22dup (505 cases, 82.3% of all CMT1 cases, 84.0% of solved CMT1). The diagnostic rate was improved further still in cases of autosomal dominant (AD) CMT1, where 100% (559/559) of cases received a genetic diagnosis. Even when cases of PMP22dup were excluded, the diagnostic rate in CMT1 was still very high at 82.8% (96/116). After PMP22dup, the next most common diagnosis was MPZ (27 cases, 4.3%, 4.5%), followed by biallelic SH3TC2 (CMT4C; 20 cases, 3.2%, 3.3%) and PMP22 point mutations (CMT1E; eight cases, 1.3%, 1.3%). Figure 4D clearly illustrates that nearly 90% (410/467) of CMT1 genetic diagnoses in probands were made through SGT. This reflected the fact that MLPA is still the gold standard for detecting PMP22 copy number variants (CNV) in our diagnostic laboratory. However, in our cohort we unexpectedly detected the PMP22 duplication in three cases through NGS. In one case, a microsatellite analysis had reported normal PMP22 dosage, which was a false negative, and in the other two, PMP22 testing was never performed.25 Two of these cases were only diagnosed through research analysis of the raw WGS data and would otherwise have been missed; this experience has served as a reminder that for CMT1 it is essential to ensure MLPA for PMP22 CNV has been performed, before moving to NGS.
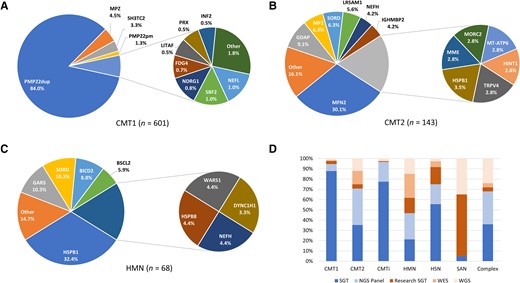
Genetic diagnosis breakdown by phenotype. (A) Charcot-Marie-Tooth disease type 1 (CMT1); (B) CMT2; (C) hereditary motor neuropathy (HMN). (D) How the genetic diagnosis was reached (probands). CMT(i) = Charcot-Marie-Tooth disease (intermediate); HSN = hereditary sensory neuropathy; NGS = next-generation sequencing; PMP22dup = PMP22 duplication; PMP22pm = PMP22 point mutation; SAN = sensory ataxic neuropathy; SGT = single gene test; WES = whole exome sequencing; WGS = whole genome sequencing. Colour scheme in D: blue tones = service laboratory testing, orange tones = research testing; all WGS testing in D is denoted research because only two cases have been diagnosed through the National Health Service WGS.
Axonal Charcot-Marie-Tooth disease remains unsolved in around half of cases
Diagnostic rates in axonal CMT remained significantly lower than CMT1, with the exception of HSN. For CMT2, 48.6% (143/294) were considered solved, for HMN 48.9% (68/139) and for HSN 69.9% (65/93). The breakdown of the most common genes implicated in CMT2 and HMN can be seen in Fig. 4B and C. The axonal forms of CMT had a much more uniform distribution of disease-causing genes. MFN2 (43/143, 30.1%) was the most common diagnosis in CMT2. Of these, only five cases (11.6%) had recessive CMT2A, the rest being AD. The next most common diagnosis was GDAP1 (CMT2K; 9.1%, 13/143, 6/13 recessive), then MPZ and SORD (both 9/143, 9.1%). In HMN, HSPB1 was the most common diagnosis (HMN2B; 22/68, 32.4%), followed by GARS (CMT2D) and SORD (both 7/68, 10.3%). HSN was dominated by the UK founder mutation C133W in SPTLC1 (41/65, 63.1%, which explained our high solved rate for HSN)26 and SPTLC2 (HSN1C; 13/65, 20.0%). The method of genetic diagnosis for probands with HSN overall reflected the prevalence of SPTLC1 C133W in the UK population; many of the diagnoses were made through sequencing exons 5 and 6 of SPTLC1 as SGT (Fig. 4D). Notably, when SPTLC1 cases were excluded, the diagnostic rate in HSN fell to that of the other forms of axonal CMT (24/52, 46.2%). The diagnostic methods for probands with CMT2 and HMN can be seen in Fig. 4D and were more evenly distributed between SGT, NGS panel, WES and WGS due to the more heterogenous genetic make-up compared with CMT1.
Genetic diagnoses in intermediate Charcot-Marie-Tooth disease are rare if CMTX1 is excluded
The diagnostic rate in CMTi was 81.0% (166/205). However, 90.1% (151/166) were due to variants in GJB1 causing CMTX1.27 When this diagnosis was excluded, the diagnostic rate was only 27.8% (15/54), by far the lowest of the common forms of CMT. The most frequent diagnoses after GJB1 were MPZ (CMTDID), AARS1 (both 4/166, 2.4%) and DNM2 (3/166, 1.8%). As with the use of SGT in the diagnosis of PMP22dup and SPTLC1 within their respective phenotype groups, because the phenotype for GJB1 is often characteristic, many of our historical GJB1 proband diagnoses were made through SGT, representing nearly 80% of CMTi diagnoses (93/120) (Fig. 4D).
RFC1 repeat expansions are the commonest cause of sensory ataxic neuropathy
The discovery of RFC1 as a cause of CANVAS, in which the neuropathy is the most common and usually the earliest manifestation,28 has transformed diagnostic rates in sensory ataxic neuropathy (SAN). Twenty of the 22 solved cases (90.9%) had RFC1-CANVAS, and the remaining two cases (9.1%) were due to biallelic variants in PIEZO2. The method of diagnosis in SAN probands reflected the fact that genetic testing for RFC1 repeat expansions (REs) is not yet available in many service laboratories; 19/20 (95.0%) were confirmed through research testing (WGS or SGT, repeat-primed PCR followed by Southern blotting) as having RFC1 REs (Fig. 4D).
The diagnostic rate in complex neuropathy syndromes was 49.1% (26/53) and the most common cause was variants in SACS (autosomal recessive spastic ataxia of Charlevoix-Saguenay, 5/26, 19.2%) then kinesin family genes KIF1A and KIF5A (both 3/26, 11.5%).
Hereditary neuropathy with liability to pressure palsies is caused by variants in PMP22
All cases of clinical HNPP had a confirmed genetic diagnosis (72/72); 95.8% (69/72) due to the 1.4 Mbp deletion in PMP22. The remaining three cases were caused by single nucleotide variants (SNVs) in PMP22, all detected through single gene Sanger sequencing.
Whole genome sequencing enhances diagnostic rates
Through our specialist inherited neuropathy centre, we have diagnosed 53 cases (46 probands) of inherited neuropathy through WGS (100KGP, NHS-GMS WGS and other research WGS), most of which had already undergone extensive previous diagnostic testing. The cohort diagnostic rate excluding these cases was 73.4%, illustrating that WGS has increased diagnostic yield by 3.5% overall. Our formal diagnostic rate in those undergoing WGS as part of the 100KGP study was 31.8% (74/233). However, the diagnosis was reached as a primary finding of the 100KGP in only 39 cases (52.7% of solved cases). Twenty-eight of these had already been solved by alternate methods in the period after enrolment to 100KGP but before release of primary findings (gene panel, 14 cases; research WES, nine cases; SGT, four cases; and whole mitochondrial sequencing, one case), leaving a previously unidentified primary 100KGP finding in 11 cases. The unsolved cases were then discussed in our inherited neuropathy MDT meeting and subsequent in-house research analysis accounted for almost half of the solved cases (35 cases, 47.3%; Fig. 3B). Therefore, a total of 46 cases were given their diagnosis solely through the 100KGP, with a true diagnostic rate of 19.7% (46/233). This emphasises that the full diagnostic power of WGS is seen through research access to sequencing data combined with disease-specific clinical and genomic expertise and access to a dedicated clinical-research-genetic MDT.
Closing the diagnostic gap: lessons from our practice
The diagnostic uplift with improving diagnostic techniques, including WGS, was demonstrated through our diagnostic rate of 76.9% following WGS. Examples below illustrate some specific scenarios where WGS has been particularly useful in making a diagnosis.
Structural variants overlooked
Known disease entities such as CMT1A and spinal muscular atrophy due to deletion of exons 7 and 8 of SMN1 are usually still tested with MLPA because of the relative frequencies of the disease within their phenotype category and the cost efficiency of this test at a single locus. However, structural variants (SVs), rather than SNVs or small insertions or deletions (indels), can be challenging to detect in exome data, and these were also not called in early iterations of WGS analysis, including much of the 100KGP, where the focus was on identifying SNVs. Specific bioinformatic tools are needed to identify SVs in NGS data, each with its benefits and drawbacks. For short-read sequencing, these generally use the read-depth (number of reads at a genomic locus) and properties of the paired-end sequencing (DNA read from both ends of the fragment) to detect SVs. Algorithms that combine approaches to detection, and latterly a combination of algorithms, have the most accurate detection rate, although there is no established gold standard for SV calling in NGS, and variants can still be missed.29-32 Outside of PMP22dup, CNVs are a rare cause of CMT, although the frequency is difficult to estimate. Structural variation has been seen in most of the common causative genes for CMT, including GJB1 (deletion of entire gene),33MFN2 (deletion of exons 7 and 8 acting recessively),34MPZ (whole gene and exon 1 deletion)35 and SH3TC2 (differing exon deletions).36,37 Studies of NGS data in case series of CMT found pathogenic CNVs in 0.2% and 2.0% of exomes and targeted gene sequencing, respectively.38,39
We detected a number of SVs through 100KGP that were not called in the primary findings of the study. Case 1 is a female in her twenties presenting with a rapidly progressive motor syndrome encompassing non-length-dependant neuropathy, upper motor neurone signs and thinning of the corpus callosum on MRI. We detected a novel heterozygous variant c.5372T>A p.(Leu1791*) in SPG11 and in a search for a ‘second hit’ examined the aligned sequence data and found a heterozygous deletion in the gene encompassing exons 31–34. Parental testing confirmed the variants were in trans (Fig. 5A–E). Case 2 was a male in his fifties with an adult-onset motor neuropathy. We detected a heterozygous pathogenic variant c.202C>T p.(Arg68*) in MME, and the raw data revealed a deletion of exons 15 and 16 in MME. These examples illustrate a SV ‘second hit’ that was not called in the 100KGP.
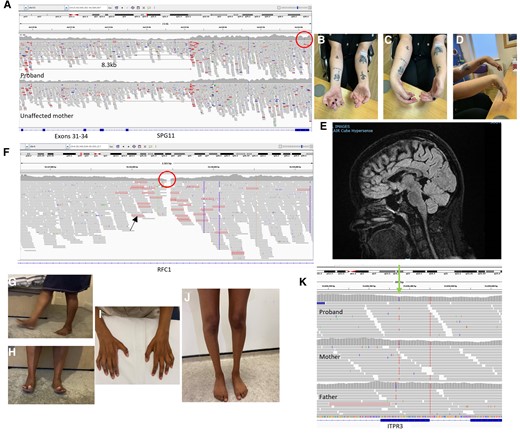
Illustrative cases. (A) Integrative Genomics Viewer (IGV) showing aligned sequence reads for proband and unaffected mother at the SPG11 locus. An 8.3 kb deletion is carried by the proband and mother, point mutation is carried only by the proband (red circle). (B–D) Clinical images of the proband. (E) Sagittal MRI midline slice showing corpus callosum atrophy. (F) IGV showing loss of read depth in intron 2 of RFC1 (red circle). Reads with red outline (black arrow) indicated an unmatched read-pair suggestive of an expansion. (G and H) Clinical images of the asymptomatic mother easily walking and standing on heels. (I and J) Wasting of distal upper and lower limbs in the proband. (K) IGV showing a variant in ITPR3 present in the proband and mother, but absent in the father (green arrow).
Repeat expansions remain challenging to detect in short-read WGS
Many neurological disorders, particularly the ataxias, have a molecular basis in REs.40 Given the phenotypic overlap of many neurogenetic syndromes to include neuropathy, and now reports of predominant neuropathy phenotypes ascribed to REs (e.g. RFC1 CANVAS,41NOTCH2NLC42 and VWA142), genetic testing should ideally be optimized to detect REs. However, one of the main pitfalls of short-read technology is its variable ability to detect—but more importantly to size—REs specifically when the length of the pathogenic expansion is longer than the read length.40 Bioinformatic approaches such as ExpansionHunter,43 when combined with manual inspection, have had promising results when evaluated against PCR-confirmed cases, but this process can be time-consuming and still has its limitations.44 Case 3 is a male in his late fifties with a 10-year history of SAN and unexplained cough. Driven by a suggestive phenotype of CANVAS, a review of the raw WGS data revealed a loss of coverage in intron 2 of RFC1. We have learned that this is highly suggestive of biallelic pathogenic pentanucleotide RFC1 REs causing CANVAS (Fig. 5F). The result was confirmed with repeat-primer PCR and Southern blot showing AAGGG repeats of 1200 and 1570 pentamers.
Beyond the protein coding region
One clear advantage of WGS is the coverage of intronic and intergenic genomic regions, but also more even coverage of the exome, including untranslated regions (UTRs), allowing calling of variants that may have been missed through exome sequencing.45 Deep intronic variants causing CMT are rare, in part because the reporting laboratory often requires functional evidence that mRNA splicing or expression is affected. In the complex neuropathy adult polyglucosan body disease, caused by recessive GBE1 variants, the second most common founder variant in the Ashkenazi Jewish population is a deep intronic variant.46 A deep intronic variant in IGHMBP2 causing a cryptic splice site was recently reported causing CMT2S.47 Case 4 is a family with severe AD CMT1. PMP22 dosage was normal and there were no coding variants in known CMT genes. We detected a 650 bp heterozygous deletion in the 3′UTR of PMP22, at the site of a mature micro-RNA binding site, and the resultant PMP22 transcript levels were found to be elevated in skin biopsy, confirming a novel non-coding variant in a known CMT gene causing CMT1.48
Novel genes and out-of-date panels
The genomics era has brought a very sharp rise in the number of genes attributed to Mendelian disease; in January 2023 alone there were 58 new gene–disease associations registered on the Online Mendelian Inheritance in Man (OMIM) database; OMIM publishes entries to the database on a monthly basis.49 NGS testing relies heavily upon the application of virtual panels to the data, and service laboratory panels must include only genes that are well established to cause disease, to avoid ambiguity and uncertainty for clinicians receiving reports and patients their genetic diagnosis. Groups have attempted to quantify the criteria for gene inclusion,50-52 and based upon these data, for inclusion in an NHS-GMS panel, a gene/variant must be reported in three unrelated families. Even with a very convincing new gene, there is an inevitable delay in the inclusion on panels, particularly if testing is technically challenging, as is the case for SORD and RFC1-CANVAS.23,24 In our practice we regularly review the literature for new causes of CMT and complex neuropathies and add these to our own research virtual panel, which we apply to WGS data in the research environment. We made diagnoses through this method, where the original panel was ‘out-of-date’ in MME, WARS1 and SORD. Case 5 is a male in his twenties with AD CMT1. We re-reviewed the WGS data and found the published variant c.155T>C p.(Ile52Thr) in PMP2.53 Case 6 is a female in her forties with childhood-onset sporadic CMTi. SARS1 (SerRS) was recently reported as a cause of CMT in three families, and we found the de novo c.1187C>T p.(Ser396Phe) seen in the original paper and the fourth case in the literature.54,55
Phenotype expansion
The concept of a gene acting in isolation to cause one disease entity is outdated and the complexity of biological function is reflected in a single gene's ability to cause multiple phenotypes. This has been seen across genetic diseases but the overlap of inherited neuropathy and myopathy,56 hereditary spastic paraplegia,57 mitochondrial disease,58 metabolic disorders59 and complex syndromes4 is an important consideration when reviewing unsolved cases. Case 7 is a family with childhood-onset cataract and adult-onset neuropathy. We found a segregating pathogenic c.358A>G p.(Arg120Gly) variant in CRYAB in three affected family members. The gene typically causes a myofibrillar myopathy; this is the first reported case of neuropathy.60
Continued diagnostic scepticism
Rapid increases in the publication of disease-causing genes naturally results in a small proportion being disproved. It is necessary to keep abreast of updates in the literature and exert caution when attributing disease to a newly described gene or one in which evidence is limited. We previously proposed MARS as a potential cause of late-onset CMT2, but we have since disproved our own hypothesis with non-segregating variants and allele frequency in the population that would not be compatible with the disease.61,62 Case 8 is a family with male proband presenting as equal UMN and lower motor neurone syndrome with teenage onset. His mother had minimal sensory symptoms and signs. We had a working diagnosis of maternally inherited X-linked ATP7A motor-neuropathy due to a novel rare variant c.2158T>G p.(Cys720Gly). The ATP7A phenotype is a motor neuropathy typically with abnormal copper metabolism, skeletal abnormalities and dysautonomia,63,64 although the proband had none of the added features, and the variant was of uncertain significance (VUS). We have since detected a homoplasmic (blood) m.9176T>C p.(Leu217Pro) via WGS in MT-ATP6 in the proband. The mother has a late-onset pure UMN sensory syndrome and is also homoplasmic for the variant in blood. This spectrum of myeloneuropathy is almost identical to the syndrome previously reported with this variant.65 We now believe this to be the cause in this family. It should be noted that NGS has been shown to reliably detect mitochondrial DNA (mtDNA) variants down to a heteroplasmy level of around 10% in blood (providing sufficient read depth),66 but if there is a high suspicion of mitochondrial disease, mtDNA sequencing should be specifically requested.
The ‘unaffected’ relative
Refining the thousands of coding SNVs obtained through WGS can be challenging when clear candidates are not initially forthcoming. The increase in diagnostic yield with the inclusion of relatives is established and allows filtering according to the perceived inheritance pattern. However, particularly when the data are processed through a diagnostic laboratory, variants carried by unaffected relatives will be deprioritized and often dismissed unless there is a very suggestive phenotype. Case 9 is a family whereby the proband, a female in her teens, developed subacute distal upper limb dysfunction on the background of subclinical lower limb involvement. Neurophysiology showed patchy but widespread conduction slowing. Trio WGS was performed with her unaffected parents. As part of an international collaboration, we found the reported variant c.4271 C>T, p.(Thr1424Met) in ITPR3.67 The gene had previously been suggested as causative in three families but was not on the virtual panel.68,69 Critically, it also was carried by the unaffected mother. We assessed her and although in her fifties she had no symptoms or signs of neuropathy, but neurophysiology demonstrated clear widespread conduction slowing, confirming variant segregation (Fig. 5G–K).
Double trouble
The reported proportion of patients with a dual genetic diagnosis, so-called ‘double trouble’, through large WES cohorts ranges from 0.3% to 4.9%.70,71 One consequence of NGS is the identification of (i) a second genetic variant explaining a complex phenotype; (ii) a second but expected genetic diagnosis with an unrelated phenotype; and (iii) an incidental finding of known or unknown significance. The recent discovery that the AR expansion implicated in Kennedy disease is up to 10 times more common than the disease prevalence, explains its detection in our cohort.72 Case 10 is a man in his fifties with CMT2 but atypical features including non-length dependent denervation and bulbar involvement. He has a molecular diagnosis of both SORD-neuropathy and Kennedy's disease. Contrastingly, Case 11 is a man in his thirties with CMT1 and a history suggestive of dominant disease, although with no male-to-male transmission and family members have not been assessed. He has no genetic diagnosis explaining his CMT1 but has been found to carry the AR expansion without any features suggestive of Kennedy's.
TTR appears on many CMT panels, but the allele frequency of the common Val122Ile, predominantly cardiac variant, has unsurprisingly been incidentally detected in some of our patients with CMT. Detection of this variant is actionable, even if unrelated to the phenotype, because of the associated cardiac disease and the potential for gene-silencing therapy.73 Case 12, a lady in her seventies, had a distal HMN but also Val122Ile in TTR. Lastly, Case 13 is a lady in her twenties with severe CMT1E due to p.Cys85X in PMP22. She also carries Val122Ile in TTR. The TTR Val122Ile variants were not thought to be contributing to the phenotype in either of these cases.
Discussion
Whole genome sequencing increases diagnostic rates
The diagnostic rate in CMT is not a straightforward metric to quantify. We previously reported a cohort of 425 CMT patients from our centre in 2012 with an overall diagnostic rate of 62.6%,74 which was similar to the Inherited Neuropathies Consortium cohort reported in 2015 with a diagnostic rate of 60.4% in 1652 patients.14 These reports were before the widespread use of WES and before the use of WGS in clinical practice. The diagnostic uplift from NGS panels, when the PMP22 duplication has been excluded, is reported between 29.0% and 39.8%,75-78 and the overall diagnostic rate, after PMP22 MLPA and NGS panel, in one study of 94 patients is reported at 63.6%.79 WES increases the genetic diagnosis further with rates in WES studies quoted between 18.2% and 45.9%, although the number of genes tested previously varied between studies.80-82 The best assessment of the overall diagnostic yield following WES is from a large Chinese cohort of 435 patients sequentially tested with PMP22 MLPA, targeted NGS panel and WES with an overall diagnostic rate of 70.0%.83 There are few studies reporting the diagnostic benefit of WGS, limited almost exclusively to case reports. Recent data from the Italian CMT Registry reported a diagnostic rate of 70.2% of all registered patients (711/1012) and in 88.3% of those who underwent genetic testing, but there was no discussion of how the genetic diagnosis was reached. We should also consider recruitment bias as the registry requires patient registration; there was significant underrepresentation of HMN (3.2%) and HSN (0.3%); phenotypes with low diagnostic rates.84 The 100KGP Pilot Study reported a diagnostic rate of 29% in neurological and neurodevelopmental disorders,11 and our neuropathy group has previously reported early diagnostic success from the 100KGP study.36 A South Korean study of 72 patients undiagnosed after WES, showed WGS yielding a diagnosis in 19.4%.85
We present for the first time, the diagnostic rate of a large, single, specialist inherited neuropathy centre after the introduction of WGS. Our overall diagnostic rate of 76.9% is the highest reported for a single CMT cohort. Although our officially reported diagnostic rate of WGS through the 100KGP is 31.8% (74/233), the true rate is 19.7% (46/233) as 28 of those recruited achieved their diagnosis through other testing methods prior to the release of 100KGP results. This value is nearly identical to the only other published WGS study in CMT,85 corroborating the current utility of the technology. Our diagnostic approach is primarily a phenotype-driven research analysis, combined with the specialist MDT. In the ‘Results’ section, we described different examples where WGS has led to a new diagnosis (e.g. SV analysis, non-coding variants and updating virtual panels) but these are underpinned for the most part by a detailed patient phenotype obtained after assessment in the specialist clinic. Groups, both in CMT and in other diseases, report this strategy amongst others, including a genotype-driven strategy with subsequent so-called ‘reverse phenotyping’,85,86 but this latter approach we feel is more appropriate for complex diseases where the pathology is often more widespread and there is better scope for phenotype expansion. The exception to this is for complex neuropathies where often systemic disorders are implicated and e.g. mitochondrial or metabolic variants may prompt reverse-phenotyping.4,87
The cost and resources required for WGS are clearly a consideration for patients and clinicians in low- and middle-income countries. The initial results from an ongoing study by the International Centre for Genomic Medicine in Neuromuscular Diseases (ICGNMD) have demonstrated high diagnostic success with SGTs and WES in patients without previous genetic testing, illustrating an effective alternative to WGS where resources are limited.88 Careful case selection for WGS is also a suggested approach for clinicians. It was shown by the 100KGP that the diagnostic rate of WGS approximately doubled when a trio study (proband and two parents) was performed compared with a singleton.11 Selecting cases for WGS with more than one family member available increases the likelihood of diagnostic success. We would also recommend prioritization of cases for WGS where a phenotype is very specific for a particular gene, but initial testing has not revealed a result, or where a single variant has been identified in a recessive gene of interest (and sequencing of that individual gene is either not possible, or hasn't yielded a ‘second hit’). Based on our data, complex or sensory ataxic neuropathy phenotypes have the highest proportion of diagnoses made via WGS. In the case of SAN, this is made possible where research access allows interrogation of the intronic region of RFC1, and in complex neuropathies, a broad number of virtual panels covers a range of possible neuromuscular or neurogenetic disorders.
Comparison to previously published cohorts
We present the diagnostic breakdown in our specialist inherited neuropathy centre. The most frequent CMT diagnoses, in descending order, are PMP22dup (43.3% of solved cases), GJB1 (13.0%), PMP22del (6.2%), MFN2 (3.9%), SPLTC1 (3.5%) and MPZ (3.4%). The breakdown of these most common disorders reflects published cohorts with a few exceptions.14,89,90 The overall proportion of CMT1A is commonly reported between 50% and 60%. However, in our series, CMT1A accounted for only 43.3% of our solved cohort, reflecting a referral bias towards undiagnosed patients who already have a negative PMP22 duplication result. We also see a higher proportion of SPLTC1 due to the C133W founder mutation in the UK.26 Of particular note are the rising proportions of SORD- (1.4% of the total solved cohort) and RFC1- (2.0%) related disease. The population allele frequency of the most common SORD variant p.Ala253GlnfsTer27 is between 4 × 10⁻⁴ (based on gnomAD v2; probably an underestimate due to the presence of the homologous variant in the SORD2P pseudogene) and 4 × 10⁻³ (gnomAD v3). Using a UK population of 67 million and a prevalence of CMT of 1:2500, there should be roughly ∼27 000 patients with CMT in the UK. Taking our diagnostic rate of 76.9% of which 1.4% are SORD, we would expect around 290 patients in the UK with SORD. However, considering an allele frequency of 0.4% for p.Ala253GlnfsTer27, the Hardy–Weinberg equation tells us that there should be >1000 homozygotes of this variant in the UK. Therefore we are still probably underdiagnosing SORD, in part because it has only very recently been included on the NHS-GMS diagnostic panel due to technical challenges with this particular variant.23 The same extrapolation could be made for the astonishingly common AAGGG pathogenic expansion (allele frequency of around 1%) in RFC1, which too carries technical challenges in testing but will also probably be underdiagnosed due to its late-onset and variable manifestations.24
Extrapolation of the results described in our study to other populations must consider the population in question. Barring a few exceptions (e.g. SPTLC1 in the UK), the results in our study reflect previously published studies. However comparatively large cohorts are almost exclusively limited to Western Europe, North America and East Asia. The genetic landscape is less well defined in other parts of the world.91,92 Clinicians working in relatively uncharted regions from a CMT perspective must be wary that although it is likely that many forms of the disease are ubiquitous, there may be some local genetic variation yet unidentified. One must also consider cultural perspectives including where consanguinity, and therefore recessive disease, is more common. An example of a regional genetic hotspot is that of NOTCH2NLC causing CMT; the disease is extremely rare outside Asia.93
The remaining diagnostic gap
Most genes in CMT1 are now known, evidenced by our diagnostic rate of 100% for dominant forms and 96.8% considering all inheritance patterns. However, CMT2, HMN, non-SPLTLC1 HSN and non-GJB1 CMTi struggle to achieve 50% genetic diagnosis even after WGS. The reasons for this are not entirely clear. One explanation is the denominator used for axonal neuropathies. Many late-onset sporadic axonal neuropathies that are felt to be genetic, although they may fall into the ‘idiopathic axonal neuropathy’ category, are unsolved. There may be yet undiscovered genes with Mendelian inheritance causing late-onset axonal neuropathy, but one should appropriately consider the concept of ‘risk alleles’. These have been proposed in EXOC494 and MME,95 the latter is known to cause recessive CMT, but more work is needed to fully understand their role. CMT2 may also be thought of as an ‘axonopathy’ and rather than considering CMT and hereditary spastic paraparesis (HSP) as separate entities, they are increasingly thought of as a continuum with genetic testing reflecting this.96
More broadly, there are limitations of WGS, particularly the ability of short-read technology to detect and correctly quantify complex SVs and REs. Long-read WGS technologies, sequencing more than 10 000 bases in a single strand without need for amplification, has shown much-improved sensitivity for detecting this type of genetic variation. The read length comes at a cost; it is expensive and detection accuracy for SNVs and small indels is reduced.97 These technologies are increasingly being used in a research setting and have had success in diagnostics and understanding molecular mechanisms in CMT.98, 99 Optical genome mapping, sometimes termed ‘genome imaging’, using Bionano technology is another method of looking for structural variation in the genome and is thought to be the most sensitive method for detecting complex, balanced SVs.100 It has been successfully used in the research setting in neurological disease and its application is being extended to CMT.101
One clear criticism of current genomic research is the human reference genome. Although over 20 years, successive iterations have dramatically improved, the sequence was derived from 20 volunteers from the USA, and one study demonstrated that about two-thirds was from a single donor, probably of mixed African and European ancestry.102,103 Clearly a reference used globally needs to reflect the population as a whole, and the Human Pangenome Project is attempting to create a pangenome, including filling in any existing gaps, from at least 350 human diploid genomes.104
Transcriptomics through RNA sequencing has also been explored in neurological disease. The results of splicing abnormalities are most likely to be detected in affected tissues, thus its use is best in multi-system disease, e.g. mitochondrial disease, where muscle is easily available.105,106 However, it has been successfully used to demonstrate the pathogenic effect of an intronic cryptic splice variant in uncomplicated CMT (due to IGHMBP2) from fibroblasts and leucocytes.47 Tissue-specific expression of protein isoforms is a consideration for unsolved genetic cases but is problematic in neuropathy. Variants in DST have been shown to cause isoform-specific loss of protein function, although in this instance all transcripts were present in RNA isolated from skin.107 Contrastingly, some disease-implicated transcripts are restricted to the affected organ (e.g. brain, nerve), and extrapolating such studies where anterior horn cell or dorsal root ganglion tissue are required would be challenging.108 The concept of accessing disease-specific tissue also highlights the challenge of functional studies in neuropathy and why many candidate variants private to families remain VUS.
There is unlikely going to be a single ‘fix-all’ solution for the remaining undiagnosed 23.1% of CMT patients. The identification of new genes and variants is likely to come from a combination of existing approaches using NGS data such as linkage analyses, de novo studies and analysing genomic data from common phenotypes together with searching for common alleles, combined with multiple sequencing techniques and functional analysis where available. This multi-omics strategy has been elegantly demonstrated in the recent identification of a gene-intergenic fusion causing duplicated exons in UBE3C causing dHMN1 in a single family.109
In conclusion, we present the highest diagnostic rate to date in a single CMT cohort. We have demonstrated how WGS has contributed to this, and how our approach to the genomic data has allowed this diagnostic uplift. It was essential to have a multidisciplinary approach with research access to the WGS data, to combine clinical and genetic expertise, in search of the cause in each family. Despite this, there remains a diagnostic gap of 23%, and newer technologies combined with an up-to-date reference genome should contribute to further diagnostic success. We must also consider that some diseases will not be attributable to monogenic, fully penetrant genetic variation, and some genetic risk factors will emerge as apparent causes of CMT.
Data availability
The data that support the findings of this study are available from the corresponding author, upon reasonable request. The data are not publicly available since they contain information that could compromise the privacy of research participants.
Acknowledgements
Part of this research was made possible through access to the data and findings generated by the 100 000 Genomes Project. The 100 000 Genomes Project is managed by Genomics England Limited (a wholly owned company of the Department of Health and Social Care). The 100 000 Genomes Project is funded by the National Institute for Health Research and NHS England. The Wellcome Trust, Cancer Research UK and the Medical Research Council have also funded research infrastructure. The 100 000 Genomes Project uses data provided by patients and collected by the National Health Service as part of their care and support. C.J.R. and M.M.R. are grateful to the Medical Research Council (MRC MR/S005021/1) and the National Institutes of Neurological Diseases and Stroke and Office of Rare Diseases (U54NS065712 and 1UOINS109403-01 and R21TROO3034) and M.M.R. also to the Muscular Dystrophy Association (MDA510281) and the Charcot Marie Tooth Association (CMTA) for their support. This research was also supported by the National Institute for Health Research University College London Hospitals Biomedical Research Centre.
Competing interests
The authors report no competing interests.
Supplementary material
Supplementary material is available at Brain online.

