


Abstract
Females are disproportionately affected by dementia due to Alzheimer's disease. Despite a similar amyloid-β (Aβ) load, a higher load of neurofibrillary tangles (NFTs) is seen in females than males. Previous literature has proposed that Aβ and phosphorylated-tau (p-tau) synergism accelerates tau tangle formation, yet the effect of biological sex in this process has been overlooked.
In this observational study, we examined longitudinal neuroimaging data from the TRIAD and ADNI cohorts from Canada and USA, respectively. We assessed 457 participants across the clinical spectrum of Alzheimer's disease. All participants underwent baseline multimodal imaging assessment, including MRI and PET, with radioligands targeting Aβ plaques and tau tangles, respectively. CSF data were also collected. Follow-up imaging assessments were conducted at 1- and 2-year intervals for the TRIAD cohort and 1-, 2- and 4-year intervals for the ADNI cohort.
The upstream pathological events contributing to faster tau progression in females were investigated—specifically, whether the contribution of Aβ and p-tau synergism to accelerated tau tangle formation is modulated by biological sex. We hypothesized that cortical Aβ predisposes tau phosphorylation and tangle accumulation in a sex-specific manner.
Findings revealed that Aβ-positive females presented higher CSF p-tau181 concentrations compared with Aβ-positive males in both the TRIAD (P = 0.04, Cohen's d = 0.51) and ADNI (P = 0.027, Cohen's d = 0.41) cohorts. In addition, Aβ-positive females presented faster NFT accumulation compared with their male counterparts (TRIAD: P = 0.026, Cohen's d = 0.52; ADNI: P = 0.049, Cohen's d = 1.14). Finally, the triple interaction between female sex, Aβ and CSF p-tau181 was revealed as a significant predictor of accelerated tau accumulation at the 2-year follow-up visit (Braak I: P = 0.0067, t = 2.81; Braak III: P = 0.017, t = 2.45; Braak IV: P = 0.002, t = 3.17; Braak V: P = 0.006, t = 2.88; Braak VI: P = 0.0049, t = 2.93).
Overall, we report sex-specific modulation of cortical Aβ in tau phosphorylation, consequently facilitating faster NFT progression in female individuals over time. This presents important clinical implications and suggests that early intervention that targets Aβ plaques and tau phosphorylation may be a promising therapeutic strategy in females to prevent the further accumulation and spread of tau aggregates.
Introduction
Alzheimer's disease (AD) is the most common form of dementia.1 Deposition of amyloid-β (Aβ) plaques and tau neurofibrillary tangles (NFTs) in the brain are the two key neuropathological hallmarks of AD.2 In recent years, the development of PET tracers has enabled the in vivo quantification of Aβ plaques and NFT pathology,3-9 which has contributed considerably to our increased understanding of the progression of these two important AD biomarkers. The question of how plaques relate to tangles has been a topic of intense investigation but is still not resolved. For many years, the prevailing view of AD pathogenesis has proposed that Aβ initiates a pathophysiological cascade leading to tau pathology and neurodegeneration. However, accumulating evidence also suggests a synergistic effect between the two pathologies, which is associated with neurodegeneration and subsequent cognitive decline.10-12 Among the earliest tau-related abnormalities in AD are increases in soluble hyperphosphorylated tau (p-tau) concentrations in the CSF13 and plasma.14-16 Recent studies have suggested that increases in p-tau precede NFT pathology,15,17,18 starting at the preclinical stage of AD when individuals are asymptomatic.19 The most substantial increases in p-tau are witnessed in early symptomatic AD, before plateauing in the AD dementia stage.20,21 Importantly, the rate of soluble p-tau increase has been shown to correlate with Aβ burden, strengthening the view that Aβ induces the increases in p-tau.22 Levels of soluble p-tau have also been shown to correlate with neuropathological levels of NFTs,23-25 and some evidence indicates that synergistic interaction between Aβ and p-tau predicts cognitive decline and progression to dementia.10 These findings collectively propose that Aβ and p-tau synergism accelerates NFT accumulation and disease progression. However, the factors modifying the rate of NFT accumulation over time remain largely unknown.
In recent years, there has been increased recognition of sex differences in AD prevalence.26,27 The higher age-standardized dementia prevalence in females [female-to-male ratio = 1.69 (1.64–1.73)] shown in the recent 2022 Global Burden of Disease report provides evidence that higher incident cases in females cannot simply be explained by greater life expectancy.28 Indeed, there is growing evidence suggesting other factors contributing to this disproportionally high prevalence of AD in females.29-32 For example, females accumulate more widespread tau pathology than males, as indicated by higher Braak stages at death.33,34 This observation motivated investigations focusing on sex differences in tau pathology. It has been reported that cognitively unimpaired female participants show higher tau-PET retention than their male counterparts in the medial temporal lobes.30 Other PET imaging studies also demonstrated a specific interaction between sex and APOE ɛ4-potentiated early tau deposition in females but not males.35,36 However, only a few tau-PET studies have examined longitudinal data; even fewer have investigated the effect of biological sex. To our knowledge, one multi-cohort longitudinal PET study reported a higher rate of NFT accumulation in females and younger Aβ-positive individuals,37 yet more research is needed on sex differences in longitudinal tau progression.
To investigate the upstream pathological events contributing to faster tau progression in females, we first tested for sex differences in the relationships between cerebral Aβ deposition, NFT aggregation and CSF p-tau concentrations at baseline. We then evaluated how male and female participants with prominent Aβ pathology (Aβ+ individuals) differ in their CSF p-tau concentrations and NFT accumulation. Finally, we elucidated the interactive effect of sex, Aβ and CSF p-tau on longitudinal NFT accumulation. We hypothesized that cortical Aβ predisposes tau hyperphosphorylation in a sex-specific manner, which consequently facilitates faster tangle accumulation in female individuals. Overall, our results indicated that sex-specific modulation between cortical Aβ and tau phosphorylation underlies faster tau tangle accumulation in females.
Materials and methods
Participants
Translational biomarkers in ageing and dementia
We included individuals from the Translational Biomarkers in Aging and Dementia (TRIAD) cohort that was launched in 2017 as part of the McGill Centre for Studies in Aging. In this study, a total of 198 subjects were assessed. All participants underwent baseline and follow-up multimodal imaging assessments, including structural MRI, Aβ-PET with 18F-AZD4694 and tau-PET with 18F-MK6240. The participants also underwent biofluid collection and clinical and cognitive assessments, including the Mini-Mental State Examination (MMSE) and Clinical Dementia Rating (CDR). A subset of participants underwent 1-year (males: n = 30; females: n = 40) and 2-year (males: n = 32; females: n = 37) follow-up MRI and tau-PET assessments. In this study, male and female denote the participants’ biological sex. The Aβ-negative (Aβ−) group (n = 105) was composed of 51 male and 54 female subjects, and the Aβ-positive (Aβ+) group (n = 93) comprised 42 male and 51 female subjects. Cognitively unimpaired individuals had a CDR score of 0 and no objective cognitive impairment. Individuals with mild cognitive impairment (MCI) had subjective/objective cognitive impairment, a CDR score of 0.5 and essentially normal activities of daily living. Individuals with mild-to-moderate sporadic AD dementia met the National Institute on Aging and Alzheimer's Association criteria for probable AD as determined by a physician and had a CDR score between 0.5 and 2. We excluded participants with inadequately treated systemic conditions, active substance abuse, recent head trauma or major surgery and those presenting with MRI/PET safety contraindications. The study was approved by the Montreal Neurological Institute PET Working Committee and the Douglas Mental Health University Institute Research Ethics Board. Written informed consent was obtained from all participants.
Alzheimer's Disease Neuroimaging Initiative
In this study, to enhance the reproducibility of our findings, we incorporated 259 participants from the Alzheimer's Disease Neuroimaging Initiative (ADNI) cohort. The ADNI was launched in 2003 as a public-private partnership, led by Principal Investigator Michael W. Weiner, MD. The primary goal of ADNI has been to test whether serial MRI, PET, other biological markers and clinical and neuropsychological assessment can be combined to measure the progression of MCI and early AD. Participants in the ADNI cohort had structural MRI, Aβ-PET with 18F-florbetapir, tau-PET with 18F-flortaucipir, biofluid collection and clinical and cognitive assessments. Data used in the preparation of this article were obtained from the ADNI database. Briefly, we incorporated data of ADNI3 participants from ADNIMERGE (master datasheet, including demographic information, APOE genotypes, cognitive assessments and Aβ-PET data), UCBERKELEYAV1451_04_26_22 (tau-PET data) and UPENNBIOMK_MASTER_FINAL (CSF p-tau data). We only included participants with complete baseline Aβ-PET, tau-PET and CSF p-tau data at the same visit in this study. A subset of participants underwent 1-year (males: n = 44; females: n = 39), 2-year (males: n = 27; females: n = 37) and 4-year (males: n = 16; females: n = 22) follow-up tau-PET assessments. The ADNI study was approved by the institutional review boards of all the participating institutions. Informed written consent was obtained from all participants at each site. Full information regarding the inclusion and exclusion criteria in ADNI can be accessed at http://adni.loni.usc.edu/. There was no attempt to match cases between the two study cohorts.
Brain imaging methodology
TRIAD
Study participants underwent 3D MRI scans (Siemens), along with 18F-AZD4694 and 18F-MK6240 PET imaging performed on the same brain-dedicated scanner (Siemens high-resolution research tomograph, HRRT). 18F-AZD4694 images were acquired at 40–70 min after the intravenous bolus injection of the tracer and reconstructed with an ordered subset expectation maximization (OSEM) algorithm on a four-dimensional (4D) volume with three frames (3 × 600 s). 18F-MK-6240 images were acquired at 90–110 min after the intravenous bolus injection of the tracer and reconstructed using the same OSEM algorithm on a 4D volume with four frames (4 × 300 s) as previously described.8 At the end of each PET emission acquisition, a 6-min transmission scan with a rotating 137Cs point source was performed for attenuation correction. PET images were also corrected for motion, dead time, decay and scattered and random coincidences. Briefly, PET images were linearly registered to the native T1-weighted image space, and the T1-weighted images were linearly and non-linearly registered to the ADNI standardized space. Then, PET images in the T1 space were brought to the ADNI standardized space using transformations from native MRI to the ADNI standardized space. PET images were subsequently spatially smoothed to an 8-mm full-width at half-maximum resolution. 18F-AZD4694 standardized uptake value ratios (SUVRs) used the whole cerebellum grey matter as the reference region, whereas 18F-MK6240 SUVRs used the inferior cerebellar grey matter. The neocortical 18F-AZD4694 SUVR value was estimated for each participant by averaging the SUVR from the precuneus, prefrontal, orbitofrontal, parietal, temporal, anterior and posterior cingulate cortices. Tau-PET Braak stage segmentation was previously described elsewhere.38,39 The Desikan–Killiany–Tourville atlas was used to define the Braak regions of interest (ROIs).40 Braak ROIs consisted of the following regions (Supplementary Fig. 1): Braak I (transentorhinal); Braak II (entorhinal and hippocampus); Braak III (amygdala, parahippocampal gyrus, fusiform gyrus, lingual gyrus); Braak IV (insula, inferior temporal, lateral temporal, posterior cingulate and inferior parietal); Braak V (orbitofrontal, superior temporal, inferior frontal, cuneus, anterior cingulate, supramarginal gyrus, lateral occipital, precuneus, superior parietal, superior frontal, rostromedial frontal) and Braak VI (paracentral, postcentral, precentral and pericalcarine). Regional 18F-MK6240 SUVRs were also generated for meta-ROIs, including entorhinal, amygdala, parahippocampal, fusiform, inferior temporal and medial temporal regions. Aβ and tau positivity were assigned based on the 18F-AZD4694 neocortical SUVR (cut-off = 1.55)41 and 18F-MK6240 meta-ROI SUVR (cut-off = 1.24).42
ADNI
Full information regarding the acquisition and pre-processing of PET data in ADNI is provided at http://adni.loni.usc.edu/data-samples/pet/. Pre-processed PET images downloaded from ADNI underwent spatial normalization to the ADNI standardized space using the transformations of PET native to MRI native space and MRI native to the ADNI space. 18F-flortaucipir SUVR maps were generated using the inferior cerebellar grey matter as a reference region, and 18F-florbetapir SUVR maps were generated using the cerebellar grey matter as a reference region. A global 18F-florbetapir SUVR value was estimated for each participant by averaging the SUVR from the precuneus, prefrontal, orbitofrontal, parietal, temporal, anterior and posterior cingulate cortices. Regional 18F-flortaucipir SUVRs were generated for each Braak staging ROI as well as meta ROIs. Aβ and tau positivity were assigned based on the 18F-florbetapir SUVR (cut-off = 1.11)43 and 18F-flortaucipir meta-ROI SUVR (cut-off = 1.35).44
Fluid biomarker measurements
CSF and plasma collection in the TRIAD cohort followed the procedures previously described.45 All measures were quantified at the University of Gothenburg (Gothenburg, Sweden) by scientists blinded to the clinical and biomarker data. Concentrations of p-tau181 and p-tau217 in the CSF were quantified using a custom Single molecular array (Simoa) assay as described previously.19 Plasma p-tau181 was measured by in-house Simoa methods on an HD-X Analyzer (Quanterix).45
Neuroimaging voxel-based analysis
Neuroimaging voxel-based analyses were performed using the VoxelStats toolbox (https://github.com/sulantha2006/VoxelStats). VoxelStats46 is a MATLAB-based analytical framework that allows for the execution of multimodal voxel-based neuroimaging analyses. We stratified participants by their biological sex and performed sex-disaggregated voxel-based multivariate linear regression models outlined below to understand relationships between fluid and imaging markers of Aβ and tau deposition in a sex-specific manner.
In every brain voxel, the model test for the relationship between Aβ and CSF p-tau was of the form:
The model test for the relationship between NFT and CSF p-tau was of the form:
The model test for the main effects of CSF p-tau on NFT accumulation was of the form:
The model test for the main effects of plasma p-tau on NFT accumulation was of the form:
Age, APOE ε4 carriage status and pathological status (A−T−, A+T− and A+T+) were used as covariates in the models. T-statistical parametric maps were corrected for multiple comparisons using a false discovery rate (FDR) threshold of P < 0.001. BrainNet Viewer was used for the visualization of the results from the neuroimaging analyses.47
Neuroimaging region of interest-based analysis
Neuroimaging ROI-based analyses were performed using Python 3.9.12 and MATLAB R2015a (The MathWorks, Natick, MA, USA, http://www.mathworks.com). For Aβ-PET, a neocortical ROI, including precuneus, prefrontal, orbitofrontal, parietal, temporal, anterior and posterior cingulate cortices was used. For tau-PET, Braak ROIs and meta-ROIs were considered. We stratified participants by their biological sex and performed ROI-based multivariate linear regression models outlined below.
In each ROI, the model test for the relationship between Aβ and CSF p-tau was of the form:
The model test for the relationship between NFT and CSF p-tau was of the form:
The model test for the relationship between CSF p-tau and NFT accumulation was of the form:
The model test for the relationship between plasma p-tau and NFT accumulation was of the form:
The following models did not stratify participants by their biological sex.
The model test for the interactive effect of sex and CSF p-tau on NFT accumulation was of the form:
The model test for the effect of sex, cortical Aβ and CSF p-tau triple interaction on 2-year NFT accumulation was of the form:
The models used age, APOE ε4 carriage status and pathological status as covariates to account for their potential influence.
Statistical analysis
Statistical models were generated using Python 3.9.12. Demographic and clinical data, including age, education level, MMSE score and AD biomarkers levels were assessed using t-tests to evaluate if significant differences exist between A− and A+ groups. Differences in biological sex and APOE ε4 carriage status between A− and A+ groups were assessed using the chi-squared (χ2) tests. We used independent t-tests or Welch’s t-tests (accounting for unequal sample sizes and unequal variances), as appropriate, to assess the differences in CSF p-tau concentrations, plasma p-tau concentrations, and tau-PET SUVR changes between A+ male and A+ female participants.
Results
In this study, we included 198 participants from the TRIAD cohort. All individuals had complete MRI, Aβ-PET, tau-PET and fluid biomarkers data at baseline. Additional 1-year (mean = 1.09 ± 0.17 years) and 2-year (mean = 2.35 ± 0.37 years) follow-up MRI and tau-PET scans were also conducted. The ADNI cohort was used as the replication cohort (n = 259). Complete MRI, Aβ-PET, tau-PET and CSF biomarker data at baseline were also available in the ADNI cohort. Additional 1-year (mean = 1.06 ± 0.16 years), 2-year (mean = 2.06 ± 0.14 years) and 4-year (mean = 4.06 ± 0.11 years) follow-up tau-PET assessments were also conducted in some participants. Detailed demographic characteristics of the study populations are displayed in Table 1.
Demographics of study populations
| TRIAD cohort | ADNI cohort | |||
|---|---|---|---|---|
| Amyloid negative | Amyloid positive | Amyloid negative | Amyloid positive | |
| n | 105 | 93 | 138 | 121 |
| Sex, female (%) | 51.4% | 54.8% | 50% | 50.4% |
| Clinical diagnosis, CU:CI | 91:14 | 23:70**** | 94:44 | 54:67*** |
| Age, years, mean (SD) | 69.1 (8.98) | 69.5 (8.05) | 71.9 (7.46) | 74.8 (10.5)** |
| Education, years, mean (SD) | 15.4 (4.08) | 14.7 (3.15) | 16.9 (2.42) | 16.4 (2.42) |
| MMSE score, mean (SD) | 29.04 (1.15) | 26.37 (4.11)**** | 28.87 (1.54) | 26.83 (3.7)**** |
| APOE ε4 carriage status | 29.5% | 48.4%** | 21.7% | 52.1%**** |
| Alzheimer's disease biomarkers | ||||
| Amyloid-PET Neocortical SUVR | 1.297 (0.1) | 2.266 (0.45)**** | 1.011 (0.06) | 1.398 (0.2)**** |
| Tau-PET META-ROI SUVR | 0.846 (0.09) | 1.608 (0.88)**** | 1.129 (0.08) | 1.379 (0.35)**** |
| CSF p-tau181 | 297.6 (106.4) | 916.6 (671.6)**** | 18.53 (6.65) | 31.19 (15.5)**** |
| CSF p-tau217 | 5.23 (3.14) | 25.44 (20.2)**** | N/A | N/A |
The demographic and clinical data of the study populations (TRIAD and ADNI cohorts). Variables including age, education level, Mini-Mental State Examination (MMSE) score and Alzheimer’s disease imaging and fluid biomarkers were assessed using t-tests to evaluate significant differences between amyloid negative (Aβ−) and amyloid positive (Aβ+) groups. Group differences in participants’ biological sex and APOE ε4 carriage status were evaluated using the chi-squared (χ2) test. ADNI = Alzheimer’s Disease Neuroimaging Initiative; CI = cognitively impaired; CU = cognitively unimpaired; ROI = region of interest; SUVR = standardized value uptake ratio; TRIAD = Translational Biomarkers in Aging and Dementia. **P < 0.01, ***P < 0.001, ****P < 0.0001.
Cortical Aβ and tau aggregates correlate with CSF p-tau181 concentration
Sex-disaggregated ROI-based linear regression analyses were performed in TRIAD and ADNI cohorts to assess the sex differences in the relationships between CSF p-tau181 concentrations and regional Aβ and tau load. Findings revealed that both male and female subjects presented positive correlations between CSF p-tau181 concentrations and neocortical Aβ-PET SUVR (Fig. 1A; TRIAD, males: P < 0.0001, R2 = 0.43; females: P < 0.0001, R2 = 0.52; ADNI, males: P < 0.0001, R2 = 0.20; females: P < 0.0001, R2 = 0.24). Furthermore, both male and female individuals displayed positive correlations between CSF p-tau181 concentrations and regional tau-PET SUVRs. Importantly, in male subjects, this positive correlation weakened or became non-significant in Braak V-VI ROIs (TRIAD, Braak V: P = 0.0017, R2 = 0.16; Braak VI: P = 0.03, R2 = 0.075. ADNI, Braak V-VI: not significant). In contrast, female subjects demonstrated positive correlations between CSF p-tau181 concentrations and tau-PET SUVRs throughout Braak ROIs and meta-ROIs (Fig. 1A). Voxel-based analyses conducted within the TRIAD cohort further revealed a noteworthy positive correlation between CSF p-tau181 concentration and Aβ-PET signal in the frontal, medial temporal and parietal cortices in female subjects. On the other hand, this positive correlation was observed only in the temporoparietal areas in male subjects (Fig. 1B). When we investigated the relationships between CSF p-tau181 and tau-PET data at the voxel level, males exhibited a positive connection between CSF p-tau181 concentration and tau-PET signal primarily in the cingulum and temporal cortices. In contrast, females displayed a positive relationship between CSF p-tau181 concentration and tau load throughout the entire brain (Fig. 1B). We obtained consistent results in the ADNI cohort (Supplementary Fig. 2A) and in the TRIAD cohort with the CSF p-tau217 data (Supplementary Fig. 3).
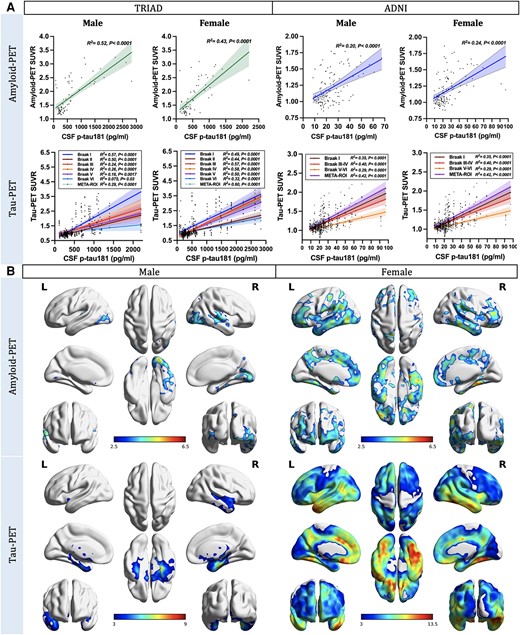
Cortical amyloid-β and tau aggregates strongly correlate with CSF phosphorylated tau181 concentration. (A) Sex-disaggregated linear regression analyses were performed in both TRIAD and ADNI cohorts to elucidate the sex differences in the relationships between CSF phosphorylated tau-181 (p-tau181) concentrations and regional amyloid-β (Aβ) and tau load. Findings revealed that both male and female subjects presented positive correlations between CSF p-tau181 concentration and neocortical Aβ-PET standardized uptake value ratio (SUVR; TRIAD, males: P < 0.0001, R2 = 0.43; females: P < 0.0001, R2 = 0.52. ADNI, males: P < 0.0001, R2 = 0.20; females: P < 0.0001, R2 = 0.24). Furthermore, both male and female individuals displayed positive correlations between CSF p-tau181 concentrations and regional tau-PET SUVRs. It is noteworthy that this positive correlation appeared to weaken or become non-significant in Braak V-VI regions of interest (ROIs) in male subjects (TRIAD, Braak V: P = 0.0017, R2 = 0.16; Braak VI: P = 0.03, R2 = 0.075. ADNI, Braak V-VI: not significant), while female subjects continued to demonstrate moderate positive correlations between CSF p-tau181 concentrations and regional tau-PET SUVRs in subjects (TRIAD, Braak V: P < 0.0001, R2 = 0.5; Braak VI: P < 0.0001, R2 = 0.32. ADNI, Braak V-VI: P < 0.0001, R2 = 0.29). (B) Sex-disaggregated voxel-based analyses were conducted within the TRIAD cohort to explore the differences between sexes in the associations between CSF p-tau181 and cerebral Aβ and tau load at the voxel level. The findings revealed a noteworthy positive correlation between CSF p-tau181 concentration and Aβ-PET signal in the temporoparietal cortices of males. Conversely, in females, this positive correlation was observed in multiple brain regions across the brain. When we investigated the relationships between CSF p-tau181 and tau-PET data, males exhibited a positive connection between CSF p-tau181 concentration and tau-PET signal primarily in the cingulum and temporal cortices. In contrast, females displayed a positive relationship between CSF p-tau181 concentration and tau load throughout the entire brain. Images represent voxel-based t-statistical parametric maps overlaid on the structural MRI reference template. Age, APOE ε4 carriage status and pathological status were used as covariates in the model. Results were corrected for multiple comparisons using a false discovery rate (FDR) cluster threshold of P < 0.001. ADNI = Alzheimer’s Disease Neuroimaging Initiative; L = left; R = right; TRIAD = Translational Biomarkers in Aging and Dementia.
Baseline CSF p-tau predicts longitudinal tau accumulation in females
Next, we examined the sex differences in the relationships between CSF p-tau181 concentrations and the longitudinal accumulation of NFTs using sex-disaggregated ROI-based linear regression models. In the TRIAD cohort, females displayed positive correlations between baseline CSF p-tau concentrations and NFT accumulation at both 1-year (CSF p-tau181: P < 0.0001, R2 = 0.58; CSF p-tau217: P < 0.0001, R2 = 0.55) and 2-year (CSF p-tau181: P < 0.0001, R2 = 0.56; CSF p-tau217: P < 0.0001, R2 = 0.84) follow-up visits (Fig. 2A and Supplementary Fig. 3). In contrast, males only exhibited positive associations at the 2-year follow-up assessment (CSF p-tau181: P = 0.0004, R2 = 0.25; p-tau217: P < 0.0001, R2 = 0.53). In the ADNI cohort, females demonstrated positive correlations between baseline CSF p-tau181 concentrations and NFT accumulation at the 2- (P = 0.0004, R2 = 0.21) and 4-year (P = 0.0004, R2 = 0.34) follow-up visits. Conversely, males did not exhibit any such associations (Fig. 2A). In line with these findings, voxel-based analyses also demonstrated positive associations between the concentration of p-tau181 and p-tau217 in the CSF at the baseline and longitudinal NFT accumulation in females but not males (Fig. 2B and Supplementary Figs 2B and 4).
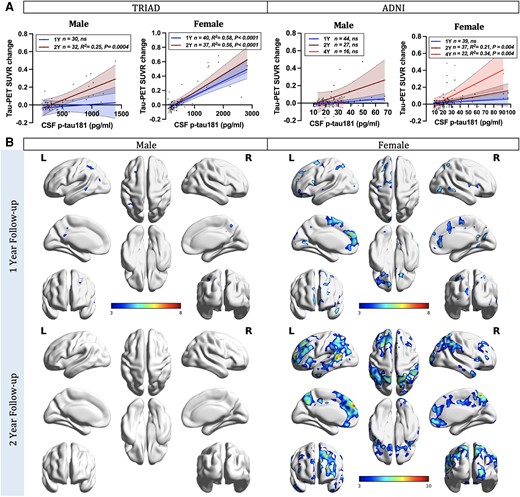
CSF phosphorylated-tau predicts tau accumulation in females. (A) Sex-disaggregated linear regression analyses were performed in both TRIAD and ADNI cohorts to examine the differences between sexes in the relationships between CSF phosphorylated tau-181 (p-tau181) concentrations and the longitudinal accumulation of neurofibrillary tangles (NFTs), as indicated by changes in tau-PET standardized uptake value ratios (SUVRs). In the TRIAD cohort, two follow-up time points were evaluated. Females displayed positive correlations between baseline CSF p-tau181 concentrations and NFT accumulation at both 1-year (P < 0.0001, R2 = 0.58) and 2-year (P < 0.0001, R2 = 0.56) follow-up visits. In contrast, males only exhibited positive associations at the 2-year follow-up assessment (P = 0.0004, R2 = 0.25). In the ADNI cohort, three follow-up time points were assessed. Females demonstrated positive correlations between baseline CSF p-tau181 concentrations and NFT accumulation at 2-year (P = 0.0004, R2 = 0.21) and 4-year (P = 0.0004, R2 = 0.34) follow-up visits. Conversely, males did not exhibit any such associations. (B) Sex-disaggregated voxel-based analyses demonstrated that the concentration of p-tau181 in the CSF at the baseline was positively associated with longitudinal NFT accumulation in females. In contrast, males presented almost no association. Images represent voxel-based t-statistical parametric maps overlaid on the structural MRI reference template. Age, APOE ε4 carriage status and pathological status were used as covariates in the models. Results were also corrected for multiple comparisons using a false discovery rate (FDR) cluster threshold of P < 0.001. ADNI = Alzheimer’s Disease Neuroimaging Initiative; L = left; R = right; TRIAD = Translational Biomarkers in Aging and Dementia.
Tau phosphorylation predicts faster tau accumulation in Aβ-positive females
Afterwards, we investigated how male and female participants with prominent Aβ pathology (Aβ+ individuals) differ in CSF p-tau181 concentrations and how this is contributing to the rate of longitudinal NFT accumulation. The findings suggested that Aβ+ females presented higher CSF p-tau181 concentrations (Fig. 3A) compared with Aβ+ males in both the TRIAD cohort (P = 0.04, Cohen's d = 0.51) and ADNI cohort (P = 0.027, Cohen's d = 0.41). Additionally, Aβ+ females also presented faster NFT accumulation (Fig. 3B) compared with Aβ+ males [TRIAD cohort (1-year): P = 0.026, Cohen's d = 0.52; ADNI cohort (4-year): P = 0.049, Cohen's d = 1.14]. Noteworthy positive correlations between baseline CSF p-tau181 concentration and the change in tau-PET meta-ROI SUVRs were identified in Aβ+ female subjects at 1-year (TRIAD: P = 0.05, R2 = 0.3), 2-year (TRIAD: P < 0.0001, R2 = 0.73; ADNI: P = 0.0025, R2 = 0.39) and 4-year follow-up (ADNI: P = 0.0014, R2 = 0.84) assessments (Fig. 3C). Importantly, voxel-based linear regression models also supported these findings by showing positive correlations between CSF p-tau181 concentration and longitudinal NFT accumulation in Aβ+ females (Fig. 3D). We obtained consistent results with the CSF p-tau217 data in TRIAD cohort (Supplementary Fig. 5).
![Tau phosphorylation predicts faster tau accumulation in Aβ+ females. (A) Aβ+ females presented higher CSF p-tau181 concentrations as compared to Aβ+ males in both the TRIAD cohort (P = 0.04, Cohen's d = 0.51) and ADNI cohort (P = 0.027, Cohen's d = 0.41). (B) Aβ+ females also presented faster neurofibrillary tangle (NFT) accumulation compared with Aβ+ males [TRIAD cohort (1-year): P = 0.026, Cohen's d = 0.52; ADNI cohort (4-year): P = 0.049, Cohen's d = 1.14]. (C) In Aβ+ female subjects, baseline CSF p-tau181 concentration was found to associate with the change in tau-PET meta-region of interest (ROI) standardized uptake value ratios (SUVRs) at 1-year (TRIAD: P = 0.05, R2 = 0.3), 2-year (TRIAD: P < 0.0001, R2 = 0.73; ADNI: P = 0.0025, R2 = 0.39) and 4-year follow-up (ADNI: P = 0.0014, R2 = 0.84) assessments. (D) Voxel-based linear regression models demonstrated positive correlations between CSF p-tau181 concentration and baseline tau-PET SUVR as well as longitudinal NFT accumulation in Aβ+ females. The models were corrected for age and APOE ε4 carriage status, and for multiple comparisons using a false discovery rate (FDR) cluster threshold of P < 0.001. ADNI = Alzheimer's Disease Neuroimaging Initiative; L = left; R = right; TRIAD = Translational Biomarkers in Aging and Dementia.](https://oup.silverchair-cdn.com/oup/backfile/Content_public/Journal/brain/147/4/10.1093_brain_awad397/2/m_awad397f3.jpeg?Expires=1750829899&Signature=aKcm5x0sKN0iwuJvu3JJP8~oFeW1~tgJzHqjbGvTBfhdGr5sfisp5sUISe4MDn8XZyiFD7KDDzv43OUPHKewnVnntH749Oof4GqUvAq~ZAAjYMZocu31FbE2PB17ks1djdQa2doDG9uBMGEzjSgdAGhNxkZOpOR1XTdQFWQCZm3q9utREcuCihoRT5~foBFy3C6dUmrginkfMVUfAbxJqLakrZRjOfhVRU~g1i5kwzxoPrvfDCwjbOnVqPC2zJwA2meff1hPxLWLT4UKHZ6Qd4LgGvC9LoKyCvPZgqE8Qj2j08y6gejebrwQ1010bp22fi0OsmvFEQmSmB1mUMGToA__&Key-Pair-Id=APKAIE5G5CRDK6RD3PGA)
Tau phosphorylation predicts faster tau accumulation in Aβ+ females. (A) Aβ+ females presented higher CSF p-tau181 concentrations as compared to Aβ+ males in both the TRIAD cohort (P = 0.04, Cohen's d = 0.51) and ADNI cohort (P = 0.027, Cohen's d = 0.41). (B) Aβ+ females also presented faster neurofibrillary tangle (NFT) accumulation compared with Aβ+ males [TRIAD cohort (1-year): P = 0.026, Cohen's d = 0.52; ADNI cohort (4-year): P = 0.049, Cohen's d = 1.14]. (C) In Aβ+ female subjects, baseline CSF p-tau181 concentration was found to associate with the change in tau-PET meta-region of interest (ROI) standardized uptake value ratios (SUVRs) at 1-year (TRIAD: P = 0.05, R2 = 0.3), 2-year (TRIAD: P < 0.0001, R2 = 0.73; ADNI: P = 0.0025, R2 = 0.39) and 4-year follow-up (ADNI: P = 0.0014, R2 = 0.84) assessments. (D) Voxel-based linear regression models demonstrated positive correlations between CSF p-tau181 concentration and baseline tau-PET SUVR as well as longitudinal NFT accumulation in Aβ+ females. The models were corrected for age and APOE ε4 carriage status, and for multiple comparisons using a false discovery rate (FDR) cluster threshold of P < 0.001. ADNI = Alzheimer's Disease Neuroimaging Initiative; L = left; R = right; TRIAD = Translational Biomarkers in Aging and Dementia.
Sex-specific modulation of Aβ on tau phosphorylation predicts faster tangle accumulation in females
Finally, we used multivariate linear regression analyses with triple interaction terms to test if sex modulated the relationships between Aβ and tau phosphorylation and predicted the longitudinal tangle aggregation. As shown in Table 2 (see Supplementary Table 5 for complete model statistics), the results suggested that the triple interaction between the female sex, Aβ and CSF p-tau181 was a significant predictor of accelerated tau accumulation throughout all Braak ROIs except for Braak II at the 2-year follow-up visit (Braak I: P = 0.0067, t = 2.81; Braak III: P = 0.017, t = 2.45; Braak IV: P = 0.002, t = 3.17; Braak V: P = 0.006, t = 2.88; Braak VI: P = 0.0049, t = 2.93). This triple interaction also significantly predicted accelerated NFT accumulation in meta-ROIs (Table 3; P = 0.01, t = 2.62). The findings remained significant after correcting for age, APOE ε4 carriage status and pathological status.
Sex-specific modulation of amyloid-β on tau phosphorylation predicts faster tangle accumulation in females (Braak ROIs)
| Est. (95% confidence interval) | t-stat | P-value | Est. (95% confidence interval) | t-stat | P-value | |
|---|---|---|---|---|---|---|
| Braak I | Braak II | |||||
| (Intercept) | 0.32 (0.07, 0.58) | 2.52 | 0.01 | 0.12 (−0.01, 0.25) | 1.81 | 0.075 |
| Age | 0.03 (−0.03, 0.09) | 1.02 | 0.31 | −0.01 (−0.04, 0.02) | −0.55 | 0.58 |
| APOE4 carriage status | −0.11 (−0.22, 0.01) | −1.86 | 0.068 | 0.00 (−0.06, 0.06) | 0.02 | 0.99 |
| Pathological status (A−T−) | −0.08 (−0.42, 0.27) | −0.44 | 0.66 | −0.06 (−0.23, 0.12) | −0.66 | 0.51 |
| Pathological status (A+ T−) | −0.14 (−0.37, 0.08) | −1.29 | 0.2 | −0.06 (−0.17, 0.06) | −0.98 | 0.33 |
| Sex [Female] | −0.11 (−0.28, 0.05) | −1.39 | 0.17 | 0.00 (−0.08, 0.09) | 0.08 | 0.94 |
| Amyloid-PET | 0.02 (−0.12, 0.16) | 0.28 | 0.78 | −0.01 (−0.08, 0.06) | −0.25 | 0.8 |
| CSF p-tau181 | 0.21 (0.01, 0.41) | 2.11 | 0.039 | 0.06 (−0.04, 0.17) | 1.26 | 0.21 |
| Sex [female] × Amyloid-PET × CSF p-tau181 | 0.25 (0.07, 0.42) | 2.81 | 0.0067 | 0.05 (−0.04, 0.14) | 1.17 | 0.25 |
| Braak III | Braak IV | |||||
|---|---|---|---|---|---|---|
| (Intercept) | 0.47 (0.25, 0.68) | 4.39 | <0.0001 | 0.35 (0.19, 0.51) | 4.29 | <0.0001 |
| Age | −0.04 (−0.09, 0.01) | −1.53 | 0.13 | −0.03 (−0.07, 0.01) | −1.64 | 0.11 |
| APOE4 carriage status | −0.02 (−0.11, 0.08) | −0.36 | 0.72 | 0.01 (−0.06, 0.09) | 0.35 | 0.73 |
| Pathological status, A−T− | −0.37 (−0.66, −0.09) | −2.61 | 0.01 | −0.24 (−0.46, −0.03) | −2.24 | 0.03 |
| Pathological status, A+T− | −0.38 (−0.56, −0.19) | −4.06 | 0.0002 | −0.22 (−0.36, −0.07) | −3.05 | 0.003 |
| Sex, female | −0.07 (−0.20, 0.07) | −1.0 | 0.32 | −0.09 (−0.19, 0.01) | −1.74 | 0.09 |
| Amyloid-PET | 0.12 (0.01, 0.23) | 2.12 | 0.04 | 0.01 (−0.07, 0.10) | 0.29 | 0.77 |
| CSF p-tau181 | −0.15 (−0.32, 0.02) | −1.76 | 0.08 | 0.10 (−0.03, 0.22) | 1.52 | 0.13 |
| Sex [female] × amyloid-PET × CSF p-tau181 | 0.18 (0.03, 0.33) | 2.45 | 0.017 | 0.18 (0.07, 0.29) | 3.17 | 0.002 |
| Braak V | Braak VI | |||||
|---|---|---|---|---|---|---|
| (Intercept) | 0.29 (0.12, 0.45) | 3.54 | 0.0008 | 0.26 (0.13, 0.40) | 4.0 | 0.0002 |
| Age | −0.05 (−0.09, −0.02) | −2.89 | 0.006 | −0.05 (−0.08, −0.02) | −3.46 | 0.001 |
| APOE4 carriage status | −0.03 (−0.10, 0.04) | −0.82 | 0.41 | −0.03 (−0.09, 0.03) | −1.08 | 0.28 |
| Pathological status, A−T− | −0.22 (−0.43, 0.00) | −1.99 | 0.05 | −0.18 (−0.36, 0.00) | −2.04 | 0.046 |
| Pathological status, A+T− | −0.21 (−0.35, −0.07) | −3.02 | 0.004 | −0.20 (−0.31, −0.08) | −3.4 | 0.001 |
| Sex, female | −0.08 (−0.18, 0.02) | −1.54 | 0.13 | −0.11 (−0.20, −0.03) | −2.71 | 0.009 |
| Amyloid-PET | 0.08 (−0.01, 0.16) | 1.74 | 0.09 | −0.05 (−0.12, 0.03) | −1.28 | 0.21 |
| CSF p-tau181 | −0.01 (−0.14, 0.12) | −0.13 | 0.89 | 0.23 (0.12, 0.33) | 4.41 | <0.0001 |
| Sex [female] × Amyloid-PET × CSF p-tau181 | 0.16 (0.05, 0.28) | 2.88 | 0.006 | 0.14 (0.04, 0.23) | 2.93 | 0.0049 |
Multivariate linear regression analyses unveiled that the triple interaction between the female sex, amyloid-β (Aβ) and CSF phosphorylated tau-181 (p-tau181) was a significant predictor of accelerated neurofibrillary tangle (NFT) accumulation throughout all Braak regions of interest except for Braak II at the 2-year follow-up visit (Braak I: P = 0.0067, t = 2.81; Braak III: P = 0.017, t = 2.45; Braak IV: P = 0.002, t = 3.17; Braak V: P = 0.006, t = 2.88; Braak VI: P = 0.0049, t = 2.93). The models were corrected for age, APOE ε4 carriage status and pathological status to account for their potential influence.
Sex-specific modulation of amyloid-β on tau phosphorylation predicts faster tangle accumulation in females (meta-ROIs)
| Meta-ROIs | |||
|---|---|---|---|
| Est. (95% conf. int.) | t-stat | P-value | |
| (Intercept) | 0.28 (0.12, 0.44) | 3.42 | 0.0009 |
| Age | −0.02 (−0.05, 0.01) | −1.31 | 0.19 |
| APOE4 carriage status | −0.01 (−0.07, 0.05) | −0.33 | 0.74 |
| Pathological status, A−T− | −0.24 (−0.38, −0.09) | −3.25 | 0.0016 |
| Pathological status, A+T− | −0.20 (−0.31, −0.10) | −3.89 | 0.0002 |
| Cohort, TRIAD | −0.02 (−0.07, 0.04) | −0.64 | 0.53 |
| Sex, female | −0.02 (−0.12, 0.07) | −0.53 | 0.60 |
| Centiloid | 0.001 (−0.001, 0.002) | 0.83 | 0.41 |
| CSF p-tau181 | 0.07 (−0.05, 0.20) | 1.16 | 0.25 |
| Sex × Centiloid | −0.0001 (−0.0017, 0.0014) | −0.19 | 0.85 |
| Sex × CSF p-tau181 | −0.03 (−0.17, 0.11) | −0.44 | 0.66 |
| Centiloid × CSF p-tau181 | −0.0022 (0.0038, −0.0007) | −2.83 | 0.006 |
| Sex [female] × Centiloid × CSF p-tau181 | 0.0023 (0.0006, 0.0041) | 2.62 | 0.01 |
Multivariate linear regression analyses showed that the triple interaction between the female sex, amyloid-β (Aβ) and CSF phosphorylated tau-181 (p-tau181) significantly predicted accelerated neurofibrillary tangle (NFT) accumulation in meta-regions of interest (P = 0.01, t = 2.62). Aβ-PET and CSF p-tau181 data were standardized using centiloid and z-score, respectively, in the TRIAD and ADNI cohorts, and the analysis was conducted in the merged dataset. The model was corrected for age, APOE ε4 carriage status, pathological status and cohort to account for their potential influence. TRIAD: Centiloid = (100 × 18F-AZD4694 SUVR − 1.21) / 1.394; ADNI: Centiloid = (196.9 × florbetapir SUVR) − 196.03. ADNI = Alzheimer’s Disease Neuroimaging Initiative; SUVR = standardized uptake value ratio; TRIAD = Translational Biomarkers in Aging and Dementia.
Discussion
The main goal of the present longitudinal biomarker study was to investigate upstream events contributing to higher NFT load observed in females. Specifically, we assessed if the contribution of Aβ and p-tau synergism on accelerated tau tangle formation was modulated by the biological sex. We used both imaging and fluid biomarkers data from two cohorts to assess the relationships between p-tau concentration and baseline Aβ load, baseline tau load and longitudinal NFT accumulation. The two major findings of this study are: first, females with prominent Aβ pathology (as indicated by a positive Aβ-PET SUVR) presented not only higher CSF p-tau concentrations but also faster NFT accumulation compared to Aβ+ males; and second, the triple interaction between the female sex, Aβ and CSF p-tau181 was a significant predictor of accelerated tau accumulation, suggesting Aβ− dependent tau phosphorylation constitute an important factor for promoting faster tau accumulation in females. Taken together, these results support a framework in which a sex-specific modulation of cortical Aβ on tau phosphorylation facilitates tau tangle formation in females, consequently leading to faster NFT progression seen in females over time (Fig. 4). Although previous studies have reported that p-tau predicts tau accumulation at different stages of AD, sex differences regarding these associations have been overlooked.48,49 Results from this study provide evidence that the sex-specific modulation of Aβ on tau phosphorylation serves a critical role in the Aβ cascade that drives tau aggregation.
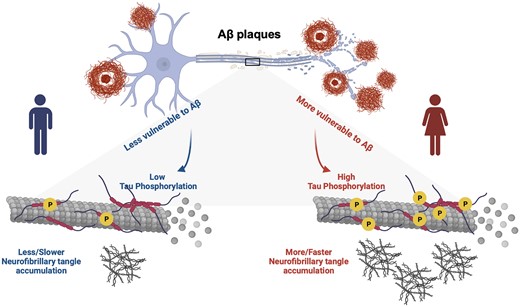
Sex-specific modulation of cortical amyloid-β on tau phosphorylation underlies faster tau tangle accumulation in females. We proposed a novel model suggesting that males and females react differently to amyloid-β (Aβ) plaques, which consequently leads to differences in CSF phosphorylated tau (p-tau) production and causes the faster neurofibrillary tangle (NFT) accumulation observed in females. Overall, it supports the hypothesis that Aβ-dependent tau phosphorylation is an important driving force behind faster tau progression in females. Image was created with BioRender.com.
AD is more common in females than in males,26,50,51 and based on findings from post-mortem neuropathology studies, females show greater tau pathology.34 Cross-sectional tau-PET studies examining cognitively unimpaired subjects have suggested that females present higher tau load in the entorhinal cortex in comparison with their male counterparts. Importantly, this high tau burden in females is associated with a higher Aβ level.30 Other studies have reported a modulation of APOE × Sex interaction on tau accumulation in early Braak stage regions.35,36 In this study, we also showed higher tau-PET SUVRs in Braak I-II ROIs in females compared with males (Supplementary Table 1), and the results remained significant after correcting for age, APOE ε4 carriage status and pathological status (A−T−, A+T− and A+T+). However, in the ADNI cohort, the tau-PET SUVRs were mainly affected by participants’ pathological status, so the sex effect on tau load disappeared after correcting for this (Supplementary Table 2). A preclinical study demonstrated that a high level of hyperphosphorylated tau in female rTg4510 transgenic mice led to more severe impairment in spatial learning and memory compared with their male littermates.52 Transcriptome-wide interaction analyses also suggested sex modulated tau phosphorylation at sites including Thr231, Ser199 or Ser202, among others, that could increase the risk of females developing AD.53 However, one limitation of these studies with cross-sectional design is the difficulty in determining if the higher tau load observed in females was only due to a survival effect. To gain a better dissect heterogeneity in AD pathogenesis and progression, it is important to elucidate the sex difference in key biomarkers and how they relate to longitudinal changes along the disease continuum. To our knowledge, sex difference in longitudinal tau progression has only been described in a study examining data from four cohorts. Smith and colleagues37 showed that female subjects present faster NFT accumulation; however, the pathological event contributing to this observation wasn’t investigated. The present study identified a sex-specific modulation between cortical Aβ and tau phosphorylation underlying faster tau tangle accumulation, which extends our knowledge of why females have faster tau aggregation and present more pronounced tau pathology.
In the present study, we included participants from two cohorts across the clinical spectrum of AD, integrating both cross-sectional and longitudinal fluid and neuroimaging biomarkers of AD pathology. Previous Aβ-PET studies showed no sex difference in cerebral Aβ pathology.30,54-56 In line with this, results from our study highlighted that, although there is no distinct sex difference in baseline Aβ load, males and females react differently to Aβ plaques. More specifically, we observed higher tau phosphorylation levels as well as more tangle accumulation in Aβ+ females compared with Aβ+ males (Fig. 3). It's valid to consider whether sex influences the relationship between Aβ and CSF p-tau, especially when male and female subjects exhibit similar R2 values. While results from ROI-based analyses might appear perplexing initially, it's important to recognize that R2 and the slope are distinct metrics. R2 evaluates the overall goodness-of-fit of the model, indicating that, in this case, the models fit equally well in both sexes. However, the slope provides more specific information about the direction and strength of the relationship. As shown in Supplementary Fig. 6, steeper slopes were observed in females, which explains why we saw a higher CSF p-tau181 concentration in females. To investigate this matter further, multivariate linear regression analyses were performed, and indeed, the results suggested that the interaction between the female sex and neocortical Aβ load were associated with higher CSF p-tau181 concentration (Supplementary Table 3). This indicated that males and females varied in their response to Aβ in terms of tau phosphorylation, which suggests there is a sex-specific modulation in the relationship between Aβ and tau phosphorylation. Furthermore, findings from voxel-based analyses also supported this notion by showing a positive correlation between CSF p-tau and Aβ-PET signal in a more widespread pattern in females compared with males [Fig. 1B; χ2(1, N = 1 721 900) = 1 096 333.88), P < 0.0001]. There are a few aspects of pathological processes we carefully examined to confirm that the Aβ-dependent tau phosphorylation is the primary driving force for faster NFT accumulation in females. As mentioned above, we found that the interaction between female sex and neocortical Aβ load was associated with higher CSF p-tau181 concentration (Supplementary Table 3). Additionally, as shown in Supplementary Table 4, multivariate linear regression analyses revealed that the interaction between female sex and CSF p-tau181 was a significant predictor of accelerated tau accumulation at both 1- and 2-year follow-up assessments. Together with the findings from triple interaction models (Table 2), these results collectively provided evidence that the higher level of Aβ-induced CSF p-tau secretion explains faster NFT progression seen in females, and this serves as a key step in the Aβ cascade that determines the aggregated tau pathology.
The present study is not free from limitations. It is worth noting the discrepancy between the results we obtained using CSF and plasma p-tau biomarkers. Similar to our findings with CSF p-tau, we identified positive correlations between baseline plasma p-tau181 concentration and longitudinal tau-PET change in females (Supplementary Fig. 7B and C). However, in contrast to the higher CSF p-tau concentrations observed in Aβ+ females compared with Aβ+ males, no significant difference was found in the plasma p-tau181 concentration (Supplementary Fig. 7A). We believe that the primary underlying factor responsible for this difference can be attributed to the fact that p-tau biomarkers in the plasma had lower mean fold-changes between Aβ− and Aβ+ groups compared with p-tau biomarkers in the CSF. Additionally, CSF p-tau biomarkers demonstrate greater effect sizes than their counterparts in plasma when differentiating between Aβ− and Aβ+ groups.57 Moreover, we generally see a lower concentration of p-tau being detected in the plasma as compared to the CSF,58 which might be attributed to the sex difference in the permeability of the blood–brain barrier. In one study examining more than 20 000 human subjects, females showed a significantly lower CSF/serum albumin ratio compared to males,59 which highlights that females may have different levels of blood–brain barrier integrity (less permeable) compared with their male counterparts. Besides the smaller effect size of plasma p-tau biomarker and the sex difference in blood–brain barrier integrity, it is worth noting that tau-PET, CSF p-tau and plasma p-tau have been indicated to represent different disease stages in the AD spectrum.19,60,61 This disparity in disease stage representation between different biomarkers may also contribute to the discrepancies observed between CSF and plasma p-tau results. Additionally, the impact of testosterone on p-tau production should be considered. One previous study suggested that testosterone is protective against CSF p-tau, so the lower testosterone levels in females may predispose them to pathological tau.62 Since we are unaware of evidence showing that testosterone also affects plasma p-tau concentrations, this might be another reason for the differences we observed in the study. Another limitation of this present study was the variability of the longitudinal data, where some MCI and AD dementia patients showed decreases in Aβ-PET and/or tau-PET SUVRs over time. This observation has been reported previously, although the reasons for these negative SUVR changes in some individuals are not fully resolved.63-66 Finally, both the TRIAD and ADNI cohorts are relatively homogeneous across race and ethnicity; it is crucial to replicate and extend findings from this study in other independent larger cohorts with greater diversity.
In conclusion, this longitudinal biomarker study proposes a model in which the sex-specific modulation between cortical Aβ and tau phosphorylation underlies faster tau tangle accumulation in females. Findings from this study provide evidence that increases in Aβ-dependent soluble p-tau levels play a critical role in initiating tau pathology in females and lead to faster tau progression over time. These results suggest possible mechanisms behind sex differences in tau pathology, which might contribute to the higher prevalence of AD dementia in females compared with males. One might claim that this study suggests that females might need earlier intervention in clinical trials targeting Aβ plaques. In addition, drugs reducing soluble brain p-tau concentrations may be particularly beneficial and promising therapeutic strategies for female patients to prevent further accumulation and spread of tau aggregates and cognitive decline. These findings collectively provide insights into the optimal design of clinical trials directed against AD pathologies and important prognostic information for females with, and at risk of, AD.
Data availability
Data from the TRIAD cohort that support the findings of this study are available from the corresponding author upon reasonable request. All requests for raw and analysed data and materials will be reviewed promptly by McGill University to verify whether the request is subject to any intellectual property or confidentiality obligations. Anonymized data will be shared upon request from a qualified academic investigator for the purpose of replicating the procedures and results presented in this article. Any data and materials that can be shared will be released via a material transfer agreement. Data are not publicly available due to information that could compromise the privacy of research participants.
Acknowledgements
We would like to express our gratitude to our participant volunteers and their families for their participation in this study. We thank the staff, research nurses, psychometrist and neurologist at the McGill Centre for Studies in Aging for their contribution. We thank the radiographers and technicians at the McConnell Brain Imaging Centre and The Neuro (Montreal Neurological Institute-Hospital) for their role in imaging data acquisition. Data used in preparation of this article were obtained from the Alzheimer’s Disease Neuroimaging Initiative (ADNI) database (adni.loni.usc.edu). As such, the investigators within the ADNI contributed to the design and implementation of ADNI and/or provided data but did not participate in analysis or writing of this report. A complete listing of ADNI investigators can be found at: http://adni.loni.usc.edu/wp-content/uploads/how_to_apply/ADNI_ Acknowledgement_List.pdf
Funding
This research is supported by the Weston Brain Institute, Canadian Institutes of Health Research (CIHR) (MOP-11-51-31; RFN 152985, 159815, 162303), Canadian Consortium of Neurodegeneration and Aging (CCNA; MOP-11-51-31 Team 1), the Alzheimer’s Association (NIRG-12-92090, NIRP-12-259245), Brain Canada Foundation (CFI Project 34874; 33397), the Fonds de Recherche du Québec Santé (FRQS; Chercheur Boursier, 2020-VICO-279314) and the Colin J. Adair Charitable Foundation. Y.T.W. received the FRQS doctoral award.
ADNI data collection and sharing was funded by the Alzheimer's Disease Neuroimaging Initiative (National Institutes of Health Grant U19 AG024904) and DOD ADNI (Department of Defense award number W81XWH-12-2-0012). ADNI is funded by the National Institute on Aging, the National Institute of Biomedical Imaging and Bioengineering, and through generous contributions from the following: AbbVie, Alzheimer’s Association; Alzheimer’s Drug Discovery Foundation; Araclon Biotech; BioClinica, Inc.; Biogen; Bristol-Myers Squibb Company; CereSpir, Inc.; Cogstate; Eisai Inc.; Elan Pharmaceuticals, Inc.; Eli Lilly and Company; EuroImmun; F. Hoffmann-La Roche Ltd and its affiliated company Genentech, Inc.; Fujirebio; GE Healthcare; IXICO Ltd.; Janssen Alzheimer Immunotherapy Research & Development, LLC.; Johnson & Johnson Pharmaceutical Research & Development LLC.; Lumosity; Lundbeck; Merck & Co., Inc.; Meso Scale Diagnostics, LLC.; NeuroRx Research; Neurotrack Technologies; Novartis Pharmaceuticals Corporation; Pfizer Inc.; Piramal Imaging; Servier; Takeda Pharmaceutical Company; and Transition Therapeutics. The Canadian Institutes of Health Research is providing funds to support ADNI clinical sites in Canada. Private sector contributions are facilitated by the Foundation for the National Institutes of Health (www.fnih.org). The grantee organisation is the Northern California Institute for Research and Education, and the study is coordinated by the Alzheimer’s Therapeutic Research Institute at the University of Southern California. ADNI data are disseminated by the Laboratory for Neuro Imaging at the University of Southern California.
Unrelated to the work presented in this paper, H.Z. is a Wallenberg Scholar supported by grants from the Swedish Research Council (#2022-01018), the European Union’s Horizon Europe research and innovation programme under Grant Agreement No. 101053962, Swedish State Support for Clinical Research (#ALFGBG-71320), the Alzheimer Drug Discovery Foundation (ADDF), USA (#201809-2016862), the AD Strategic Fund and the Alzheimer’s Association (#ADSF-21-831376-C, #ADSF-21-831381-C, and #ADSF-21-831377-C), the Bluefield Project, the Olav Thon Foundation, the Erling-Persson Family Foundation, Stiftelsen för Gamla Tjänarinnor, Hjärnfonden, Sweden (#FO2022-0270), the European Union’s Horizon 2020 research and innovation programme under the Marie Skłodowska-Curie Grant Agreement No. 860197 (MIRIADE), the European Union Joint Programme—Neurodegenerative Disease Research (JPND2021-00694) and the UK Dementia Research Institute at UCL (UKDRI-1003). K.B. is supported by the Swedish Research Council (#2017-00915 and #2022-00732), the Swedish Alzheimer Foundation (#AF-930351, #AF-939721 and #AF-968270), Hjärnfonden, Sweden (#FO2017-0243 and #ALZ2022-0006), the Swedish state under the agreement between the Swedish government and the County Councils, the ALF-agreement (#ALFGBG-715986 and #ALFGBG-965240), the European Union Joint Program for Neurodegenerative Disorders (JPND2019-466-236), the Alzheimer’s Association 2021 Zenith Award (ZEN-21-848495) and the Alzheimer’s Association 2022-2025 Grant (SG-23-1038904 QC).
Competing interests
The authors report no competing interests related to this work. Outside the work presented in this paper, P.R.N. provides consultancy services for Roche, Cerveau Radiopharmaceuticals, Lilly, Eisai, Pfizer and Novo Nordisk. He also serves as a clinical trials investigator for Biogen, Novo Nordisk. S.G. is a member of the scientific advisory boards of Alzheon, AmyriAD, Eisai Canada, Enigma USA, Lilly Canada, Medesis, Okutsa Canada, Roche Canada and TauRx. He is a member of the editorial board of JPAD and of the Neurotorium. He has given lectures under the auspices of Biogen Canada and Lundbeck Korea. H.Z. has served on scientific advisory boards and/or as a consultant for Abbvie, Acumen, Alector, Alzinova, ALZPath, Annexon, Apellis, Artery Therapeutics, AZTherapies, CogRx, Denali, Eisai, Nervgen, Novo Nordisk, Optoceutics, Passage Bio, Pinteon Therapeutics, Prothena, Red Abbey Labs, reMYND, Roche, Samumed, Siemens Healthineers, Triplet Therapeutics and Wave, has given lectures in symposia sponsored by Cellectricon, Fujirebio, Alzecure, Biogen and Roche, and is a co-founder of Brain Biomarker Solutions in Gothenburg AB (BBS), which is a part of the GU Ventures Incubator Program (outside submitted work). K.B. has served as a consultant and on advisory boards for Acumen, ALZPath, BioArctic, Biogen, Eisai, Julius Clinical, Lilly, Novartis, Ono Pharma, Prothena, Roche Diagnostics and Siemens Healthineers; has served at data monitoring committees for Julius Clinical and Novartis; has given lectures, produced educational materials and participated in educational programs for Biogen, Eisai and Roche Diagnostics; and is a co-founder of Brain Biomarker Solutions in Gothenburg AB (BBS), which is a part of the GU Ventures Incubator Program.
Supplementary material
Supplementary material is available at Brain online.

