


Abstract
Late-onset Pompe disease (LOPD) is a rare genetic disorder caused by the deficiency of acid alpha-glucosidase leading to progressive cellular dysfunction owing to the accumulation of glycogen in the lysosome. The mechanism of relentless muscle damage (a classic manifestation of the disease) has been studied extensively by analysing the whole-muscle tissue; however, little, if anything, is known about transcriptional heterogeneity among nuclei within the multinucleated skeletal muscle cells. This is the first report of application of single-nucleus RNA sequencing to uncover changes in the gene expression profile in muscle biopsies from eight patients with LOPD and four muscle samples from age- and sex-matched healthy controls. We matched these changes with histological findings using GeoMx spatial transcriptomics to compare the transcriptome of control myofibres from healthy individuals with non-vacuolated (histologically unaffected) and vacuolated (histologically affected) myofibres of LODP patients.
We observed an increase in the proportion of slow and regenerative muscle fibres and macrophages in LOPD muscles. The expression of the genes involved in glycolysis was reduced, whereas the expression of the genes involved in the metabolism of lipids and amino acids was increased in non-vacuolated fibres, indicating early metabolic abnormalities. Additionally, we detected upregulation of autophagy genes and downregulation of the genes involved in ribosomal and mitochondrial function leading to defective oxidative phosphorylation. Upregulation of genes associated with inflammation, apoptosis and muscle regeneration was observed only in vacuolated fibres. Notably, enzyme replacement therapy (the only available therapy for the disease) showed a tendency to restore dysregulated metabolism, particularly within slow fibres. A combination of single-nucleus RNA sequencing and spatial transcriptomics revealed the landscape of the normal and diseased muscle and highlighted the early abnormalities associated with disease progression. Thus, the application of these two new cutting-edge technologies provided insight into the molecular pathophysiology of muscle damage in LOPD and identified potential avenues for therapeutic intervention.
Introduction
Pompe disease is caused by pathogenic variants in the GAA gene encoding the enzyme acid alpha-glucosidase (GAA) that is responsible for the hydrolysis of glycogen to glucose in the lysosomes of cells.1 GAA deficiency results in lysosomal accumulation of glycogen, leading to progressive cellular malfunction.2 The disease is a multisystem disorder affecting skeletal, smooth and cardiac muscle and neurons of the CNS.
Infantile-onset Pompe disease and late-onset Pompe disease (LOPD) are the two main clinical phenotypes. Infantile-onset Pompe disease patients show symptoms soon after birth, including generalized muscle weakness, respiratory insufficiency and cardiomyopathy leading to death if left untreated.3,4 Infantile-onset Pompe disease muscle biopsies are characterized by a massive accumulation of glycogen in most of the myofibres.5 LOPD manifests as muscle weakness of various degrees of severity and progressive respiratory insufficiency.6 Muscle biopsies of patients with LOPD are characterized by the accumulation of intralysosomal glycogen and autophagic vacuoles; however, the number of fibres showing these abnormalities ranges from a few to 30%–40% in a muscle section.7
Most of the studies aiming to understand the pathophysiology of Pompe disease have been done in murine models of the disease, and there is little evidence in humans coming from muscle samples of patients. Previous studies in mice demonstrated that glycogen accumulation in lysosomes results in a dysfunction of autophagy leading to the accumulation of autophagic debris in the sarcoplasm.8,9 Increased levels of autophagy-initiating proteins, such as serine/threonine-protein kinase VPS15, VPS34 and beclin 1, along with reduced activity of the mammalian target of rapamycin complex 1 (mTORC1) and activation of AMP-activated protein kinase (AMPK), were documented in muscle of GAA knockout animals.9 Impaired autophagy causes oxidative stress, accumulation of toxic ubiquitinated protein aggregates and dysfunctional mitochondria.2 Moreover, the inability to hydrolyse lysosomal glycogen can cause cells to use other metabolites, such lipids and proteins, for obtaining energy, as seen in murine models.9
To gain deeper insight into the pathogenesis of muscle degeneration in Pompe disease in humans, we studied the transcriptome of muscle samples from LOPD patients and age- and sex-matched controls using two new technologies. First, we applied single-nucleus RNA sequencing (snRNAseq) to analyse skeletal muscle samples from eight LOPD patients, including two individuals who received enzyme replacement therapy (ERT). SnRNAseq has revolutionized the field of transcriptomics by enabling the analysis of gene expression profiles at the single-nucleus level.10 This technology allows the identification of cell populations present in the tissue of interest in healthy and disease conditions, the study of differentially expressed genes in each cell population in comparison to controls and the identification of potential communication between cells, facilitating the understanding of how the disease process is orchestrated and its dynamics throughout disease progression. To match the changes in the gene expression profile with histological findings, we next applied spatial transcriptomics using the NanoString GeoMx Digital Spatial Profiler, which allowed us to unravel gene expression profiles in vacuolated (morphologically affected) and non-vacuolated (morphologically unaffected) muscle fibres of LOPD patients and compare them with muscle fibres from controls, dissecting the temporospatial dynamics of molecular changes taking place in muscle samples of Pompe disease patients.
Materials and methods
Muscle samples
All LOPD patients signed a consent form allowing their biopsy to be used for research. Muscle samples were stored at the biobanks of each collaborating institution and transferred to Newcastle University Biobank. The research study was approved by the Ethics Committee of Newcastle University (13866/2020). Control muscle samples were obtained from patients undergoing an orthopaedic surgery. All the samples were initially processed for routine histochemical staining (haematoxylin and eosin, Oil Red and cytochrome c oxidase and succinate dehydrogenase) at local hospitals.
Purification of nuclei from human muscle biopsies
Frozen muscles were placed in homogenization buffer (0.25 M sucrose–1% bovine serum albumin in Mg2+/Ca2+-free RNase-free PBS). Twenty-five to thirty milligrams of tissue were homogenized using Tissue Ruptor-II (Qiagen) and incubated for 5 min with 2.5% Triton X-100. Homogenates were filtered, pelleted by centrifugation and resuspended in cell sorting buffer [2% bovine serum albumin/RNase-free PBS and 0.2 U/μl Protector RNase-inhibitor (Roche)]. The suspension of nuclei was labelled with 4′,6-diamidino-2-phenylindole (DAPI; Merck) and sorted using a FACS Aria™ Fusion Flow Cytometer (BD Biosciences).
Single-nucleus RNA sequencing
Our snRNAseq protocol was based on previous published methods.11,12 In summary, nuclei were loaded into a 10× Chromium controller (10× Genomics) for nuclei partition into gel bead-in-emulsions (GEMs). cDNA sequencing libraries were prepared using Next GEM Single Cell 3′ Reagent Kits (10× Genomics). After GEM-RT clean-up, cDNA was amplified for 12 cycles, and cDNA quality control and quantification were performed on an Agilent Bioanalyzer High Sensitivity chip (Agilent Technologies). cDNA libraries were indexed by PCR using the PN-1000215 Dual Index Kit TT. The size distribution and concentration of 3′ cDNA libraries were verified on an Agilent Bioanalyzer High Sensitivity chip (Agilent Technologies). Finally, sequencing of cDNA libraries was done using an Illumina NovaSeq 6000 to obtain ∼20 000–30 000 reads per nucleus.
Bioinformatic analysis of single nuclei
We used the Seurat package13 (v.4.3.0) in R to analyse raw gene expression matrices. As part of quality filtering, we removed genes detected in <10 nuclei and filtered out nuclei with gene counts >200 and <1500 and with mitochondrial content >5%. DoubletFinder14 (v.2.0) was used to remove doublets. Expression matrices were normalized and integrated using the ‘NormalizeData’ and ‘IntegrateData’ functions. The top 3000 variable genes obtained using the FindVariableGenes function were used to perform principal component analysis with the ‘RunPCA’ function. Using the top 30 principal components, we performed graph-based clustering using the ‘FindClusters’ function at a resolution of 0.5 to identify clusters of nuclei. The data were visualized in two-dimensional space using the ‘RunUMAP’ function. We identified cluster-specific marker genes using the ‘FindAllMarkers’ function. Clusters were annotated based on the expression of known cell markers. DESeq215 was used to carry out a pseudo-bulk analysis and perform differential expression analysis between control and Pompe groups. Cell–cell communication was assessed using the CellChat R package.16
Enriched signalling pathway analysis
Dysregulated pathways in Pompe samples compared with controls were analysed with the software GSEA_4.3.2. We used the human Molecular Signatures Database (MSigDB) to identify enriched signalling pathways. The gene lists were analysed using three distinct pathway databases within MSigDB: Reactome, Kyoto Encyclopaedia of Genes and Genomes (KEGG) and Wiki pathway, for both up- and downregulated genes.17,18
Metabolic and autophagy pathway score
Pathway analysis was performed on a subset of all myofibre nuclei. Metabolism signalling pathways were obtained from the KEGG database. We selected 37 metabolism-related pathways for a total of 1354 genes. We also integrated gene sets from previous literature, KEGG and the Gene Ontology (GO) database to curate a database of six signalling pathways related to autophagy including a total of 446 genes. We then generated subsets of myonuclei from the Seurat object using the number of genes in the metabolism-related signalling pathways and autophagy database, respectively. The ‘AddModuleScore_Ucell’ function in Ucell19 was then used to generate signalling pathway scores and quantify the pathway activity across the cells in the different cell types and conditions in each subset. Comparisons between control (n = 4) and Pompe (n = 8) groups were performed using the Wilcoxon rank sum test.
NanoString GeoMX digital spatial profiler
Muscle blocks from Pompe and control patients were sectioned to a thickness of 5 μm, mounted on positively charged slides (VWR SuperFrost Plus), stained with laminin (1:200, Novus Biological) and LC3B (1:200, Abcam) antibodies and hybridized with ultraviolet-cleavable biological probes from the NanoString commercial Human Whole Transcriptome Atlas (GeoMx WTA) panel. Thirteen Pompe muscle sections and three control sections were scanned on a GeoMx DSP instrument (NanoString Technologies Inc.), and individual regions of interest (ROIs) were created for three groups: control, Pompe vacuolated (V) and Pompe non-vacuolated (NV) fibres. Next, ultraviolet-cleaved oligos from these ROIs were collected in a 96-well plate for sequencing on an Illumina NGS instrument. Libraries were prepared according to the manufacturer’s instructions (protocol 03/2022).
Data obtained from the NanoString GeoMx DSP platform were analysed using a dedicated software package (GeoMx Analysis Suite v.3.1). The quality control analysis showed that all ROIs had a good alignment rate and sequencing saturation. LOQ was defined as geomean (NegProbe) × geoSD(NegProbe)2 for each ROI. Target filtering was applied to retain gene targets with read counts above LOQ in ≥5% of ROIs. Q3 normalization was applied on the filtered ROIs and gene targets.
Differential gene expression analysis of GeoMX data
Differential gene expression across groups was analysed using the Mann–Whitney U-test; differentially expressed genes (DEGs) were defined as log2 fold changes >0.5 or <−0.5, adjusted log10P-value > 1.3. Analyses were conducted using GraphPad prism software (v.10.1.200). The upregulated and downregulated DEGs were analysed using Metascape20 (http://metascape.org) for functional annotations.
Statistical analysis
We confirmed that data on cell population did not follow a normal distribution using the Shapiro–Wilk test and therefore used a non-parametric test, specifically the Mann–Whitney U-test, to identify significant differences in the cell population between control and Pompe muscle samples. The Wilcoxon rank sum test was performed to analyse the up- and downregulated genes in Pompe versus control samples and to compare the expression of several autophagy-related genes between Pompe and control groups.
Results
Patients and samples
We performed snRNAseq on 10 muscle samples from eight Pompe disease patients and four muscle samples from age- and sex-matched healthy controls. Table 1 describes their main demographic and genetic data. Supplementary Fig. 1 shows areas of the haematoxylin and eosin staining of the muscle samples included.
Genetic data of Pompe disease patients and controls included in the study
| Patient | Sex | Mutation 1 | Mutation 2 | Age at biopsy (years) | Muscle biopsied | ERT at biopsy |
|---|---|---|---|---|---|---|
| Pompe disease | ||||||
| Pompe 1 | Female | c.-32-13T>G | c.2495_2496delCA | 34 | Quadriceps | No |
| Pompe 2 | Male | c.-32-13T>G | c.2078dupA | 33 | Quadriceps | No |
| Pompe 3 | Female | c.-32-13T>G | c.1951delG | 36 | Biceps brachii | No |
| Pompe 4 | Female | c.-32-13T>G | c.1933G>T | 53 | Quadriceps | No |
| Pompe 5 | Male | c.-32-13T>G | c.307T>G | 60 | Quadriceps | No |
| Pompe 6 | Female | c.-32-13T>G | c.2237G>A | 59 | Quadriceps | No |
| Pompe 7 | Female | c.-32-13T>G | c.1561G>A | 58 | Quadriceps | No |
| Pompe 7bis | Female | c.-32-13T>G | c.1561G>A | 59 | Quadriceps | Yes |
| Pompe 8 | Male | c.-32-13T>G | c.784G>A | 52 | Quadriceps | No |
| Pompe 8bis | Male | c.-32-13T>G | c.784G>A | 53 | Quadriceps | Yes |
| Control | ||||||
| Control 1 | Female | N/A | N/A | 35 | Quadriceps | N/A |
| Control 2 | Male | N/A | N/A | 48 | Quadriceps | N/A |
| Control 3 | Female | N/A | N/A | 51 | Quadriceps | N/A |
| Control 4 | Male | N/A | N/A | 43 | Quadriceps | N/A |
ERT = enzyme replacement therapy; N/A = not applicable.
Cell populations identified in the skeletal muscle samples
A total of 24 393 nuclei from controls and 47 255 nuclei from Pompe disease patients were obtained and sequenced. Unsupervised clustering identified 16 clusters of nuclei that were attributed to 11 putative identities based on the expression of canonical genes (Fig. 1A, Supplementary Fig. 2 and Supplementary Table 1). The largest number of nuclei were from myofibres expressing CKM, a marker of mature myonuclei. Slow fibres (type I) were assigned based on the expression of MYH7B, TNNT1 and TPM3, and fast fibres (type II) were assigned based on the expression of MYH1, MYH2, TNNT3 or TPM1. Interestingly, we have also found a cluster of myonuclei enriched in genes encoding components of the mitochondria, such as RPLP1, RPL29 and RPL18A, and the ribosome, such as COX6A2 and COX7A1. In-depth analysis of this cluster (Supplementary Fig. 3) showed that nuclei in this cluster had different origins, with a majority of nuclei expressing markers of fast fibres (such as MYH2) and others co-expressing markers of both fast and slow fibres (MYH2 and MYH7b) that could be considered hybrid fibres. We have decided to name this cluster ‘mixed myonuclei’. Genes encoding the embryonic and perinatal MyHC isoforms (MYH3 and MYH8, respectively) were identified in cluster 4, along with genes encoding for neuromuscular junction proteins, such as CHRNA1 or CHRNG, suggesting that this cluster could be enriched in nuclei from regenerative fibres. We used canonical genes to identify other cell populations, such as satellite cells (PAX7), smooth muscle cells (ACTA2 and PDGFRB), fibroadipogenic progenitor cells (PDGFRA and DCN), endothelial cells (PECAM), adipocytes (ADIPOQ), macrophages (MRC1) and T cells (FYB1) (Fig. 1B).
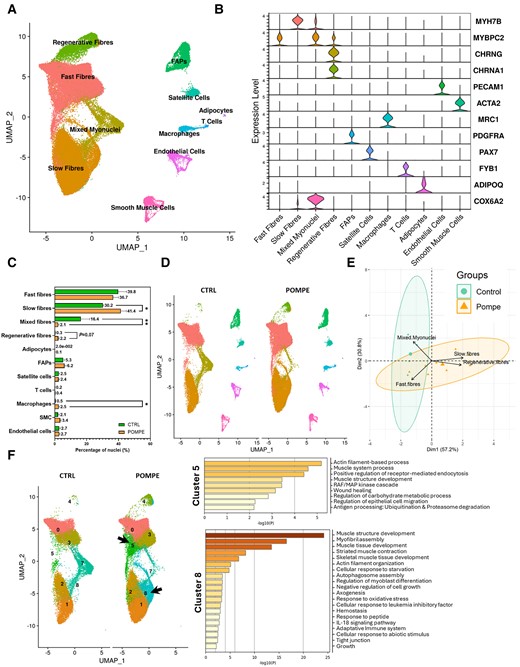
Repartition of cell types in control and Pompe muscle samples. (A) UMAP visualization of all the nuclei from control and Pompe samples coloured by cell identity. Control, n = 4; Pompe, n = 8. (B) Violin plots showing the expression of selected marker genes for each cluster of nuclei. (C) Percentage of nuclei for each cell population between control and Pompe samples. Control, n = 4; Pompe, n = 8. Mann–Whitney U-test; *P < 0.05 and **P < 0.01. (D) UMAP showing clusters identified in control (left) and Pompe (right) samples coloured by cell identity. Control, n = 4; Pompe, n = 8. (E) Principal component analysis showing the distribution of individuals based on the proportion each population of myonuclei. (F) Left: UMAP showing only the myofibre clusters, before assigning identity in A, in control and Pompe disease samples. Clusters 5 and 8 (fast and slow fibres, respectively) appear in Pompe samples. Right: Metascape analysis of the most expressed genes in Clusters 5 and 8. Only genes upregulated with a log2 fold change of >0.5 were analysed. Control, n = 4; Pompe, n = 8. FAPs = fibro-adipogenic progenitor cells; UMAP = uniform manifold approximation and projection.
Differences in cell populations between control and Pompe disease samples
We identified significant differences in the proportion of each cell population when comparing control and Pompe disease samples, as shown in Fig. 1C and D, Supplementary Table 2 and Supplementary Fig. 4. Specifically, we observed a significant increase in the percentage of nuclei expressing markers of slow (type I) muscle fibres (41.4% Pompe disease versus 30.2% controls, P = 0.048, Mann–Whitney U-test) and a trend to an increase in the percentage of nuclei expressing markers of regenerative fibres (2.2% Pompe disease versus 0.3% controls, P = 0.07, Mann–Whitney U-test) in Pompe disease compared with controls. There was a significant decrease in the mixed fibres cluster expressing genes encoding components of the ribosome and mitochondria in Pompe disease (2.1% Pompe disease versus 16.3% controls, P = 0.008, Mann–Whitney U-test). Except for macrophages, which showed an increase in Pompe disease (2.4% Pompe disease versus 0.5% controls, P = 0.002, Mann–Whitney U-test), we did not identify differences in the population of mononuclear cells. We validated these results using immunohistochemistry and immunofluorescence (Supplementary Fig. 5). Principal component analysis revealed a similarity in cell population among individual samples in controls, whereas there was a greater variability in the Pompe disease samples (Fig. 1E and Supplementary Table 2). Control samples were closely located in the principal component analysis map, whereas the samples from Pompe disease patients showed a wider distribution (Fig. 1E).
To gain a better understanding of the differences between Pompe disease and controls, we looked at individual clusters inside cell clusters of myonuclei. For example, cluster 5, which expressed genes of fast fibres and cluster 8, which expressed genes of slow fibres, were mainly observed in Pompe disease samples but not in controls (Fig. 1F). We carried out a comprehensive examination of gene expression profiles of these two clusters, comparing Pompe disease and control samples using Metascape. Interestingly, the analysis of cluster 5 unveiled an upregulation of genes involved in ubiquitination and proteasome degradation molecular pathways. Cluster 8 showed an upregulation of genes involved in autophagosome assembly, axonogenesis, response to oxidative stress and inflammation, among others.
Muscle samples from Pompe disease patients do not show prominent signs of regeneration
Previous studies demonstrated impaired muscle regeneration in Pompe disease attributable to deficient satellite cell (SC) activation.21,22 Given that we identified a trend to an increase in the number of regenerative fibres in Pompe and no differences in the number of SCs, we wanted to evaluate in detail the regenerative process in Pompe tissue. Initially, we examined the expression of genes involved in myogenesis, such as MYOG, MYF5 and MYOD1, and those involved in SC quiescence, such as PAX7, BTG2 and CALCR (Supplementary Figs 5B and 6A). We observed a slight increase in the expression of PAX7, MYOG, MYOD1 and CALCR and a decrease of BTG2 expression in Pompe disease, suggesting that there is an activation of SCs in Pompe disease to some extent. Then we decided to explore the communication between SCs and other cell clusters, specifically muscle fibres, using the CellChat R package. Our analysis revealed an increase in the number of interactions between regenerative fibres and SCs, suggesting active communication between these two clusters. (Fig. 2A–C). However, when examining the incoming signals to SCs in Pompe disease samples, we observed a decrease in FN1, EGF, L1CAM, HSPG and FGF, which are involved in the proliferation, differentiation and migration of SCs (Fig. 2D). In light of these results, we decided to study the expression of molecules that are classically involved in the activation of SCs. Expression of HGF, a heparin-binding glycoprotein essential for SC activation and proliferation,23-25 showed no significant changes (Supplementary Fig. 6C). We also looked at nitric oxide synthase (NOS), which is responsible for producing nitric oxide, known to promote SC activation by increasing MMP2.24,26 Pompe muscle fibres exhibited increased NOS1 expression, but MMP2 expression remained unchanged in comparison to the control group (Supplementary Fig. 6C). To study oxidative stress response in muscle fibres further, we analysed the NADPH-oxidase subunits CYBA, CYBB and NCF4 and found no differences between controls and Pompe disease samples (Supplementary Fig. 6D). TXN, a redox protein guarding against oxidative damage,27 showed reduced expression, and SOD1, an antioxidant enzyme, exhibited a significant decrease in Pompe disease (Supplementary Fig. 6C). We also explored the expression of interleukin-6 (IL-6) and vascular endothelial growth factor (VEGF); although IL-6 expression levels remained stable, VEGFA showed a significant increase in all cell populations (Supplementary Fig. 6D). Regarding insulin-like growth factor (IGF), which is crucial for organ development and regeneration, both the gene encoding IGF1 and its receptor IGF1R exhibited increased expression in Pompe disease samples (Supplementary Fig. 6B and D). Finally, FGF6, expressed primarily in myogenic cells during muscle regeneration, showed increased expression, but its receptor, FGFR1, remained unchanged in comparison to the control group (Supplementary Fig. 5B and D). All these data suggest that although there is an activation of the muscle regenerative programme in Pompe disease, this does not represent a hallmark of the disease as has been seen in other muscle disorders, such as Duchenne muscular dystrophy.12

Cell–cell communication of satellite cells using CellChat. (A) Heat map of the differential number of interactions between cell types in Pompe disease versus controls. Bars indicate outgoing signalling from each cell, and columns indicate incoming signals. Red squares indicate increased signalling in Pompe, and blue squares indicate increased signalling in controls. (B) Circle plots showing the differential number of ligand–receptor interactions between pairs of cell populations in Pompe disease versus controls. The strength of L-R interactions between cell population pairs is visualized, with the number of L-R pairs labelled, and edge width is proportional to the number of L-R pairs. Red indicates increased signalling in Pompe, and blue indicates increased signalling in controls. (C) Chord diagram showing signals received by satellite cells from muscle fibres, regenerative fibres and macrophages in control and Pompe muscles. (D) Heat map of outgoing or incoming communications of satellite cells in control and Pompe muscles. The coloured bar represents the relative signalling strength. C = Control; FAPs = fibro-adipogenic progenitor cells; L-R = ligand–receptor; P = Pompe.
Gene expression profile of myofibres reveals differences between Pompe disease and controls
We investigated the changes in the expression of individual genes in the Pompe disease myonuclei compared with controls. We found that 126 genes were upregulated with a log2 fold change of >0.5 in Pompe disease patients. Notably, these upregulated genes included CHRNG, FGF9, MYH6 and RUNX2, which are associated with muscle and connective tissue development, NCAM1, involved in axonogenesis, and FOSL2, associated with the immune response. Conversely, 360 genes were downregulated with a log2 fold change below −0.5. Interestingly, most of these genes were related to ATP synthesis and mitochondrial function (ATP5F1E, ATP5F1A, ATP5F1C, NDUFA6 and COX5B) and translation (EEF1G, EEF1B2, RPL6, RPL10 and RPL11) (Fig. 3A). Consistent with these results, we observed the frequent presence of COX-negative fibres in the samples from Pompe patients (Fig. 3B).
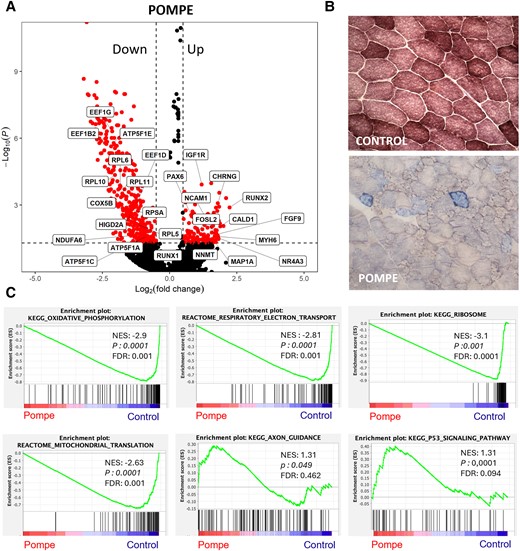
Mitochondrial dysfunction in Pompe muscle samples. (A) Volcano plot of log2 fold change and −log10(P) of Pompe genes compared with control. Control, n = 4; Pompe, n = 8. (B) Representative images of combined cytochrome c oxidase and succinate dehydrogenase (SDH/COX) staining, markers of mitochondrial dysfunction, from control and Pompe muscle samples, with COX-negative fibres stained in blue (×20 magnification). (C) GSEA plots showing enrichment score (ES) of the significant enriched hallmark gene sets in myonuclei. A positive value of ES indicates enriched in Pompe disease, and a negative value indicates enriched in controls. Control, n = 4; Pompe, n = 8. FDR = false discovery rate; GSEA = gene set enrichment analysis; LOPD = late-onset Pompe disease; NES = normalized enrichment score.
GSEA analysis revealed multiple dysregulated pathways in muscle fibres from Pompe patients compared with controls (Fig. 3C, Table 2 and Supplementary Tables 3 and 4). The most consistent feature was a downregulation of genes encoding components of the mitochondria or genes encoding proteins involved in ATP generation. Additionally, we observed a downregulation of pathways related to the RNA translation process, probably owing to the downregulation of genes encoding components of the ribosome. Several metabolic pathways, including glycolytic, fatty acid and amino acid metabolism, were dysregulated. We observed an increase in the expression of genes encoding proteins involved in anchoring muscle fibres to the extracellular matrix or adherens junction components, which might be attributable to the presence of regenerative fibres. Additionally, we found increased expression of neuromuscular junction and axon guidance genes, which could indicate muscle regeneration or loss of motor neuron terminals, as previously described in Pompe disease.28,29 Finally, we also observed an increase in genes associated with the p53 pathway, which are involved in the control of the cell cycle and apoptosis.
GSEA analysis using KEGG pathway in fast and slow myonuclei
| KEGG pathway | P-value | FDR | NES | Top genes |
|---|---|---|---|---|
| Upregulated | ||||
| Extracellular matrix receptor interaction | 0.0001 | 0.107 | 1.82 | ITGA5, LAMA3, COL6A6 |
| Adherens junction | 0.0001 | 0.072 | 1.79 | IGF1R, LMO7, FER |
| Neuroactive ligand receptor interaction | 0.0001 | 0.083 | 1.72 | CHRNG, CYSLTR1, P2RX7, CHRND |
| P53 signalling pathway | 0.0001 | 0.094 | 1.67 | SESN3, MDM4, CCNE2 |
| Viral myocarditis | 0.016 | 0.208 | 1.54 | HLA-DMB, ICAM1, HLA-DMA |
| Cell adhesion molecules | 0.023 | 0.463 | 1.39 | SIGLEC1, HLA-DMB, ICAM1 |
| Nod-like receptor signalling pathway | 0.030 | 0.476 | 1.36 | NOD1, CARD8, NAIP |
| Axon guidance | 0.049 | 0.462 | 1.31 | NFATC4, SEMA6A, SEMA3G |
| Focal adhesion | 0.0001 | 0.531 | 1.23 | IGF1R, HGF, MYLK |
| Downregulated | ||||
| Ribosome | 0.0001 | 0.0001 | −3.11 | RPS15A, RPS26, FAU |
| Oxidative phosphorylation | 0.0001 | 0.0001 | −2.87 | NDUFB3, COX7B, ATP5MC1 |
| Proteasome | 0.0001 | 0.0001 | −2.13 | POMP, PSMF1, PSMB6 |
| Citric acid cycle | 0.0001 | 0.0001 | −2.01 | SDHB, SDHD, SUCLG1 |
| RNA polymerase | 0.0001 | 0.0001 | −2.00 | POLR3K, POLR2K, POL2RL |
| Glycine, serine and threonine metabolism | 0.0001 | 0.001 | −1.91 | PHGDH, SHMT1, CTH |
| Gluthatione metabolism | 0.0001 | 0.001 | −1.90 | GSTM5, GPX4, IDH2 |
| Glycolysis–gluconeogenesis | 0.0001 | 0.002 | −1.89 | ENO3, BPGM, ALDOA |
| Drug metabolism cytochrome P450 | 0.001 | 0.003 | −1.85 | GSTM5, GSTO1, GSTM4 |
| Pyruvate metabolism | 0.001 | 0.003 | −1.84 | LDHD, PC, MDH2 |
| Lysosome | 0.0001 | 0.003 | −1.83 | ATP6V0B, LAPTM4A, DNASE2 |
| Valine, leucine and isoleucine degradation | 0.001 | 0.004 | −1.80 | ECHS1, HSD17B10, BCKDHA |
| Glycosilphosphatidylinositol biosynthesis | 0.01 | 0.016 | −1.68 | PIGP, DPM2, PIGZ |
| Protein export | 0.004 | 0.022 | −1.64 | SPCS1, SRP14, SRP9 |
| Cysteine metabolism | 0.04 | 0.086 | −1.49 | GOT2, ADI1, CTH |
FDR = false discovery rate; GSEA = gene set enrichment analysis; NES = normalized enrichment score.
Pompe muscle fibres exhibit altered gene expression in metabolic pathways
Given that slow and fast muscle fibres exhibit different metabolic signatures in physiological conditions, we compared the metabolic gene expression profiles of these muscle fibre subtypes between control and Pompe disease samples. Initially, we identified 1354 genes allocated by KEGG to different metabolic pathways and generated a new subset of the slow/fast myonuclei (Supplementary Fig. 7). We observed a reduction in the proportion of nuclei expressing genes involved in oxidative phosphorylation and in glycolysis and an increase in the proportion of nuclei expressing genes involved in lipid and amino acid metabolism in Pompe disease muscle fibres. Accordingly, we observed a reduction in the expression of genes involved in metabolism of carbohydrates in fast fibres and an increase in the expression of genes involved in metabolism of lipids, amino acids, glycans and nucleotides in both slow and fast muscle fibres (Fig. 4A). A heat map displaying gene expression of metabolic pathways split by fast and slow fibres (Fig. 4B) showed an increase in pathways such as the metabolism of arginine and proline and the degradation of lysine and fatty acids in Pompe disease. Biopsies from Pompe disease patients showed an accumulation of lipids in muscle cells containing vacuoles (Fig. 4C), which could support dysregulated lipid metabolism.
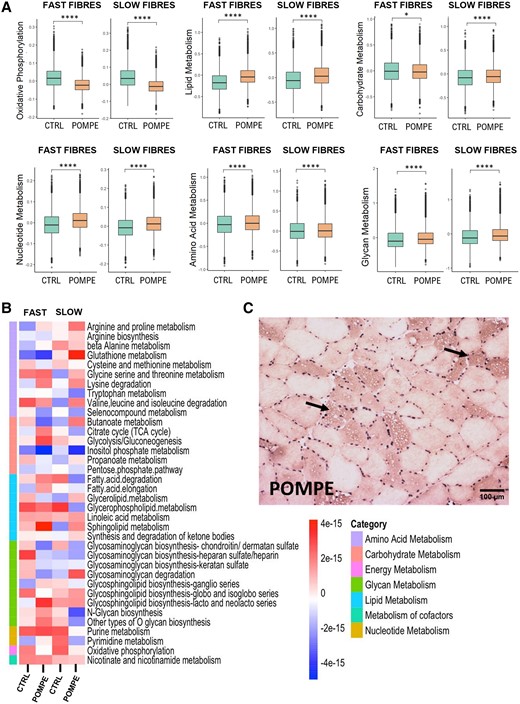
Metabolic changes observed between control and Pompe muscle samples. (A) Box plot of different metabolic scores in slow and fast fibres between control and Pompe muscle samples. Control, n = 4; Pompe, n = 8. Wilcoxon test; *P < 0.05 and ****P < 0.0001. (B) Heat map displaying Z-scores of metabolic pathway activity in slow and fast fibres from control and Pompe muscle samples. Each row represents a specific metabolic pathway. The colour scale reflects the level of pathway activity, with warmer colours indicating higher activity and cooler colours denoting lower activity. Control, n = 4; Pompe, n = 8. (C) Oil Red staining of Pompe disease muscle; arrows indicate lipid accumulation. UMAP = uniform manifold approximation and projection.
Pompe disease muscle fibres display dysregulated autophagy
In Pompe disease, the build-up of glycogen in lysosomes disrupts autophagy in muscle tissue. We generated an autophagy-related pathway score by using the web platform KEGG. We observed a significant increase in the expression of multiple genes involved in lysosomal function, mTOR and AKT signalling, supporting a dysregulation of autophagy in Pompe disease fibres (Fig. 5A). To analyse the genes responsible of autophagy, we investigated the expression of genes that had previously been described as being dysregulated in Pompe disease (Fig. 5B). Specifically, we focused on genes involved in the PI3K-III complex I, including beclin 1 (BECN1) and ATG14, which are crucial regulators of the initiation of autophagy. Our analysis revealed no significant difference in beclin 1 expression but a significant increase in ATG14 expression in Pompe disease. Additionally, we observed a significant upregulation of both MAP1LC3A and MAP1LC3B, which participate in the formation of autophagic vesicles, and ATG7, which facilitates the conversion of LC3-I into its lipidated form. Next, we examined the subunits of mTORC1 and AMPK, two major nutrient-sensing kinases that cooperate and exert opposing regulatory effects on cellular metabolism and autophagy. We found an upregulation of genes encoding mTOR and the alpha and gamma subunits of AMPK. These subunits catalyse phosphorylation of the downstream targets and determine the subcellular localization of AMPK. We did not observe an increase in transcription of the autophagy substrate SQSTM1/p62, a marker of autophagic flux.
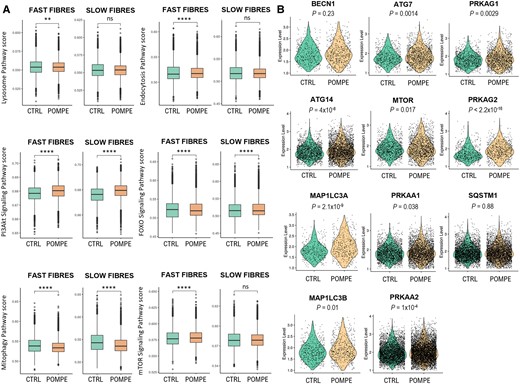
Autophagic changes observed between control and Pompe muscle samples. (A) Box plot of autophagy-related pathway score in slow and fast fibres between control and Pompe muscle samples. Control, n = 4; Pompe, n = 8. Wilcoxon test; *P < 0.05 and ***P < 0.0001. (B) Violin plot showing the expression levels of several genes involved in different stages of autophagy. Each point represents a nucleus. Control, n = 4; Pompe, n = 8. The P-values are from the Wilcoxon test.
Spatial transcriptomics suggest a sequence of biological events
GeoMx analysis allowed us to study the gene expression profile of vacuolated and non-vacuolated Pompe muscle fibres and compare it with muscle fibres from age- and sex-matched controls (Fig. 6A). A comparison between non-vacuolated Pompe and control muscle fibres (Fig. 6B and C) revealed what can be considered as the earliest changes in the transcriptome: upregulation of genes involved in metabolism of lipids, response to oxidative stress and regulation of the MAPK cascade and downregulation of genes involved in glucose metabolism and metabolism of RNA. A comparison of vacuolated versus non-vacuolated muscle fibres in Pompe disease muscle samples revealed upregulation in the vacuolated fibres of genes involved in reorganization of the extracellular matrix, adipogenesis and muscle regeneration and downregulation of genes involved in the production of energy, protein synthesis and calcium handling and genes encoding several structural muscle proteins of the contractile system.
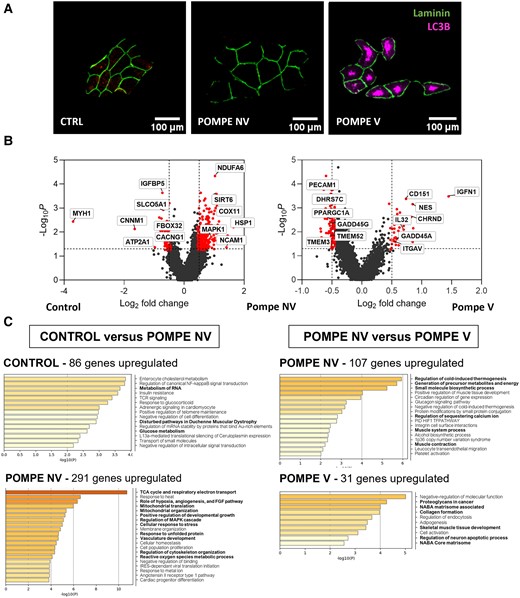
High-resolution spatial transcriptomics application in late-onset Pompe disease. (A) Representative images of region of interest of control, Pompe non-vacuolated (NV) and Pompe vacuolated (V) fibres. Fibre contour and autophagic vacuoles were stained with anti-laminin (green) and anti-LC3B (red) antibodies, respectively. Scale bars = 100 μm. (B) Volcano plots of log2 fold change and log10P-value of Pompe non-vacuolated (NV) genes compared with control (left); and volcano plots of log2 fold change and log10P-value of Pompe vacuolated (V) genes compared with Pompe NV (right). (C) Metascape results for enriched pathways in upregulated genes for Pompe NV versus control and for Pompe V versus Pompe NV. Mann–Whitney U-test. Control, n = 4; Pompe NV, n = 35; Pompe V, n = 32.
Characterization of myofibre gene expression profile reveals changes between Pompe and Pompe + ERT
Muscle samples from two patients before and after 1 year of ERT (Pompe 7 and Pompe 8) were included in the analysis. Upon ERT treatment, Patient 7 exhibited an increase in the number of nuclei expressing genes associated with regenerative fibres, although this change was not observed in Patient 8 (Supplementary Fig. 8A and B and Supplementary Table 2). Patient 7, a female, was 58 years of age when the first biopsy was performed. At the time of the second biopsy, an increase of 40 m in the 6-min walk test and 2% increase in forced vital capacity were documented (Supplementary Table 5). In 52-year-old male Patient 8, the percentage of regenerative fibres decreased from 4% to 1.5% in the second biopsy (Supplementary Table 2); his 6-min walk test showed an increase of 60 m, although his forced vital capacity worsened by 3% 1 year after starting the therapy. ERT appeared to shift amino acid and glycan metabolism closer to control samples in both fast and slow fibres. Of note, in the slow fibres, this trend was observed for all metabolic pathways (Supplementary Fig. 8B). Finally, our results showed that ERT partly restored the expression of genes involved in autophagy/mitophagy, endocytosis, AKT and FOXO signalling (Supplementary Fig. 8C).
Discussion
We have combined snRNAseq and spatial transcriptomics to perform a comprehensive investigation into the gene expression profile of muscle samples of Pompe disease patients and age- and sex-matched healthy controls. Our findings provide a better understanding of the pathophysiology leading to muscle degeneration in Pompe disease in humans. We have revealed significant differences in the cell populations in Pompe muscles and in their gene expression profile in comparison to controls. Multiple molecular pathways involved in the regulation of cell metabolism, mitochondrial function, ribosomal activity, muscle fibre regeneration and autophagy were dysregulated in the diseased muscle. Furthermore, our results suggest that some of these changes are partly restored following ERT.
One of the main findings in our study is an increase in slow-twitch type I fibres and a decrease in fast-twitch type II fibres in patients with Pompe disease. Fast fibres are characterized by a high glycolytic activity and an abundance of enzymes crucial for glucose metabolism. It appears that the inability of fast fibres to convert glycogen into glucose efficiently leads to a switch of fast to slow type in order to find new resources to fill the energy demands. Our findings indicate that alternative metabolic pathways, specifically lipid and protein degradation, become essential to provide the energy for cellular functioning. Notably, activation of these alternative metabolic pathways occurs early in the disease progression, even in non-vacuolated fibres that exhibit normal morphological characteristics. These findings raise the possibility that in the diseased muscle, the sensing of glucose availability by cytosolic proteins might happen even at the early stage of insufficient lysosomal efflux of glucose, leading to activation of alternative metabolic pathways to generate ATP. Indeed, emerging evidence from in vitro studies (unrelated to Pompe disease) supports this hypothesis: it has been recently demonstrated that aldolase, a critical glycolytic enzyme, also serves as a sensor of both low and high glucose levels.30 Importantly, in low-glucose conditions, aldolase was shown to trigger AMP/ADP-independent AMPK activation by promoting the formation of a lysosomal complex that is required for the activation of this kinase.31 Previous studies using proteomic and bulk RNA analysis in Pompe muscle samples, in addition to proteomic and lipidomic analysis of plasma from Pompe disease patients, have consistently highlighted alterations in glycolysis and phospholipid metabolism.32-34 Among the altered metabolic pathways, we have observed a significant activation of the metabolism of proline and arginine, which are increasingly recognized as critical amino acids in bioenergetics, cellular redox regulation or apoptosis.35 However, the shift in metabolic pathways does not seem to counterbalance inefficient ATP production. We found an overall decrease in the expression of genes involved in mitochondrial structure, function and ATP synthesis. These suggest compromised mitochondrial function, resulting in compromised oxidative phosphorylation.34,36 Furthermore, the reduced expression of genes encoding structural components of the mitochondria combined with reduced expression of genes involved in mitophagy could contribute to the accumulation of old dysfunctional mitochondria, as has been shown by several reports.7,36,37 Mitochondrial dysfunction is a common trait of lysosomal storage diseases,38 suggesting that a deficiency in mitochondrial renewal is common when autophagy is blocked. Interestingly, ERT partly reversed the metabolic changes and improved oxidative phosphorylation in the two patients whose muscle biopsies before and after treatment were available, supporting what was previously reported in a larger group of samples from LOPD and infantile-onset Pompe disease.33,39 Overall, our findings suggest that muscle fibres enter a catabolic state, characterized by an enhanced breakdown of complex molecules to release energy and a reduced production of new molecules. The downregulation of genes encoding structural components of the ribosomes and genes involved in DNA/RNA processing might explain the diminished biosynthetic activity in the diseased muscle.
Given that abnormal autophagy is one of the hallmarks of Pompe disease, we investigated whether it is controlled at the transcriptional level.8 Our results showed an increase in the expression of some genes controlling the formation of the autophagosome,40 such as ATG14, MAP1LC3B or ATG7, suggesting that the energy shortage in cells forces them into a starvation state, prompting the initiation of autophagy. However, it is worth noting that in Pompe disease, unlike what happens in healthy muscles, the autophagy process is stalled owing to the impaired autophagosomal–lysosomal fusion (a condition known as autophagic block).2 This blockage results in the build-up of autophagic vacuoles in muscle fibres, which, in turn, leads to the accumulation of an autophagic substrate, p62/SQSTM1.9 Of note, we did not observe an increase in transcription of SQSTM1/p62, neither in the snRNAseq nor in the GeoMX study, suggesting that the accumulation of this protein in the diseased muscle fibres results from its reduced autophagic degradation. It is well established that autophagy is controlled at both the transcriptional and post-transcriptional levels.41,42 Hence, it is not unexpected that some of the genes associated with this process are not increased in our analysis. One of the main advantages of snRNAseq is that it allows the study of gene expression in individual nuclei. Here, we have consistently observed that not all myonuclei in Pompe samples express high levels of genes involved in the process of autophagy; the upregulation is limited to a subgroup of them. This result was somewhat expected, because muscle specimens from Pompe patients display a mix of muscle fibres: autophagic build-up is prominent in some of them but not others.
We observed a modest increase (not significant) in the number of regenerative muscle fibres in Pompe samples. This result is in line with our finding of an upregulation of genes encoding proteins that anchor muscle fibres to the extracellular matrix or adherens junction components, as evidenced by gene set enrichment analysis. Furthermore, we found increased expression of genes encoding components of the neuromuscular junction or involved in axon guidance, which could indicate muscle regeneration or loss of motor neuron terminals.28,29 However, the increase of this regenerative signature in Pompe disease is much weaker than the one observed in other muscle diseases, such as Duchenne muscular dystrophy.12 The impaired muscle regeneration in Pompe disease has been attributed to the inefficient activation of SCs.22 This hypothesis is based on the observation of reduced expression of regeneration markers and the lack of increase in the number of SCs during disease progression in muscle samples of patients with Pompe disease.21,22 We observed a slight increase in genes involved in SC differentiation in Pompe samples, but when analysing the expression of factors classically involved in activation of SCs, we could not identify a significant increase in any of them. In fact, the regenerative genetic profile in Pompe disease was far less significant that what we have observed in Duchenne muscular dystrophy, suggesting that although present, muscle regeneration is not a prominent hallmark of Pompe disease. Other authors have shown that GAA-deficient SCs retain their capacity to proliferate and differentiate in vitro and to regenerate skeletal muscles efficiently after chemical injury, suggesting that this modest muscle regeneration signature in Pompe could be explained by the failure of sufficient SC activation and altered communication between SCs and regenerative fibres.21,43 Pompe disease muscles are characterized by limited fibre necrosis, which could explain the paucity of released molecular signals capable of activating SCs. Our GeoMX analysis has revealed that genes involved in skeletal muscle tissue development are found only in vacuolated fibres, suggesting that this is a later event in disease progression. The number of macrophages, which also participate in the release of molecules that can activate SCs, was only slightly increased in comparison to the robust response in other muscular diseases, such as Duchenne muscular dystrophy.44 In addition, we observed an increase in the expression of genes involved in oxidative stress, shown to be involved in the pathogenesis of Pompe disease.45,46 This increase was most prominent in the vacuolated fibres, suggesting that the accumulation of autophagic vacuoles triggers this response.
The analysis of two samples from ERT-treated patients showed that the treatment appears to restore metabolism closer to that of control samples. Intriguingly, this metabolic change was observed only in slow fibres. Moreover, in one patient, the post-ERT muscle biopsy showed an increase in the proportion of nuclei expressing genes associated with muscle regeneration, which is not totally surprising, because his second biopsy showed an increase in the number of vacuolated fibres, reinforcing the idea that production of a pro-regenerative signal is a late event in Pompe pathophysiology linked to the accumulation of vacuoles in the muscle fibres, as confirmed by our GeoMx results. However, it is important to exercise caution when interpreting these results, given the limited sample size and considerable variability.
Our study did not include muscle samples from patients affected by other muscle diseases, which is a limitation of our present work. Including such comparative data would provide a clearer understanding of the specificity of our findings. Future studies will aim to incorporate samples from various myopathies and dystrophies to validate and extend our observations. This comparative approach will help to distinguish between disease-specific markers and common pathological features. A further limitation of our study is the high heterogeneity among the samples in terms of genetics, particularly for the second mutation, in addition to the different ages at which muscle biopsies were taken. This variability can introduce differences in gene expression profiles, potentially affecting the consistency and interpretability of our findings. Future studies should aim to include a more homogeneous sample set, providing a clearer understanding of the molecular and cellular mechanisms underlying Pompe disease.
This study is the first application of snRNAseq and spatial transcriptomics to analyse skeletal muscle samples from patients with Pompe disease. These techniques allowed us not only to identify the molecular changes but also to understand how these changes evolve in the course of disease progression. The study revealed the transcriptional heterogeneity within the nuclei in Pompe muscle fibres and the presence of nuclear populations associated with the disease. We have identified two clusters of nuclei (clusters 5 and 8) showing prominent pathological signatures that are mainly present in Pompe samples. These data are confirmed by the spatial transcriptomics analysis, which revealed a distinct genetic signature in control fibres, non-vacuolated and vacuolated muscle fibres, thus allowing us to provide an insight into the spatiotemporal dynamics of gene expression in Pompe muscle.
Conclusion
In conclusion, we used two new transcriptomics techniques, snRNAseq and GeoMX, to examine muscle biopsies from Pompe patients and matched healthy controls. The analysis revealed a mild but significant increase in slow fibres and macrophages in the diseased muscle. We have identified a heterogeneous genetic signature in myofibre nuclei, suggesting that the molecular changes are not occurring at the same time in all fibres and might be influenced by the accumulation of autophagic vacuoles, among other factors. Pathway analysis revealed a dysregulation of several metabolic pathways that can lead to diminished energy production and impaired protein synthesis. ERT showed potential to restore metabolic patterns, especially in slow fibres. These findings highlight significant cellular changes in Pompe disease and potential therapeutic avenues for intervention.
Data availability
All the raw data and processed data are available on request to the corresponding author.
Acknowledgements
We thank Matt Henderson (Muscle Immunoanalysis Unit, Dental Hospital, Newcastle upon Tyne, UK) for performing fibre-type staining procedures. We thank all the members of the basic research strand for their support in this work. This work was supported by the NIHR Newcastle Biomedical Research Centre. M.O., E.G., A.H.L., C.D., C.P. and E.R. are members of the ERN EURO-NMD.
Funding
This work has been funded by grants from Academy of Medical Sciences (Professorship Scheme, APR4/1007), Medical Research Council (MR/W019086/1), Fundación Isabel Gemio and Spark Therapeutics to J.D.-M.
Competing interests
The authors report no competing interests.
Supplementary material
Supplementary material is available at Brain online.
References
Author notes
Alexandra Monceau and Rasya Gokul Nath equally contributed to this work.

