


Abstract
Recessive SH3TC2 variants cause Charcot-Marie-Tooth disease type 4C (CMT4C). CMT4C is typically a sensorimotor demyelinating polyneuropathy, marked by early onset spinal deformities, but its clinical characteristics and severity are quite variable. Clear relationships between pathogenic variants and the spectrum of disease manifestations are to date lacking. Gene replacement therapy has been shown to ameliorate the phenotype in a mouse model of CMT4C, emphasizing the need for natural history studies to inform clinical trial readiness.
Data, including both genetic information and clinical characteristics, were compiled from the longitudinal, prospective dataset of the Inherited Neuropathy Consortium, a member of the Rare Diseases Clinical Research Network (INC-RDCRN). The Charcot Marie Tooth Neuropathy Score (CMTNS), Examination Score (CMTES) and the Rasch-weighted CMTES (CMTES-R) were used to describe symptoms, neurological examinations and neurophysiological characteristics. Standardized response means were calculated at yearly intervals and a mixed model for repeated measures was used to estimate the change in CMTES and CMTES-R over time.
Fifty-six individuals (59% female), median age 27 years (range 2–67 years) with homozygous or compound heterozygous variants in SH3TC2 were identified, including 34 unique variants, 14 of which have not previously been published. Twenty-eight participants had longitudinal data available. While there was no significant difference in the CMTES in those with protein truncating versus non-protein truncating variants, there were significant differences in the mean ulnar nerve compound muscle action potential amplitude, the mean radial sensory nerve action potential amplitude, and in the prevalence of scoliosis, suggesting the possibility of a milder phenotype in individuals with one or two non-protein-truncating variants. Overall, the mean value of the CMTES was 13, reflecting moderate clinical severity. There was a high rate of scoliosis (81%), scoliosis surgery (36%), and walking difficulty (94%) among study participants. The CMTES and CMTES-R appeared moderately responsive to change over extended follow-up, demonstrating a standardized response mean of 0.81 standard deviation units or 0.71 standard deviation units, respectively, over 3 years.
Our analysis represents the largest cross-sectional and only longitudinal study to date, of the clinical phenotype of both adults and children with CMT4C. With the promise of upcoming genetic treatments, these data will further define the natural history of the disease and inform study design in preparation for clinical trials.
Introduction
Charcot-Marie-Tooth disease (CMT) is a clinically and genetically diverse family of inherited peripheral neuropathies. These neuropathies lead to weakness and sensory loss resulting in gait and balance impairment, hand dysfunction, decreased ability to perform activities of daily living and reduced quality of life and disability.1,2 Charcot-Marie-Tooth 4C (CMT4C) is an autosomal recessive form of CMT due to bi-allelic variants in the SH3 domain and tetratricopeptide repeats 2 (SH3TC2) gene. Though typically classified as a demyelinating form of CMT, in some cases upper limb motor nerve conduction velocities >38 m/s are seen.3 It is among the most common recessive subtypes of CMT.4,5 It is often severe and is marked by some characteristic features, such as frequent early onset spinal deformities and occasional cranial nerve deficits.6,7 The gene SH3TC2 encodes for a protein that affects receptor dynamics by regulating endosome recycling in myelinating Schwann cells.8,9 The most prevalent pathogenic SH3TC2 variants are Arg954Ter (especially North African, Dutch and French Canadian populations) and Arg1109Ter (commonly found in the Spanish Romani population), likely due to founder effects.10–12In vitro studies have shown that both the more common protein truncating variants (nonsense and frameshift variants ending in premature stop codon) and a selection of rarer missense variants lead to loss of the SH3TC2 protein in endosomes. For missense variants this appears to be related to loss of trafficking to the endosome.13 Animal models demonstrate loss of integrity of the node of Ranvier and hypomyelination.9 A loss-of-function mechanism is consistent with recessive inheritance but on its own does not explain the wide spectrum of phenotypes observed in CMT4C.14 Understanding genotype-phenotype correlations is critical for furthering our knowledge of the natural history and pathophysiology of this disease.
As our understanding of the genetics of inherited neuropathies has increased and new therapeutic methods, such as gene replacement therapy, RNA interference, antisense oligonucleotide and other genetic approaches have become available, inherited neuropathies have become a target for therapeutic intervention.15,16 Gene replacement is particularly attractive for recessive loss-of-function neuropathies and has already been shown to ameliorate the phenotype of a mouse model of CMT4C.17 Clinical trial readiness, including a detailed understanding of natural history, is therefore urgently needed for CMT4C, for translation of preclinical treatment. Currently, insight into genotype-phenotype relationships, clinical characteristics and the natural history of CMT4C has relied on mostly small and retrospective or cross-sectional case series.3,18–20 Larger scale, prospective, published, longitudinal studies of CMT4C are lacking. Characterization of the natural history and disease progression of CMT4C using accepted CMT-specific outcomes measures including the Charcot-Marie-Tooth Disease Neuropathy Score (CMTNS) and its widely used clinical component, the CMT Exam Score (CMTES), is critical to inform clinical trial design.
The objective of this study is to use the prospective dataset of the Inherited Neuropathy Consortium Rare Disease Clinical Research Network (INC RDCRN) to characterize the disease spectrum and genotype-phenotype relationships in individuals with CMT4C, and to detail the natural history of CMT4C to enable clinical trial readiness.
Materials and methods
These prospective data were gathered by the INC RDCRN, a global network of 20 academic clinical centres that is collecting clinical and genetic data across types of inherited neuropathies. The INC RDCRN and institutional review/Ethics boards in participating centres or single IRB where applicable, approved this study. This study is registered at clinicaltrials.gov (NCT01193075). All registry and survey participants received and reviewed detailed information on the study and provided consent before any involvement in this study.
Study design, setting and patient population
Participants were evaluated at one of 13 study sites between 2009 to 2020. History and neurological examination data were collected, as well as nerve conduction studies when available. Individuals with a diagnosis of CMT4C, established by an appropriate clinical phenotype and either homozygous or compound heterozygous variants in SH3TC2, were included in this study. Genetic data were obtained via single gene testing, clinical gene panels or research whole exome sequencing and further analysed on the GENESIS platform.21 Most variants were known pathogenic or likely pathogenic variants by criteria of the American College of Medical Genetics and Genomics and the Association for Molecular Pathology.22 Participants with either homozygous or compound heterozygous variants of uncertain significance (VUSes) in SH3TC2, including VUSes favouring pathogenicity, although not classifiable as such with present data, were also included if a multi-disciplinary discussion including clinician experts in hereditary neuropathies concluded that a CMT4C diagnosis was the most likely cause of the phenotype, and if they lacked other identified potential causes of peripheral neuropathy. Further information about variants, as well as computational model prediction results, were obtained from the National Institutes of Health’s ClinVar archive as well as the Varsome platform.23,24 Individual variants were categorized as either protein truncating (nonsense, frameshift ending in pre-mature stop codon, and splice site variants) or non-truncating (missense variants).
Clinical and neurophysiological data acquisition
The CMTNS was used for clinical assessment. The CMTNS is a composite score based on symptom history, physical examination and electrophysiology, and a standardized, validated assessment for evaluation of disability in patients with CMT.25–27 The CMT Symptom Score (CMTSS) is from the symptom history portion of the CMTNS. The CMTES is the sum of the symptom history and examination portion of the CMTNS and has been validated as a standalone outcome measure in CMT.28 Higher scores for the CMTNS, CMTES and CMTSS indicate greater disease severity and disability. Baseline evaluations including the CMTNS or CMTES are obtained on each participant and at yearly intervals thereafter for as long as participants remained a part of the study. Nerve conduction studies including the ulnar or median motor and ulnar or radial sensory potentials were obtained using surface electrodes and standard techniques, and performed at a temperature maintained ≥32°C. Some paediatric participants, enrolled after 2012, were assessed with the CMT Pediatric Scale (CMTPedS), a validated measure of disability for individuals aged 3–20 years with CMT.29
Statistical analysis
Descriptive statistics were used to summarize and analyse history, neurological examination and electrophysiology data. CMTNS, CMTES and CMTSS scores were also converted into Rasch-modified scores (CMTNS-R, CMTES-R and CMTSS-R).28 For genotype group comparisons, the earliest available data were used. The pooled t-test was used for group mean comparisons. A Chi-square or Fisher’s exact test was conducted when appropriate for categorical comparisons. Spearman rank correlation coefficients were calculated to assess linear correlation. For participants with longitudinal CMTES data available, the mean change from baseline and standardized response mean [SRM = mean change/standard deviation (SD) change] at yearly intervals were computed to characterize the ability to detect change over time. To further understand the disease progression, mixed models for repeated measures (MMRM) were fitted on CMTES and Rasch-weighted CMTES data with categorical time effects. All analyses were conducted using SAS 9.4 (SAS Institute, Cary NC). Two-tailed hypotheses were used and a P-value ≤ 0.05 was considered significant.
Data availability
An aggregated anonymized dataset will be made available upon request and with an appropriate data sharing agreement.
Results
Clinical characteristics
A total of 56 participants from 52 families diagnosed with CMT4C were enrolled at 13 INC centres across the USA, UK, Italy and Australia. A total of 28 individuals had at least one additional annual longitudinal visit after their initial baseline visit. Ages of participants at time of study registration ranged from 2 to 67 years with a median age of 27 years. There were 16 participants under 18 years old at the time of study enrolment, 28 from ages 18 to 50 years, and 12 above 50 years.
The clinical characteristics of our cohort at their first visit are summarized in Table 1. The median age at onset of walking difficulty was 7 years. The mean CMTES was 13.0 or 17.1 when Rasch-weighted, reflecting overall moderate clinical severity (for non-Rasch weighted scores, mild 0–8, moderate 8–16, and severe >16). For eight of the participants below the age of 20 years who had a CMTPedS score assessed, the mean score was 23, reflecting overall moderate clinical severity (0–14 mild, 15–29 moderate, 30–44 severe). Walking difficulty was common with 94% of participants describing difficulty, 59% using orthotic aids, and 21% requiring a wheelchair. The CMTES and CMTES-R correlated at study entry with the time since onset of walking difficulty (CMTES: R = 0.41, P < 0.01; CMTES-R: R = 0.44, P < 0.01; Fig. 1). Scoliosis was reported in 81% of participants, while hearing loss was reported in 36% of participants. Further details are summarized in Table 1. How key clinical characteristics differ by age group are also summarized in Supplementary Fig. 1.

The relationship between the CMTES and CMTES-R at the time of study entry and years since reported onset of walking difficulty as an estimate of neurological symptom onset. The CMTES and CMTES-R at the baseline examination correlated with the number of years since the onset of walking difficulty (CMTES: R = 0.41, P < 0.01; CMTES-R: R = 0.44, P < 0.01).
Demographics and baseline clinical characteristics
| Demographics | n | |
|---|---|---|
| Total number of patients, n | 56 | 56 |
| Median age at baseline visit (IQR), n | 27 (16–48.25), 56 | 56 |
| Female, n | 33/56 (59%) | 56 |
| Race | ||
| Not reported, n | 5/56 (9%) | 56 |
| White, n | 45/56 (80%) | 56 |
| Asian, n | 5/56 (9%) | 56 |
| Black/African American, n | 1/56 (2%) | 56 |
| Ethnicity | ||
| Ethnicity | ||
| Not reported, n | 4/56 (7%) | 56 |
| Not Hispanic, Latino, or Spanish Origin, n | 50/56 (90%) | 56 |
| Hispanic, Latino, or Spanish Origin, n | 2/56 (4%) | 56 |
| Baseline clinical characteristics | ||
| Scoliosis, n | 42/52 (81%) | 52 |
| Scoliosis surgery, n | 20/56 (36%) | 56 |
| Hip dysplasia, n | 4/48 (8%) | 48 |
| Walking difficulty, n | 50/53 (94%) | 53 |
| Difficulty buttons, n | 32/50 (64%) | 50 |
| Difficulty utensils, n | 21/50 (42%) | 50 |
| Orthotic aids, n | 30/51 (59%) | 51 |
| Walking support, n | 14/51 (28%) | 51 |
| Wheelchair required, n | 11/52 (21%) | 52 |
| Didn’t walk before 15 months, n | 32/53 (32%) | 53 |
| Median age of onset of walking difficulty (IQR), n | 7 (3–13), 37 | 37 |
| Foot deformities, n | 41/51 (80%) | 51 |
| Hearing loss, n | 18/50 (36%) | 50 |
| Baseline CMTNS | ||
| Mean CMTES-weighted (SD) | 17.1 (7.1) | 46 |
| Mean CMTSS (SD) | 5.2 (2.9) | 46 |
| Mean CMTSS-weighted (SD) | 8.0 (4.4) | 46 |
| Mean CMTNS (SD) | 17.0 (6.8) | 46 |
| Mean CMTNS-weighted (SD) | 21.2 (7.8) | 46 |
| Mean CMTPedS (SD) | 23 (10.6) | 8 |
| Baseline electrophysiological data | ||
| Mean ulnar nerve motor NCV, m/s (SD); normal 50 m/s | 27.9 (9.0) | 39 |
| Mean ulnar nerve CMAP, mv (SD); normal 6 mV | 4.4 (2.0) | 39 |
| Mean median nerve NCV, m/s (SD); normal 50 m/s | 28.5 (10.1) | 29 |
| Mean median nerve CMAP, mV (SD); normal 4 mV | 4.1 (2.7) | 31 |
| Mean radial nerve SNAP, μV (SD); normal 15 μV | 7.3 (10.3) | 16 |
Demographic and baseline clinical data were obtained at study enrolment visit. Some individuals under 18 years of age also had a CMTPedS score performed in place of or in addition to a CMTES. All percentage values are rounded to the nearest whole number. IQR = interquartile range; NCV = nerve conduction velocity; SD = standard deviation.
Two participants had available sural nerve biopsy results; both were homozygous for the Arg954Ter variant. Findings on light microscopy included thinly myelinated fibres, decreased myelinated fibre density, and occasional onion bulbs. Electron microscopy was notable for abnormally attenuated and long Schwan cell processes and abnormal Remak bundles. These two biopsies have also been described as Patients II-1 and II-3 in a previous report.19
Genetic characteristics
We identified 34 unique variants (Supplementary Table 1) in 56 participants with CMT4C. Of these unique variants, 28 are considered pathogenic or likely pathogenic and six were classified as VUSes by the criteria of the American College of Medical Genetics and Genomics and the Association for Molecular Pathology.22 Fifty-two participants had two pathogenic or likely pathogenic variants, two participants harboured one pathogenic or likely pathogenic variant and one VUS that was suspected to be disease causing, and two participants were homozygous for a VUS suspected to be disease causing. Three of the 52 participants with two pathogenic or likely pathogenic variants had an additional third VUS (p.Leu238Arg, p.Met334Val, p.Arg227Trp) that was unlikely to be of clinical concern. Of the 32 unique variants believed to be disease causing, 14 have not been previously published in the peer-reviewed literature (c.1470_1473delCTTC, c.2128C>T, c.3230C>G, c.113delA, c.806G>A, c.3425_3435del, c.2528G>T, c.2617C>T, c.2039A>G, c.507C>A, c.870C>G, c.1922G>T, c.748_750delTAT, c.2072_2090del). Figure 2 shows the allele frequencies of each variant, the type of variant, and its position in the SH3TC2 exome transcript. The frequency of protein-truncating variants was 83%. The p.Arg954Ter was the most common variant (51% of the observed variants in our cohort)—19 individuals were homozygous and 23 compound heterozygous for this variant. Homozygous variants were observed in 48% of participants. There was one participant with a large deletion of exon 7 (94 bp), and two participants with a variant predicted to affect splicing (c.386–2A>C and c.806G>A). All previously unpublished variants, both those likely benign or potentially disease causing, are also summarized in Supplementary Table 2.
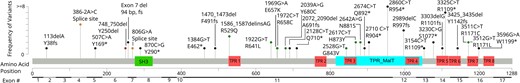
All variants included in this study arranged by cDNA position. The variant 286°C>T (R954*) was seen far more than any other variant, 61 times in this study. The figure has been truncated for legibility purposes. No other variant was seen more than seven times. Gene sequence and functional annotations data obtained from NCBI refseq, MANE isoform.30 Black = nonsense or out-of-frame variations; orange = splice site mutation; brown = in-frame deletion; green = missense.
Four variants had no previously documented evidence of pathogenicity. Participants with these variants are detailed more closely in Table 2, including predictions by computational algorithms.24 A homozygous p.Arg641Leu variant was found in one participant who had a typical phenotype including mild scoliosis and mildly slowed nerve conduction studies (ulnar nerve motor conduction velocity of 47 m/s). This variant also segregated with the disease—one unaffected parent and two unaffected siblings were heterozygous for this variant. A homozygous p.His873Tyr variant was found in one participant who had a typical phenotype including scoliosis and slightly slowed nerve conduction studies (ulnar motor nerve conduction velocity 48 m/s). This participant’s parents were unaffected, with a sibling suspected to be affected, suggesting a recessive pattern of inheritance, but segregation analysis was not available. A p.Tyr680Cys variant occurred as a compound heterozygous variant in addition to a known pathogenic variant (p.Arg954Ter). Segregation studies confirmed transmission in trans, and multiple unaffected family members were heterozygous carriers. The participant has a typical phenotype including scoliosis and moderately slowed nerve conduction studies (ulnar motor nerve conduction velocity 35 m/s). A p.Gly843Val variant occurred in one participant as a compound heterozygous variant in addition to a known pathogenic variant (p.Arg954Ter). This participant was adopted; thus, family history and segregation analysis were not available. The individual had a typical CMT4C phenotype, including scoliosis and moderately slowed nerve conduction studies.
Extended description of participants diagnosed with CMT4C with at least one VUS in SH3TC2
| Nucleotide change (VUS underlined) | Amino acid change | Presence in gnomAD | Trans arrangement | Segregation analysis | Computational algorithms | Age at baseline exam (years) | Ulnar nerve conduction velocity, CMAP amplitude | CMTES |
|---|---|---|---|---|---|---|---|---|
| c.1992G>T;1922G>T | p.Arg641Leu;Arg641Leu | Not present | N/A (homozygous) | Segregating phenotype | Predicted damaging by MetaSVM, MetaRNN, BayesDel addAF, DANN, EIGEN, FATHMM-MKL, LIST-S2, M-CAP, MutationAssessor, MutationTaster, and SIFT versus predicted benign by DEOGEN2, MVP and PrimateAI. | 41 | 47 m/s, 4.9 mV | 7 |
| c.2617C>T;2617C>T | p.His873Tyr;His873Tyr | Not present | N/A (homozygous) | Not performed | Predicted damaging by MetaLR, MetaSVM, FATHMM-MKL, LIST-S2, LRT, M-CAP, MVP, and SIFT versus predicted benign by BayesDel addAF, DEOGEN2, EIGEN, MutationAssessor, MutationTaster and PrimateAI. | 29 | 48 m/s, 9 mV | 6 |
| c.2039A>G;286°C>T | p.Tyr680Cys;Arg954Ter | Not present | Confirmed trans arrangement | Segregating phenotype | Predicted damaging by MetaRNN, REVEL, BayesDel_addAF, DANN, DEOGEN2, EIGEN, FATHMM-MKL, LIST-S2, M-CAP, MVP, MutationAssessor, MutationTaster and SIFT versus predicted benign by PrimateA | 48 | 35 m/s, 4.2 mV | 14 |
| c.2528G>T;286°C>T | p.Gly843Val;Arg954Ter | Not present | Not confirmed | Not performed | Predicted damaging by MetaLR, MetaSVM, MetaRNN, REVEL, BayesDel_addAF, DANN, DEOGEN2, EIGEN, FATHMM-MKL, LIST-S2, M-CAP, MVP, MutationAssessor, MutationTaster and SIFT versus predicted benign by PrimateAI | 28 | 15 m/s, 4.6 mV | 15 |
At time of publication these four variants in subjects diagnosed with CMT4C had not accumulated enough evidence to be considered likely pathogenic or pathogenic by American College of Medical Genetics and Genomics criteria. Evidence that has been obtained to date on each variant is provided. N/A = Not Applicable.
Genotype-phenotype correlations
We compared the phenotypes of 41 participants with two protein truncating variants to the 15 participants with one (n = 13) or no (n = 2) protein truncating variants. The mean amplitudes of the ulnar distal compound muscle action potential (CMAP) and radial sensory nerve action potential (SNAP) were significantly lower in the participants with two protein truncating variants (4.1 versus 5.8 mV, P = 0.04, and 5.4 versus 15.15 μV, P = 0.03, respectively); the CMTES and CMTSS, both Rasch-weighted and unweighted, were not significantly different. The proportion of participants with scoliosis was significantly higher in the two protein truncating variants group (87% versus 62%, P = 0.04). The proportion of participants who walked before the age of 15 months were diagnosed with hip dysplasia, reported difficulty walking, reported difficulty with hearing loss, or used orthotic aids or wheelchairs were not significantly different. Further details are summarized in Table 3.
Comparison and summary of baseline clinical characteristics classified by genotype, homozygous protein truncating versus those with at least one non-protein truncating variant
| Clinical characteristics | Two protein truncating variants | n | One or zero protein truncating variants | n | P-value |
|---|---|---|---|---|---|
| Walked before age 15 months | 55% | 40 | 77% | 13 | 0.20a |
| Scoliosis | 87% | 39 | 62% | 13 | 0.04b |
| Hip dysplasia | 11% | 36 | 0% | 12 | 0.56a |
| Difficulty walking | 95% | 39 | 93% | 14 | 0.83a |
| Orthotic aid use | 55% | 38 | 69% | 13 | 0.52a |
| Wheelchair use | 18% | 39 | 31% | 13 | 0.32b |
| Hearing loss | 37% | 38 | 33% | 12 | 1.00a |
| Mean age of onset of walking difficulty (SD) | 10.0 (4.4) | 31 | 13.7 (9.8) | 7 | 0.41c |
| Mean CMTES (SD) | 14.0 (5.6) | 33 | 10.6 (6.1) | 13 | 0.08c |
| Mean CMTES-W (SD) | 18.3 (6.7) | 33 | 14.2 (7.6) | 13 | 0.08c |
| Mean CMTSS (SD) | 5.6 (2.9) | 33 | 4.4 (2.7) | 13 | 0.21c |
| Mean CMTSS-W (SD) | 8.5 (4.4) | 33 | 6.6 (4.3) | 13 | 0.19c |
| Mean ulnar nerve conduction velocity m/s (SD) | 26.0 (7.4) | 22 | 31.1 (11.3) | 6 | 0.19c |
| Mean ulnar nerve CMAP mV (SD) | 4.1 (1.9) | 22 | 5.8 (1.9) | 6 | 0.04c |
| Mean radial nerve SNAP mV (SD) | 5.4 (9.0) | 27 | 15.5 (12.6) | 6 | 0.03c |
Data highlighted in bold indicate a statistically significant difference between those with two protein truncating variants and those with at least one non-protein truncating variant (P < 0.05). All percentage values are rounded to the nearest whole number.
Fisher’s exact test.
Chi-square.
t-test.
The two individuals who did not have at least one protein truncating variant (both were homozygous for a missense variant) were of particular interest. The first participant (p.Arg641Leu) had no scoliosis, a lower CMTES (seven at age 41) than average and a nearly normal ulnar motor nerve conduction velocity (47 m/s) though with reduced amplitude (ulnar CMAP: 4.9 mV). They reported walking before the age of 15 months but had current walking difficulty and required use of orthotics. The second (p.His873Tyr) had scoliosis, a lower CMTES (six at age 29) than average, an above average age of onset of walking difficulty (30 years), and a nearly normal ulnar motor nerve conduction velocity (48 m/s) with a normal ulnar CMAP amplitude (9 mV). This participant reported walking before the age of 15 months, current walking difficulty and no use of orthotics.
Clinical disease progression and longitudinal analyses
There were 28 participants who had at least one additional yearly visit after their initial baseline examination making a prospective longitudinal analysis possible. At 6 years after the baseline examination there was a mean increase of 4.3 and 4.6 in the CMTES and the CMTES-R, respectively. Table 4 shows the mean change in CMTES and CMTES-R with each year of follow-up and the SRM with each yearly interval. Longitudinal data at greater than 6 years after the baseline examination were not included due to a small number of data-points. The SRM at an interval of 3 years of prospective follow-up was 0.81 and 0.71 for the CMTES and CMTES-R, respectively.
Standardized response mean of CMTES and CMTES-R by year after baseline exam
| Year | n | Mean difference | SRM | 95% CI | |
|---|---|---|---|---|---|
| Lower | Upper | ||||
| CMTES | |||||
| 1 | 18 | 0.06 | 0.02 | −0.17 | 0.22 |
| 2 | 15 | 0.55 | 0.15 | −0.16 | 0.45 |
| 3 | 13 | 2.50 | 0.81 | 0.42 | 1.20 |
| 4 | 12 | 1.50 | 0.37 | −0.06 | 0.80 |
| 5 | 9 | 2.13 | 0.46 | −0.05 | 0.97 |
| 6 | 8 | 4.29 | 1.00 | 0.33 | 1.68 |
| CMTES-R | |||||
| 1 | 18 | 0.18 | 0.06 | −0.10 | 0.23 |
| 2 | 15 | 1.00 | 0.20 | −0.12 | 0.52 |
| 3 | 13 | 2.50 | 0.71 | 0.36 | 1.07 |
| 4 | 12 | 2.30 | 0.53 | 0.06 | 0.99 |
| 5 | 9 | 3.00 | 0.54 | 0.02 | 1.06 |
| 6 | 8 | 4.57 | 0.83 | 0.20 | 1.46 |
Change in CMTES and CMTES-R over 6 years. SRM = standardized response mean; CI = confidence interval.
Prospective longitudinal data were also modelled with a MMRM using categorical time effects. Figure 3 and Table 5 show the change in CMTES and CMTES-R over time with this model. Significant worsening on the CMTES and CMTES-R relative to study entry was noted between 3 and 6 years of follow-up.
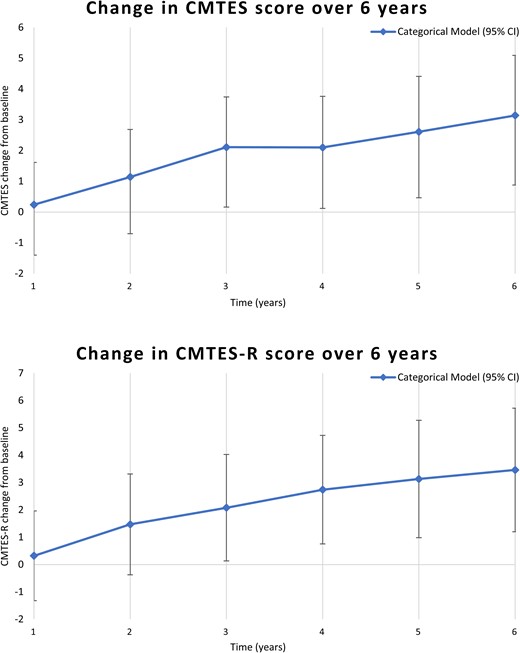
Mixed models for repeated measures analyses with categorical time effects, showing change in mean CMTES and CMTES-R at each year after the baseline examination. A significant difference in the mean CMTES and CMTES-R was seen beginning at Year 3 (P = 0.01 and P < 0.01 for CMTES and CMTES-R, respectively). See also Table 5 for all values at each year after the baseline examination.
Modelled change compared to baseline exam in CMTES and CMTES-R over time by categorical MMRM
| Year | CMTES change from baseline | 95% CI | P-value | |
|---|---|---|---|---|
| Lower | Upper | |||
| 1 | 0.24 | −1.13 | 1.61 | 0.74 |
| 2 | 1.14 | −0.40 | 2.68 | 0.15 |
| 3 | 2.11 | 0.48 | 3.74 | 0.01 |
| 4 | 2.1 | 0.44 | 3.76 | 0.01 |
| 5 | 2.61 | 0.81 | 4.41 | 0.006 |
| 6 | 3.14 | 1.19 | 5.09 | 0.002 |
| Year | CMTES-R change from baseline | 95% CI | P-value | |
| Lower | Upper | |||
| 1 | 0.32 | −1.32 | 1.96 | 0.71 |
| 2 | 1.47 | −0.37 | 3.31 | 0.12 |
| 3 | 2.08 | 0.13 | 4.03 | 0.04 |
| 4 | 2.74 | 0.76 | 4.72 | 0.009 |
| 5 | 3.13 | 0.98 | 5.28 | 0.006 |
| 6 | 3.46 | 1.20 | 5.72 | 0.004 |
A mixed models for repeated measures (MMRM) analysis using categorical time showing change in CMTES and CMTES-R at each year after baseline over 6 years. Significant difference in the mean CMTES and mean CMTES-R was seen beginning at 3 years after baseline exam. Bolded text indicates statistically significant change from baseline (P < 0.05).
Discussion
This is the largest cross-sectional study and the only prospective longitudinal analysis of adults and children with CMT4C to date. We found that individuals with CMT4C typically had onset of symptoms in childhood, with a median age of onset of 7 years for walking difficulty. CMTES scores indicated moderate-to-severe symptoms and neurological impairment, with >20% of individuals requiring the use of a wheelchair. A high percentage of participants had scoliosis that was surgically treated. Clinically manifest hearing loss was common. The CMTES and CMTES-R showed clinically observable changes over 3 years of follow-up. Our data demonstrate the range of clinical phenotypes associated with biallelic SH3TC2 variants and suggest some phenotype-genotype relationships.
Compared to protein truncating variants, missense variants were rare and only observed in two participants in a homozygous state. CMT4C has been theorized to occur primarily due to a loss-of-function mechanism with both missense and protein truncating variants showing a loss of SH3TC2 endosome localization and function.8,31 The findings of this study do not directly contradict this, but the milder phenotypes of individuals who harbour homozygous p.Arg641Leu or p.His873Tyr variants raises the possibility that some missense variants are hypomorphic, with some residual preserved function. Comparisons of participants who had at least one missense variant to those with two truncating variants also support this possibility. Though differences were not statistically significant, the mean CMTES and CMTSS were lower in the group with at least one missense variant. There were also significantly higher ulnar CMAP and radial SNAP amplitudes, and a lower percentage of individuals diagnosed with scoliosis, among participants with at least one missense variant. Further functional studies of missense variants would be required to support the hypothesis of hypomorphic SH3TC2 gene variants with some residual preserved function.
The phenotypic variability may also relate to other factors. Genetic modifiers have been identified in CMT1A,32 and suggested in CMT4C.18 In a mouse model of CMT4C, a homozygous variant in Nrcam (a neuronal cell adhesion molecule) and heterozygous variants of Scn8a (a voltage-gated sodium channel) alter disease severity.33 The human counterparts of these genes bear scrutiny in future gene modifier studies in CMT4C.
The rarity and severity of CMT4C may make clinical trials challenging, motivating research for outcome measures and biomarkers across the lifespan in order to conduct clinical trials before significant neurological impairment with potentially limited reversibility ensues. Based on the longitudinal data and SRM, the CMTES and CMTES-R appear moderately and similarly responsive to change in CMT4C, but only over a period of 3 years or more. The CMTES sensitivity to change may be limited by ceiling effects, especially for sensory symptoms and examination findings. For individuals with longitudinal data available, a maximum score of 4 was reached at least once for 30% of individuals in sensory symptoms, 41% in pinprick examination, and 26% in vibration examination. Ceiling effects were less likely with motor symptoms and examination findings with a maximum score of 4 being reached at least once in only 15% of individuals for upper extremity motor symptoms and 11% for lower extremity motor symptoms, and 26% and 19% for lower and upper extremity motor examination scores, respectively. This underscores the need for outcome measures for CMT4C that are more responsive to change over shorter intervals of time. Additional, CMT-specific clinical outcome assessments (COA) and disease monitoring biomarkers that are validated or under study currently in CMT1A and other forms of CMT—the CMTPedS for children, the CMT Functional Outcome Measure for adults, patient-reported outcome measures (paediatric CMT-QOL and adult CMT health index), wearable sensors, and biomarkers (plasma neurofilament light levels, MRI of leg intramuscular fat fraction, in vivo reflectance microscopy of Meissner corpuscle density)—should be considered for inclusion in future natural history studies in CMT4C, given that its motor and sensory phenotype broadly overlaps other forms of CMT. The frequency of scoliosis requiring surgery and hearing loss in this prospective cohort suggests that spinal x-rays and audiological assessments should also be considered as potential secondary end points in trials in CMT4C.
There are some limitations of this study. Version 1 (rather than version 2) of the CMTES/CMTSS was used to evaluate three participants who were enrolled prior to 2011; this likely had a minimal impact on the calculation of the change over time in the CMTES. There were too few CMTPedS performed for comparative or longitudinal data analysis of this assessment. This scale was first validated in 2012 and only performed at some INC sites. A subset of seven child and adolescent participants were previously reported with an analysis based on CMTPedS reported over 2 years with no significant change able to be detected.34 Follow-up of participants was variable, with some participants only having a single evaluation or missing one or more yearly evaluations, however this study is—to our knowledge—the only prospective report of CMT4C to date. We included four individuals who had at least one variant that has as yet not been formally classified as pathogenic or likely pathogenic. We opted to include these participants in the report to reflect the full genotype spectrum of individuals with homozygous or compound heterozygous SH3TC2 variants clinically diagnosed as CMT4C within the INC RDCRN. Each of these participants/families were diagnosed with CMT4C by clinician experts in hereditary neuropathies, had supportive phenotypes, lacked other identified potential causes of peripheral neuropathy, and harboured VUSes favouring pathogenicity.
In summary, CMT4C is typically childhood onset, and associated with variable moderate-to-severe disability for which disease progression over 3 years can be captured using the CMTES and CMTES-R. The natural history data presented here will be useful to inform design of anticipated gene therapy trials in CMT4C, but also highlights gaps in clinical trial readiness, for which focused longitudinal validation studies of recently developed COA and disease progression/response biomarkers are urgently needed.
Funding
The work was supported by the Inherited Neuropathy Consortium (INC; U54 NS065712), which is a part of the NCATS Rare Disease Clinical Research Network (RDCRN), an initiative of the Office of Rare Disease Research (ORDR), NCATS. The INC receives support from the Muscular Dystrophy Association (MDA) and CMT association (CMTA). Tyler Rehbein also received support from an NINDS T32 Grant (5 T32 NS 7338-32).
Competing interests
J.B. provides expert opinion regarding clinical outcome assessments and possible new therapeutics for use in patients with inherited neuropathies to Applied Therapeutics, DTx Pharma, Passage Bio, Hereditary Neuropathy Foundation. S.S.S. actively serves as a consultant to Disarm Therapeutics, Mitochondria in Motion, and Pfizer. D.N.H. has served as a consultant or on a Scientific Advisory Board for Regenacy, Pfizer, Passage Bio, Applied Therapeutics, DTXx Pharma, Sarepta, Neurogene, Swan Bio, GLG and Guidepoint Global. D.P. has served as a consultant or on a Scientific Advisory Board for Akcea, Alnylam, Arvinas, Augustine Tx, Inflectis, DTx. S.R. is employed by the Janssen Pharmaceutical Companies of Johnson & Johnson.
Supplementary material
Supplementary material is available at Brain online.

