


Abstract
Recurrent proximal 16p11.2 deletion (16p11.2del) is a risk factor for diverse neurodevelopmental disorders with incomplete penetrance and variable expressivity. Although investigation with human induced pluripotent stem cell models has confirmed disruption of neuronal development in 16p11.2del neuronal cells, which genes are responsible for abnormal cellular phenotypes and what determines the penetrance of neurodevelopmental abnormalities are unknown. We performed haplotype phasing of the 16p11.2 region in a 16p11.2del neurodevelopmental disorders cohort and generated human induced pluripotent stem cells for two 16p11.2del families with distinct residual haplotypes and variable neurodevelopmental disorder phenotypes.
Using transcriptomic profiles and cellular phenotypes of the human induced pluripotent stem cell-differentiated cortex neuronal cells, we revealed MAPK3 to be a contributor to dysfunction in multiple pathways related to early neuronal development, with altered soma and electrophysiological properties in mature neuronal cells. Notably, MAPK3 expression in 16p11.2del neuronal cells varied on the basis of a 132 kb 58 single nucleotide polymorphism (SNP) residual haplotype, with the version composed entirely of minor alleles associated with reduced MAPK3 expression. Ten SNPs on the residual haplotype were mapped to enhancers of MAPK3. We functionally validated six of these SNPs by luciferase assay, implicating them in the residual haplotype-specific differences in MAPK3 expression via cis-regulation. Finally, the analysis of three different cohorts of 16p11.2del subjects showed that this minor residual haplotype is associated with neurodevelopmental disorder phenotypes in 16p11.2del carriers.
Introduction
Neurodevelopmental disorders (NDDs), characterized by cognitive, neurological and psychiatric manifestations due to abnormal nervous system development, involve various genetic contributions. 16p11.2 deletion (16p11.2del) mediated by non-allelic homologous recombination between flanking segmental duplications1 underlies a frequent syndrome that variably involves autism spectrum disorder (ASD),1 intellectual disability/developmental delay (ID/DD),2,3 seizures,4 speech delays and behavioural problems5,6 and psychosis.7
Mouse models have been used to explore the effects of 16p11.2del on CNS development and behaviour,8,9 and zebrafish and Drosophila models have been used to assess potential contributors to altered phenotypes.10,11 Such studies have recapitulated some core behavioural phenotypes and identified some key disrupted biological pathways and candidate contributors to 16p11.2del in NDDs.12-14 However, some phenotypes are inconsistent across models or opposite from humans. For example, kctd13-knockout zebrafish10 but not Kctd13-deficient mice15,16 show altered head sizes, and 16p11.2del mice exhibit reduced brain volume,12 whereas deletion patients show macrocephaly.17
Human induced pluripotent stem cells (hiPSCs) provide a useful system for studying transcriptomic profiles, cell morphology and electrophysiological properties of patient-derived neuronal cells (NCs). 16p11.2del caused transcriptional alterations18 in neuronal rosettes, increased soma size and dendrite length (with reduced synaptic density) and abnormal electrophysiological signatures in cortical neurons.19 Some cellular differences were replicated in dopaminergic neurons generated from CRISPR-edited isogenic 16p11.2del hiPSCs,20 but a more comprehensive comparison of isogenic 16p11.2del NCs and a mouse model emphasized the critical importance of cell-specific molecular and cellular phenotypes for the 16p11.2del.21 Overall, hiPSC models have demonstrated direct effects of 16p11.2del on neurogenesis but have not pointed unequivocally to a specific driver of abnormal cellular phenotypes.
Another unresolved issue concerning 16p11.2del is the variable expression of NDD phenotypes.22 Although phenotypic variation has partially been explained by additional large copy number variations (CNVs),22,23 the contribution of deleterious mutation or specific haplotype on the remaining 16p11.2 copy has not been extensively studied. We previously reported two 16p11.2del families harbouring at least two carriers24,25 and discordant intra-family NDD phenotypes. Exon sequencing found no significant coding variant to explain the variable severity of NDDs. However, there is precedent for a residual haplotype effect in 16p11.2. In congenital scoliosis (CS), a haplotype of three TBX6 SNPs (rs2289292T, rs3809624C, rs3809627A) contributes via reduced TBX6 expression.26 Two of these non-coding single nucleotide polymorphisms (SNPs) (rs3809624C, rs3809627A) are in an ‘Elite GeneHancer’ element (GH16J030089),27 supporting the cis-regulatory effect. Consequently, we hypothesized that the variation of NDD outcome in 16p11.2del subjects might arise from regulatory differences on the residual haplotype.
Here, we characterized the residual haplotypes of 31 NDD children with 16p11.2del, defining a region of complete linkage disequilibrium (LD) with only two reciprocal haplotypes in the cohort. We also generated hiPSCs for two 16p11.2del families in which intra-family carriers presented different residual haplotypes and discordant NDD phenotypes. Differentiation to NCs and subsequent rescue experiments implicated MAPK3 haploinsufficiency as contributing to abnormal transcriptional and cellular phenotypes of 16p11.2del and revealed haplotype-dependent MAPK3 expression. Ten of the 16p11.2 haplotype SNPs lie in enhancer elements, and in vitro assays supported their allelic effects on cis-regulation. Finally, a comparison of residual haplotypes across different 16p11.2del cohorts suggested a differential risk for NDD due to haplotype-dependent regulation of MAPK3 expression.
Materials and methods
Three 16p11.2del cohorts and residual haplotype phase
Thirty-one NDD patients (CIP-NDD-16p11.2del cohort) from the Capital Institute of Pediatrics (CIP) revealed 16p11.2del by chromosomal microarray analysis, multiplex ligation-dependent probe amplification or exome sequencing.28 The neurodevelopmental quotient was evaluated using Wechsler Intelligence Scale for Children, or the Children Neuropsychological and Behavior Scale-Revision 2016,29 while ASD was evaluated by DSM-IV. The procedure was reviewed and approved by the ethics committee of the CIP. All individuals or guardians signed written informed consent for donating peripheral blood and the publication of related research findings.
The Simons Foundation Autism Research Initiative (SFARI, https://www.sfari.org/, Request ID 12603.1.3) provided phenotypic and genotypic information from 86 16p11.2del carriers (SFARI-16p11.2del).30 Among these individuals, 18 were diagnosed with ASD (SFARI-ASD-16p11.2del cohort).
The Department of Orthopedic Surgery, Peking Union Medical College Hospital (PUMCH-CS-16p11.2del cohort) provided 29 CS patients with 16p11.2del from the framework of Deciphering disorders Involving Scoliosis and COmorbidities study (https://discostudy.org/en/).26
Residual 16p11.2 haplotypes were determined by target sequencing (CIP-NDD-16p11.2del cohort, 244.393 kb of 16p11.2 region; Supplementary Table 1 and see Supplementary material, File 1, for bait probes), SNP chip (SFARI-ASD-16p11.2del cohort) or whole-genome sequencing (PUMCH-CS-16p11.2del cohort). See Supplementary material for details.
Human induced pluripotent stem cell differentiation and analysis
Peripheral blood mononuclear cells (PBMCs) were reprogrammed to hiPSCs (Fig. 2B ) and differentiated to cortical NCs with a modified protocol (Fig. 2C).31
RNA was collected on Days 0 and 21 of the differentiation process (red ovals in Fig. 2C), respectively, and extracted using an RNeasy Plus Mini Kit (QIAGEN). RNA-sequencing (RNA-seq), transcriptomic analysis, weighted gene co-expression network analysis (WGCNA), immunofluorescence and western blot (WB) are described in the Supplementary material. The antibodies for immunofluorescence and WB are listed in Supplementary Table 2. The expression of 16p11.2 genes and potential enhancer RNAs (eRNAs; Fig. 6B and Supplementary Table 3) was validated by reverse-transcription (RT) following quantitative real-time PCR (qRT-PCR). Sanger sequencing and alignment of amplicons was used to confirm the genomic locations of eRNAs. Detailed methods and validation experiments are in the Supplementary material.
Multi-electrode array recording and analysis
Multi-electrode array (MEA) is a high-throughput assay that reflects the electrophysiological properties of neuronal or heart cells.32 Spontaneous electrical activities of MEA plates were collected periodically. Four days after doxycycline induction of NGN2, 1 × 10⁵/well neural precursor cells (NPCs) were seeded onto previously 0.3% PEI solution + 10 µg/ml laminin-coated 24-well MEA plates (Axion Biosystems). On Day 1, the NPC medium was replaced with NC medium and, thereafter, half medium changes were conducted every 2–3 days. NPCs infected with lentivirus expressing MAPK3 or empty vector were prepared and plated in the same manner. During MEA recording, the plate was incubated for 5 min on a 37°C prewarmed reader with half-refreshed NC medium. The bandpass filter was 200–3 kHz. The recording data were analysed using Axis Navigator1.5 software. The weighted mean firing rates were compared by ANOVA of Aligned Rank Transformed Data,33 and P < 0.05 was considered to be statistically significant.
Rescue assays
16p11.2 NPCs were transfected by designed lentivirus-mediated MAPK3 or empty vector overexpression systems (EGFP-MAPK3/Empty) (Genechem) at Day −3 (blue colour in Fig. 2C) with two different doses of lentivirus [the dose of 8 × 10⁴ TU was abbreviated to R (+); the dose of 4 × 10⁵ TU was abbreviated to R (++)]. During the differentiation process to cortical NCs, doxycycline was added to induce neurogenin 2 (NGN2) expression on Day −4. After 24 h, the medium was removed and cells infected by the addition of lentiviral vectors (8 × 10⁴ TU or 4 × 10⁵ TU) into N2 medium for 18 h. The infected cells were cultured in medium supplemented with doxycycline for 48 h to generate NPCs, which were used for subsequent experiments, including RNA-seq, MEA recording and WB. Given that firing spikes were recorded until Day 33, we plated NPCs with the R (++) dose during the MEA experiment and collected firing signals of NCs from Days 9 to 33 for comparison.
Vector construction and luciferase reporter assay
Eight enhancer SNPs (eSNPs, GH16J029925 and GH16J029972) were chosen for in vitro luciferase reporter assay. The different residual haplotype fragments were constructed using Family 1 donors for DNA templates and then inserted into a pGL3-promoter vector, followed by transfection and in vitro luciferase reporter assay in HEK293T (human embryonic kidney 293T) cells. Detailed descriptions are available in the Supplementary material and Supplementary Table 3.
Distribution of materials
Human induced pluripotent stem cells are stored in the China Center for Type Culture Collection (http://www.cctcc.org) and their distribution is under permission from the ethics committee of the CIP.
Data availability
All RNA-seq data were deposited in Chinese National Genomics Data Center with accession number (https://ngdc.cncb.ac.cn/omix, HRA002368).
Results
Neurodevelopmental disorder spectrum of CIP-NDD-16p11.2del cohort
The CIP-NDD-16p11.2del cohort of 31 NDD children from 29 independent families28 comprises 19 males (61%) and 12 females (39%) aged 0.42–18 years. Of the 18 deletions with parental testing, nine are inherited (four maternal, five paternal) and nine are de novo (Fig. 1A). The NDD phenotypes are broad, with much higher frequencies of intellectual disability/developmental delay (ID/DD, 48%) and seizure/epilepsy (61%) than ASD (23%) (Fig. 1B). The seven transmitting parents were not all available for consistent, detailed neurodevelopmental phenotyping.
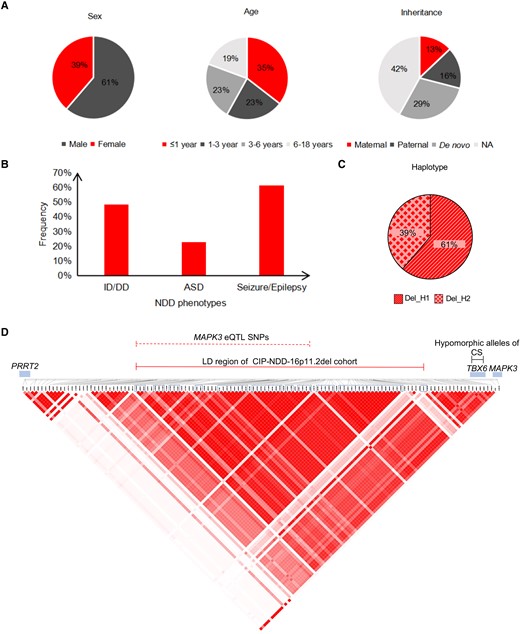
General information concerning the Chinese child NDD cohort with 16p11.2del. Thirty-one NDD children carrying 16p11.2del from 29 Chinese families (CIP-NDD-16P11.2del cohort) are summarized, showing the sex, age and inheritance of 16p11.2del (A), major referred NDD categories (B), frequency of reciprocal residual 132 kb 16p11.2 haplotypes (C) and Haploview depiction of LD across chr16:29,823,409–30,134,630, containing the 132 kb haplotype (D). Only common SNPs (minor allele frequencies = 20–50% in gnomAD database) from target sequencing were extracted to construct the haplotype using Haploview. The distal portion of the 16p11.2 CNV (chr16:29,592,784–29,823,409) displays lower LD and is not shown. The locations of the 58 SNP-based haplotype, eQTL SNPs related to MAPK3 expression and three hypomorphic CS-associated SNPs, PRRT2, TBX6 and MAPK3, are shown. The SNPs that form the 58 SNP haplotype are denoted by the blue boxes. Del_H1 = minor residual haplotype; Del_H2 = major residual haplotype.
A 132 kb haplotype in 16p11.2 region
Using capture sequencing (bait probes in Fig. 6A), we defined the hemizygous SNP genotypes in the CIP-NDD-16p11.2del cohort and extracted those alleles common in the general population (10–90% allele frequency) to assign a residual haplotype for each 16p11.2del subject. In addition to the 31 child carriers, seven transmitting parents and 26 parents without 16p11.2del were available for capture sequencing to confirm the accuracy and Mendelian inheritance of the residual haplotype. Fifty-eight SNPs (Supplementary Table 1) spanning 132 kb (chr16:29,924,422–30,057,148; hg19) showed complete LD across all children in the CIP-NDD-16p11.2del cohort (red solid line in Fig. 1D and Supplementary Table 4), resulting in only two reciprocal residual haplotypes (Table 1 and Fig. 1C), one with only minor alleles (minor haplotype, abbreviated to Del_H1) and one with only major alleles (major haplotype, Del_H2). The minor allele frequencies of the 58 SNPs ranged from 34 to 39% in 600 unrelated Chinese (Table 1). This 132 kb region also displays strong LD in both Chinese and European populations based on 216 Chinese (in-house SNP chips) and 160 European (SNP chips from SFARI) normal parents,30 as shown in Supplementary Fig. 1 and Supplementary Table 4. It lies telomeric to the aforementioned CS-related TBX6 hypomorphic haplotype (chr16:30,097,630–30,103,160; rs2289292-rs3809624-rs3809627; black solid line in Fig. 1D).26
The detailed genotyping information, population frequencies of residual haplotypes of 16p11.2 region and their association with NDD phenotype in three 16p11.2del cohorts
| Population | Name | n | Residual haplotype frequencya | Other | |
|---|---|---|---|---|---|
| Minor (Del_H1) | Major (Del_H2) | ||||
| 16p11.2del cohort | |||||
| Chinese | CIP-NDD-16p11.2del | 31 | 19 (61%) | 12 (39%) | 0 |
| PUMCH-CS-16p11.2del | 29 | 3 (10%) | 23 (79%)b | 3 (10%) | |
| Western | SFARI-ASD-16p11.2del | 18 | 8 (44%) | 5 (28%)c | 5 (28%) |
| Allele frequency range of 58 haplotype SNPs | |||||
| Minor allele | Major allele | – | |||
| Normal population | |||||
| Chinese | Chinese WGS | 600 | 34–39% | 61–66% | – |
| Asian | gnomAD Asian subset (V2) | 780 | 41–44% | 54–59% | – |
| Mixed | gnomAD total (v2) | 15 708 | 33–52% | 48–67% | – |
A residual haplotype in the 16p11.2 region consisting of 58 SNPs in complete LD, resulting in two reciprocal forms consisting entirely of minor alleles or of major alleles, was identified in the CIP-NDD-16p11.2del cohort characterized by NDD phenotype and analysed in two other 16p11.2 patient cohorts, PUMCH-CS-16p11.2del and SFARI-ASD-16p11.2del characterized by CS and ASD, respectively (see Materials and methods). The range of allele frequencies for the 58 SNPs was assessed in the general population samples noted, although phasing haplotype in normal population was not possible.
P < 0.001, the frequency of Del_H1 was compared between the CIP-NDD-16p11.2del and PUMCH-CS-16p11.2del cohort.
P > 0.05, the frequency of Del_H1 was compared between CIP-NDD-16p11.2del and SFARI-ASD-16p11.2del cohort.
The frequencies of Del_H1 and Del_H2 in the CIP-NDD-16p11.2del cohort are 61 and 39%, respectively (Table 1 and Fig. 1C), the reverse of the individual allele frequencies in the general population (Table 1). Among 12 Del_H2 NDD children, six were diagnosed with CS, whereas the others were not evaluated for spinal development. None of 19 NDD children carrying Del_H1 was diagnosed with CS. Different intra-family residual haplotypes (considering both parents and children) existed in five 16p11.2del families. We chose two of these families for generation of hiPSCs.
Generation of hiPSCs from 16p11.2del carriers and controls
We generated hiPSCs (Fig. 2A) from six donors in two 16p11.2del families, including four deletion carriers (Del1, Del2, Del3 and Del4) and two normal parents (C2 and C4), along with two unrelated normal adults of different sex (C1 and C3). The two 16p11.2del families afforded unique advantages. Within each family, the 16p11.2del carriers (i) are of the same sex (mother/daughter pair in Family 1 and male sibs in Family 2), but the residual haplotypes are different (Del1 and Del4 carry Del_H1, while Del2 and Del3 carry Del_H2); and (ii) differ in the severity of NDD features (Supplementary Table 5),24,25 allowing us to explore the relationship between the residual haplotype and neuronal phenotypes. Importantly, none of the 16p11.2del donors carries any other genic CNV >200 kb or pathogenic/likely pathogenic single nucleotide variants on the basis of CMA, whole exome sequencing and target sequencing of the 16p11.2 region (Supplementary Table 6).
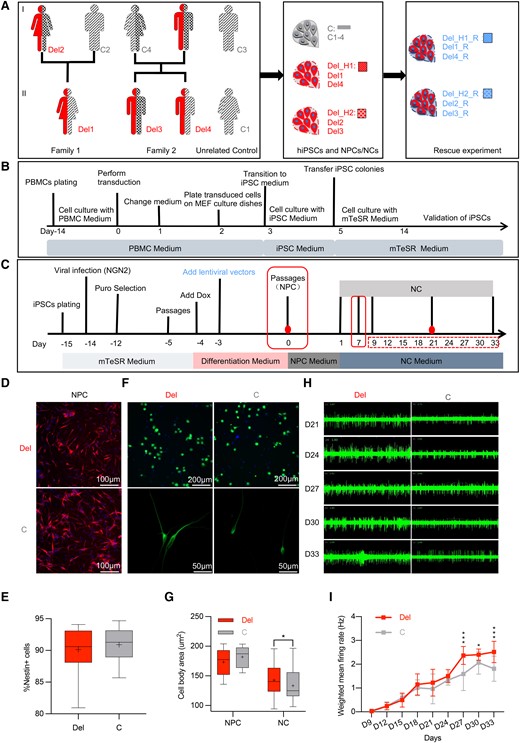
16p11.2 NCs: Flow chart of experimental design, soma size and electrophysiological properties. (A–C) Flow chart of sample collection, hiPSC generation and cortical NC differentiation for eight donors. (A) The pedigrees of two 16p11.2del families for hiPSC generation. The hiPSCs were derived from PBMCs for six donors from two 16p11.2del families (Del1, Del2 and C2 in Family 1; Del3, Del4 and C4 in Family 2) and two unrelated controls (C1 and C3). The 16p11.2del carriers (Del) are represented by the half-filled red figures, while the controls (C) are represented by the figures filled with black patterns. The black patterns represent different haplotypes: diagonal lines for the minor haplotype (Del_H1) and grid lines for the major haplotype (Del_H2). The father in Family 2 was not available for hiPSC generation due to death at age 51 years. The hiPSC-derived cortical NC lines for the MAPK3 rescue experiments are in blue (R). (B) The timeline of hiPSC generation from PBMCs. (C) The timeline of cortical NC differentiation and experimental design. Day 0, NPC stage after validation. The time points of the experiment, including RNA-seq (Days 0 and 21), cellular morphology (Days 0 and 7) and electrophysiological recording (Days 9–33), are labelled with red filled circles, red solid-line rectangles and red dashed-line rectangles. The MAPK3 rescue experiment was performed at Day −3. (D–I) Differentiation ability, soma size and electrophysiological properties of hiPSC-derived NCs with 16p11.2del. Representative images (D) and quantification analysis (E) of differentiation efficiency for 16p11.2del and control NPCs. The percentage of NPCs with Nestin+ were used to quantify the differentiation efficiency. (F and G) Representative images (F) and quantification analysis (G) of cell body size between 16p11.2del and control cells at the NPC (Day 0) and NC (Day 7) stages. The body sizes of the NPCs between the two groups were compared by live cell staining in a CELLINSIGHT CX5 system (Thermo Scientific) with a 96-well plate, and the inoculum quantity was 104/well. C, n = 6 clones; Del, n = 8 clones. The body sizes of the early NCs between 16p11.2del cells (n = 118 cells) and control cells (n = 43 cells) were compared after MAP2 staining. t-test with two tailed P-values, *P < 0.05. (H and I) Representative images of electrophysiological signatures (H) and quantification analysis of weighted mean firing rates (I) between 16p11.2del cells (n = 5 clones) and control cells (n = 3 clones). Electrophysiological signatures were recorded by MEA. The x-axis shows the timeline (Days 9 to 33) after plating NPCs. The cumulative differences or the difference at each observation time of weighted mean firing rates of NCs (Days 9 to 33) were compared by ANOVA of Aligned Rank Transformed Data. ***P < 0.001, **P < 0.01, *P < 0.05. Each box and whisker plot indicates median (line within box), mean (+), interquartile range (box outline), maximum and minimum values (whiskers).
PBMCs were successfully reprogrammed to hiPSCs (Fig. 2B), yielding 20 hiPSC clones (Del: n = 10; C: n = 10) across the eight donors with a minimum of two clones for each donor (Supplementary Table 5). The colonies had morphologies typical of human embryonic stem cells (Supplementary Fig. 2A). All hiPSC clones were examined for the pluripotency markers (OCT4, SSEA4, SOX2 and TRA-1-81; Supplementary Fig. 2B) and were validated for their ability to differentiate into the three germ lineages (Supplementary Fig. 2C). Other quality control data (AP staining, karyotype and array CGH; Supplementary Fig. 2A), mycoplasma testing and genomic identities (Supplementary Table 7) were also obtained for each hiPSC clone.
Larger soma size and hyperactivity in 16p11.2del cortical neuronal cells
NGN2 induction of NCs from hiPSC colonies was performed, defining Day 0 as the timepoint of successful differentiation to cortical NPCs (Fig. 2C). As shown in Supplementary Fig. 2, positive staining of the NPC markers Nestin and SOX2 was detected on Day 0, and of neuronal markers MAP2 and NeuN on Days 7 and 21, respectively. The capacity of the hiPSCs to differentiate into NPCs did not differ between 16p11.2del and control cells, as demonstrated by comparable Nestin+ cell populations (90.12 versus 90.92%, P > 0.05; Fig. 2D and E). 16p11.2del lines had significantly larger cell bodies than controls at the NC (142.69 versus 133.46, P < 0.05; bottom panel of Fig. 2F and G) but not at the NPC stage (173.25 versus 181.96, P > 0.05; upper panel of Fig. 2F and G). To assess electrophysiological properties, we collected the weighted mean firing rate continuously from Days 9 to 33 and MEA recorded few spikes (0–44) from the early NC stage. As shown in Fig. 2H and I, the 16p11.2del NCs showed significantly increased firing rates (P = 0.008) compared with control NCs.
Dysfunction in multiple pathways related to neuronal development
We compared global gene expression between 16p11.2del and control cells at both NPC and NC stages. Principal component analysis of the transcriptome data confirmed differential developmental profiles of NCs (Supplementary Fig. 3A) with 16p11.2del cells clustering differently from control cells at both the NPC and NC stages (Supplementary Fig. 3B–C). Transcriptomic data from 16 published 16p11.2del NPCs18 also clustered close to our NPCs but not with our NCs (Supplementary Fig. 3A). As expected, NES and SOX2 were expressed at a higher level in NPCs, whereas DCX, MAP2 and SLC17A6 were expressed at a higher level in NCs (Fig. 3A). None of these genes showed a significant difference between 16p11.2del and control cells (Fig. 3B and Supplementary Tables 8–10). Five 16p11.2 genes (C16orf92, TBX6, C16orf54, SPN and ZG16) showed extremely low expression in controls at both NPC and NC stage (FPKM < 1), suggesting they are unlikely to be relevant for early neurogenesis. Other 16p11.2 genes showed high expression in NCs (Fig. 3A).
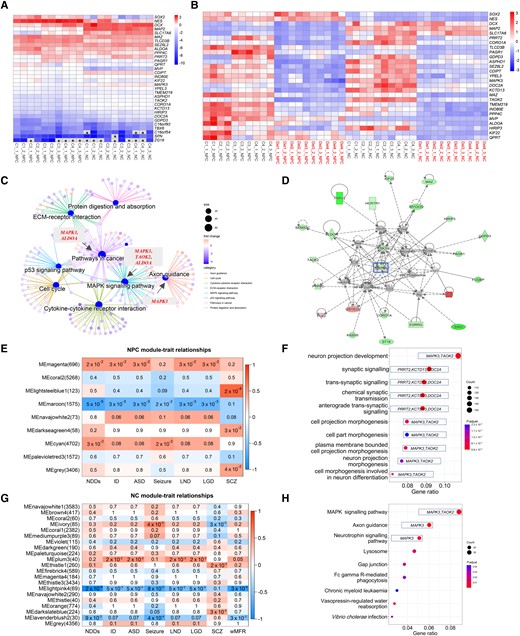
Transcriptomic profiles and WGCNA analysis of hiPSC-derived cortical NCs with 16p11.2del. (A and B) Transcriptome analysis revealed differential neurogenesis of hiPSC-derived neural cells at the NPC and NC stages (A) and between 16p11.2del cells (Del, n = 10 clones) and control cells (C, n = 10 clones) (B). (A) Heat maps of gene expression for normal NPCs and NCs, including NPC markers (NES and SOX2), NC markers (DCX, MAP2 and SLC17A6) and 16p11.2 genes. *Genes (zFPKM < 100) with extreme low expression in NPCs; the zFPKM was converted to zero for the heat map. (B) Heat maps of gene expression between 16p11.2del and control cells (NPCs and NCs), including differentiation markers and 16p11.2 genes. (C and D) Enrichment analysis of DEGs between 16p11.2del and control cells at NPC (C) and NC stages (D). The 16p11.2 genes (MAPK3, ALDOA, TAOK2) involved in the central network of DEGs (C) and node (MAPK3) of network enriched from ingenuity pathway analysis were marked (D). (E–H) WGCNA revealed modules of co-expressed genes in hiPSC-derived cortical NCs at NPC and NC stages. P < 0.05 for statistical significance. (E) Heatmap of P-values assessing the significance of module-trait correlations for 16p11.2del NPCs. All NDD phenotypes recorded in these two 16p11.2del families were included in WGCNA. Module MEmaroon had the highest negative correlation with NDD, including intellectual disability (ID), ASD, seizure, learning difficulty (LND), language global delay (LGD) and schizophrenia (SCZ). (F and H) GO biological processes (F) and KEGG analysis pathway (H) for genes belonging to the NPC-MEmaroon module. (G) Heatmap of P-values assessing the significance of module-trait correlations for 16p11.2del NCs. Module MElightpink4 had the highest negative correlation with NDDs, ID, ASD, seizure, LND, LGD, SCZ and weighted mean firing rates (wMFR).
Compared with control cells, 20 of the 29 16p11.2 genes showed significantly lower expression in 16p11.2del cells (Fig. 3B and Supplementary Tables 11 and 12, qPCR verification in Supplementary Fig. 3D), with the reduction being relatively greater (P = 0.006) in NPCs (mean of absolute log2 fold change: 1.15, 0.59–1.70) than in NCs (mean of absolute log2 fold change: 0.94, 0.65–1.13). In NPCs, we identified 2263 differentially expressed genes (DEGs, 590 downregulated and 1673 upregulated; Supplementary Table 9). Seven of the top 10 biological processes enriched in gene ontology analysis were related to cell morphogenesis with each term representing >128 DEGs (Supplementary Fig. 3E). KEGG analysis of DEGs showed significant enrichment for ECM-receptor interaction, cell cycle, pathways in cancer, p53 signalling pathway, protein digestion and absorption, cytokine–cytokine receptor interaction, axon guidance and MAPK signalling pathway (Supplementary Table 13). MAPK3 was detected as the hub in these pathways (Fig. 3C). Of the many genes downregulated outside the 16p11.2 locus, 68 are highly constrained (pLI > 0.99), and 17 (AFF3, ASXL3, CACNA1E, CLCN4, DCAF8, DPYSL5, EBF3, GRIN2A, GRIN2D, KCNMA1, KIF5A, KIF5C, LGI1, NEXMIF, NRG1, PDE4D and RELN) are recognized as NDD genes. In NCs, we identified 204 DEGs (98 downregulated and 106 upregulated; Supplementary Table 10), far fewer than in NPCs. GO and KEGG analysis of these DEGs failed to reveal any enrichments of pre-defined pathways, but ingenuity pathway analysis pointed to MAPK3 as the central gene of the DEG network (Fig. 3D).
We next performed WGCNA (WGCNA package v.1.70-3 in R v.4.1.2)34 on the basis of the recorded NDD phenotypes of these 16p11.2del donors (Supplementary Table 5). We detected eight modules in NPCs (Fig. 3E and Supplementary Tables 14 and 15), with NPC-MEmaroon (1575 members), containing 18 of 29 16p11.2 genes (Supplementary Fig. 3F), showing the most significant negative correlation with clinical features of donors. Low expression of module genes was associated with the risk of NDDs (P = 5 × 10−05), ID (P = 3 × 10−03), ASD (P = 3 × 10−03), seizure (P = 2 × 10−02), learning difficulty (P = 3 × 10−03) and language delay (language global delay, P = 3 × 10−03). In enrichment analysis of the NPC-MEmaroon module genes, the top 10 GO terms were all associated with neuronal development (Fig. 3F and Supplementary Table 16), including neuron projection development, synaptic signalling, trans-synaptic signalling, chemical synaptic transmission, anterograde trans-synaptic signalling, cell projection morphogenesis, cell part morphogenesis, plasma membrane bounded cell projection morphogenesis, neuron projection morphogenesis and cell morphogenesis involved in neuron differentiation. The 16p11.2 genes MAPK3 and TAOK2 were listed for six of these terms, and PRRT2, KCTD13 and DOC2A were listed for four (Fig. 3F). KEGG analysis of the NPC-MEmaroon module genes also showed several pathways related to neuronal development, including axon guidance and the neurotrophin signalling pathway, with MAPK signalling pathway being the largest (Fig. 3H and Supplementary Table 17). WGCNA of the NC transcriptome data detected >20 modules (Fig. 3G and Supplementary Tables 18 and 19) with NC-MElightpink4, containing 22 of the 16p11.2 region genes (Supplementary Fig. 3G). NC-MElightpink4 module showed the most significant negative correlation with several clinical features, with low expression of module genes associated with risk of NDDs (P = 2 × 10⁻¹⁸), ID (P = 5 × 10−03), ASD (P = 5 × 10−03), seizure (P = 8 × 10−05), learning difficulty (P = 5 × 10−03) and language global delay (P = 5 × 10−03). However, this module did not show significant pathway enrichments. Overall, the NPC and NC transcriptomic profiles indicate that 16p11.2del disrupts expression of genes in multiple pathways important for early neurogenesis, with those that show correlated expression with the change in 16p11.2 dosage being particularly associated with NDD phenotypes.
MAPK3 haploinsufficiency contributes to abnormal development of 16p11.2del neuronal cells
Pathway enrichment analysis of 16p11.2del DEGs pointed to MAPK3, which encodes an extracellular signal-regulated kinase (ERK1), as a contributor to abnormal development at both NPC and NC stages (Fig. 3C and D). Moreover, MAPK3 is a member of both the NDD-correlated NPC-MEmaroon and NC-MElightpink4 modules (Supplementary Fig. 3F and G), and pathway enrichment of genes in the former suggested a major role for MAPK signalling in 16p11.2del NDD (Fig. 3F and H). Consequently, we examined other published datasets for a contribution of MAPK3 to NDDs. DAVID gene enrichment analysis of 16p11.2 DEG data from neuronal rosettes generated by Roth et al.18 showed MAPK3 to be involved in 60 out of the 73 enrichment categories (see their Supplementary Table 6). Sundberg et al.20 generated hiPSC-derived dopaminergic neurons and reported that WGCNA detected two modules (Modules 19 and 25) highly correlated with 16p11.2del. The ingenuity pathway analysis of Module 19 showed that the extracellular signal-regulated kinase (ERK) pathway was central in the gene network (see their Supplementary Fig. 4).
To determine whether reduced MAPK3 expression due to 16p11.2del has a functional consequence, we examined its protein product, ERK1 (detected together with ERK2) and downstream molecules by WB (Fig. 4A and B). Compared to control diploid lines, the 16p11.2del NPCs displayed significantly decreased ERK1 levels (0.15 versus 0.26, P < 0.001), but significantly increased phosphorylated-ERK1 (pERK1) levels (0.44 versus 0.17, P < 0.001), indicating aberrant up-regulation of ERK1 activity. This result is consistent with previous findings in the 16p11.2del mouse12 and CRISPR-treated 16p11.2del iPSC lines.35 In addition, Kip1(p27) protein, a direct target of ERK1, showed significantly decreased expression (0.33 versus 0.71, P < 0.001) in the 16p11.2del NPCs.
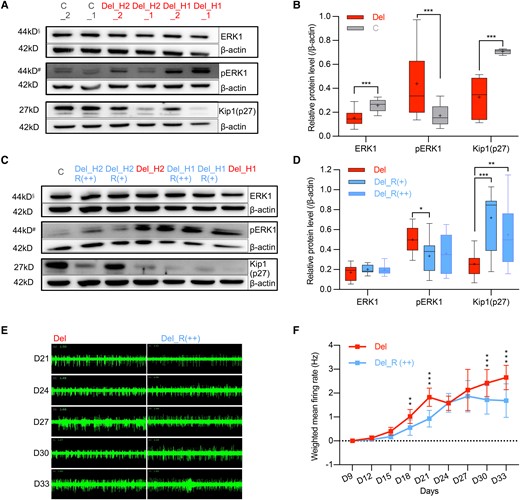
16p11.2del-associated cellular phenotypes and rescue changes by MAPK3. (A and B) Representative images (A) of the ERK1, phosphorylated ERK1 (pERK1) and Kip1(p27) activities in 16p11.2del NPCs (n = 8 clones) and sex-matched control NPCs (n = 4 clones) and quantification analysis (B). (C and D) Representative images (C) of the ERK1, phosphorylated ERK1 (pERK1) and Kip1(p27) activities in 16p11.2del NPCs treated with MAPK3 (n = 8 clones) or empty vector (n = 4 clones) lentiviral expression vectors and quantification analysis (D). 16p11.2del cells treated with EGFP empty expression vector (4 × 10⁵ TU) were used for control. The information below the sample represents the rescue dosage, and each cell clone was treated with two lentiviral dosages. R (+) represents low dosage (8 × 10⁴ TU) and R (++) represents high dosage (4 × 10⁵ TU). R (+): n = 4 clones, R (++): n = 4 clones. All values were normalized by β-actin. ***P < 0.001, **P < 0.01, * P < 0.05. §Upper band was ERK1. #Upper band was pERK1. (E and F) Representative images (E) of electrophysiological activity in 16p11.2del NPCs treated with MAPK3 (n = 5 clones) or control (n = 5 clones) lentiviral expression vectors and quantification analysis (F). 16p11.2del cells treated with EGFP empty expression vector (4 × 10⁵ TU) were used as controls. Each cell clone was treated only using R (++) dosage (4 × 10⁵ TU). Electrophysiological signatures were recorded by MEA. The x-axis shows timeline after plating NPCs (Days 9 to 33). The cumulative differences or the difference at each observing time of weighted mean firing rates (Days 9 to 33) were compared by ANOVA of Aligned Rank Transformed Data. ***P < 0.001, **P < 0.01, *P < 0.05. Each box and whisker plot indicates median (line within box), mean (+), interquartile range (box outline), maximum and minimum values (whiskers).
To confirm that MAPK3 haploinsufficiency contributes to the phenotypes observed in 16p11.2 NCs, we performed rescue experiments. Two different dosages [(R (+): 8 × 10⁴ TU; R (++): 4 × 10⁵ TU] of lentiviral MAPK3 expression vector were introduced at the NPC stage (Day -3, blue colour in Fig. 2C). We then determined the levels of related downstream proteins on Day 0 at both dosages, and the electrophysiological properties from Days 9 to 33 at R (++) dosage. We also determined the level of MAPK3 mRNA expression by global transcriptomic analysis at the R (+) dosage.
Treatment of 16pdel NPCs with the MAPK3 expression vector at the R (+) dosage resulted in increased MAPK3 mRNA expression (1.03 versus 0.36, P = 0.014) that approximated the level of control cells (1.03 versus 1.16, P = 0.714) (Supplementary Fig. 4). This change was sufficient to distinguish the treated and untreated cells by principal component analysis (Supplementary Fig. 3B). Although we were not able to distinguish an increase in ERK1 at either lentiviral dosage [R (+): 0.20 versus 0.17, P = 0.23; R (++): 0.20 versus 0.17, P = 0.34], treatment significantly reduced pERK1 levels [R (+): 0.34 versus 0.50, P = 0.012; R (++): 0.36 versus 0.50, P = 0.05] and increased of Kip1(p27) levels [R (+): 0.72 versus 0.26, P < 0.001; R (++): 0.55 versus 0.26, P = 0.009] (Fig. 4C and D). Surprisingly, the measurement of Kip1(p27) suggested a greater effect of the lower lentiviral dose (Kip1(p27): 0.72 versus 0.55, P = 0.19), one explanation for which might be toxicity for NPCs at the higher R (++) dosage. However, the MEA measurements in NCs, which required the recording of firing spikes from Days 9 to 33, were successfully performed at the R (++) dosage. The treatment significantly reversed the higher weighted mean firing rates (Days 9–33) of 16p11.2del NCs (P = 0.0001; Fig. 4E and F), supporting the view that MAPK3 haploinsufficiency contributes to the molecular and cellular phenotypes in this system. The treatment of 16pdel NCs with the MAPK3 expression vector showed a trend towards reduced body size that did not achieve significance [R (+): 152.12 versus 149.14, P = 0.341; R (++):152.12 versus 147.37, P = 0.09; Supplementary Fig. 5].
Differences in molecular and cellular phenotypes due to residual 16p11.2del haplotype
We noted that ERK1 levels appeared to differ between intra-family 16p11.2del carriers (Fig. 4A). Statistical analysis confirmed that ERK1 protein levels were significantly lower in Del_H1 than that in Del_H2 NPCs (0.12 versus 0.18, P < 0.01; Figs 4A and 5A). qRT–PCR also confirmed significantly lower MAPK3 mRNA expression (0.26 versus 0.58, P < 0.05; Fig. 5B) in Del_H1 NPCs. We also compared the downstream proteins, pERK1 and Kip1(p27), in NPCs by 16p11.2 residual haplotype. Kip1(p27) was relatively lower in Del_H1 than Del_H2 NPCs (0.29 versus 0.36; Figs 4A and 5A) but this did not reach statistical significance (P = 0.55).
![Residual haplotype-specific MAPK3 expression, transcriptomics profile and electrophysiological properties in 16p11.2del cortical NCs. (A) Quantification of ERK1/pERK1/Kip1(p27) protein levels in 16p11.2del NPCs carrying different residual haplotypes. Level was normalized by β-actin. Del_H1: n = 4 clones. Del_H2: n = 4 clones. (B) Quantification of MAPK3 mRNA levels in 16p11.2del NPCs carrying different residual haplotypes before and after treatment with MAPK3 lentiviral expression vectors. NPCs were collected for RNA extraction, genomic DNA digestion following RT-qPCR. MAPK3 mRNA expressions were normalized by GAPDH. Del_H1: n = 4 clones, Del_H2: n = 4 clones, Del_H1_R (+): n = 2 clones, Del_H2_R (+): n = 2 clones. (C–E) Quantification analysis of ERK1 (C), pERK1 (D), Kip1(p27) (E) protein levels in 16p11.2del NPCs carrying different residual haplotypes after treatment with MAPK3 [Del_H1_R (+): n = 2 clones, Del_H1_R (++): n = 2 clones, Del_H2_R (+): n = 2 clones, Del_H2_R (++): n = 2 clones] or empty (Del_H1: n = 2 clones, Del_H2: n = 2 clones) lentiviral expression vectors. 16p11.2del cells treated with EGFP expression vector (4 × 10⁵ TU) were used for lentiviral control. Two dosages of MAPK3 expression vectors were performed. R (+): 8 × 10⁴ TU, R (++): 4 × 10⁵ TU. The comparisons were performed for different subgroups. All values were normalized by β-actin. (F) Cumulative differences of weighted mean firing rates of 16p11.2del NCs carrying different residual haplotypes. Electrophysiological signatures were recorded by MEA. The x-axis shows timeline after plating NPCs (Days 9 to 33), Del_H1: n = 2 clones. Del_H2: n = 3 clones. The cumulative differences or the difference at each observation time of weighted mean firing rates of NCs (Days 9 to 33) was compared by ANOVA of Aligned Rank Transformed Data. (G and H) Representative images of soma size in 16p11.2del NCs carrying different residual haplotypes (G) and quantification analysis (H). Del_H1: n = 68 cells. Del_H2: n = 50 cells. ***P < 0.001, **P < 0.01, *P < 0.05. (I and J) Representative images and quantification analysis of soma size in 16p11.2del NCs carrying different residual haplotypes after treatment with MAPK3 [Del_H1_R (+): n = 113 cells, Del_H1_R (++): n = 131 cells, Del_H2_R (+): n = 134 cells, Del_H2_R (++): n = 80 cells] or empty (Del_H1: n = 85 cells, Del_H2: n = 94 cells) lentiviral expression vectors. 16p11.2del cells treated with EGFP expression vector (4 × 10⁵ TU) were used for lentiviral control. Two dosages of MAPK3 expression vectors were performed. R (+): 8 × 10⁴ TU, R (++): 4 × 10⁵ TU. ** P < 0.01. (K and L) Quantification of weighted mean firing rates in 16p11.2del NCs carrying different residual haplotypes after treatment with MAPK3 [Del_H1_R (++): n = 2 clones, Del_H2_R (++): n = 3 clones] or control (Del_H1: n = 2 clones, Del_H2: n = 3 clones) lentiviral expression vectors. Each cell clone was treated only using R (++) dosage (4 × 10⁵ TU). The x-axis shows timeline after seeding NPCs. The cumulative differences or the difference at each observing time of weighted mean firing rates of NCs (Days 9 to 33) was compared by ANOVA of Aligned Rank Transformed Data. 16p11.2del cells treated with EGFP empty expression vector (4 × 10⁵ TU) were used for control. ***P < 0.001, **P < 0.01, *P < 0.05. Each box and whisker plot indicates median (line within box), mean (+), interquartile range (box outline), maximum and minimum values (whiskers).](https://oup.silverchair-cdn.com/oup/backfile/Content_public/Journal/brain/146/8/10.1093_brain_awad071/1/m_awad071f5.jpeg?Expires=1750215855&Signature=2htmp5EATndVdKzwBLRu2e2Wj98WlqhxezvrokxHUSwE6wXlRmidcBXd40qv0jEmc9bRK62x81i-fTGBXDE5~m0QqTf~9-1eT63ahJLHnT5rOFDWcHD~k97BsqbvvNCl9lNkpvlhHOyWbI33DvkfHaoXUBM4A0VKLvMZckwFdv~Y5e1upMgbvnwnsa~6Z~kYPqFGVEJmq6p23mbqdkxFpCbEwzlrNfyx7u3GYDqxRY~r8I6Somvv3EVuB7KDzdo3prKl0Ka8AlPaFL5s3jpDZk9CWfDCDkM7YvwdkQGZp~ojZ5jzWcwfQppWgDQNfULGDC4q~3yy~limKeMYfOzt9Q__&Key-Pair-Id=APKAIE5G5CRDK6RD3PGA)
Residual haplotype-specific MAPK3 expression, transcriptomics profile and electrophysiological properties in 16p11.2del cortical NCs. (A) Quantification of ERK1/pERK1/Kip1(p27) protein levels in 16p11.2del NPCs carrying different residual haplotypes. Level was normalized by β-actin. Del_H1: n = 4 clones. Del_H2: n = 4 clones. (B) Quantification of MAPK3 mRNA levels in 16p11.2del NPCs carrying different residual haplotypes before and after treatment with MAPK3 lentiviral expression vectors. NPCs were collected for RNA extraction, genomic DNA digestion following RT-qPCR. MAPK3 mRNA expressions were normalized by GAPDH. Del_H1: n = 4 clones, Del_H2: n = 4 clones, Del_H1_R (+): n = 2 clones, Del_H2_R (+): n = 2 clones. (C–E) Quantification analysis of ERK1 (C), pERK1 (D), Kip1(p27) (E) protein levels in 16p11.2del NPCs carrying different residual haplotypes after treatment with MAPK3 [Del_H1_R (+): n = 2 clones, Del_H1_R (++): n = 2 clones, Del_H2_R (+): n = 2 clones, Del_H2_R (++): n = 2 clones] or empty (Del_H1: n = 2 clones, Del_H2: n = 2 clones) lentiviral expression vectors. 16p11.2del cells treated with EGFP expression vector (4 × 10⁵ TU) were used for lentiviral control. Two dosages of MAPK3 expression vectors were performed. R (+): 8 × 10⁴ TU, R (++): 4 × 10⁵ TU. The comparisons were performed for different subgroups. All values were normalized by β-actin. (F) Cumulative differences of weighted mean firing rates of 16p11.2del NCs carrying different residual haplotypes. Electrophysiological signatures were recorded by MEA. The x-axis shows timeline after plating NPCs (Days 9 to 33), Del_H1: n = 2 clones. Del_H2: n = 3 clones. The cumulative differences or the difference at each observation time of weighted mean firing rates of NCs (Days 9 to 33) was compared by ANOVA of Aligned Rank Transformed Data. (G and H) Representative images of soma size in 16p11.2del NCs carrying different residual haplotypes (G) and quantification analysis (H). Del_H1: n = 68 cells. Del_H2: n = 50 cells. ***P < 0.001, **P < 0.01, *P < 0.05. (I and J) Representative images and quantification analysis of soma size in 16p11.2del NCs carrying different residual haplotypes after treatment with MAPK3 [Del_H1_R (+): n = 113 cells, Del_H1_R (++): n = 131 cells, Del_H2_R (+): n = 134 cells, Del_H2_R (++): n = 80 cells] or empty (Del_H1: n = 85 cells, Del_H2: n = 94 cells) lentiviral expression vectors. 16p11.2del cells treated with EGFP expression vector (4 × 10⁵ TU) were used for lentiviral control. Two dosages of MAPK3 expression vectors were performed. R (+): 8 × 10⁴ TU, R (++): 4 × 10⁵ TU. ** P < 0.01. (K and L) Quantification of weighted mean firing rates in 16p11.2del NCs carrying different residual haplotypes after treatment with MAPK3 [Del_H1_R (++): n = 2 clones, Del_H2_R (++): n = 3 clones] or control (Del_H1: n = 2 clones, Del_H2: n = 3 clones) lentiviral expression vectors. Each cell clone was treated only using R (++) dosage (4 × 10⁵ TU). The x-axis shows timeline after seeding NPCs. The cumulative differences or the difference at each observing time of weighted mean firing rates of NCs (Days 9 to 33) was compared by ANOVA of Aligned Rank Transformed Data. 16p11.2del cells treated with EGFP empty expression vector (4 × 10⁵ TU) were used for control. ***P < 0.001, **P < 0.01, *P < 0.05. Each box and whisker plot indicates median (line within box), mean (+), interquartile range (box outline), maximum and minimum values (whiskers).
We also noted different molecular phenotypes for NPCs by 16p11.2 residual haplotype in response to MAPK3 expression vector treatment (Figs 4C and D and 5B–E). At R (+) dosage, the expression of MAPK3 mRNA was higher in Del_H2 cells than in Del_H1 cells (1.51 versus 0.55, P = 0.026; Fig. 5B). At the protein level, ERK1 was significantly higher in Del_H2 cells than in Del_H1 cells (0.24 versus 0.17, P < 0.01; Fig. 5C). However, pERK1 and Kip1(p27) at R (+) dosage showed only respective trends toward lower (0.26 versus 0.41, P = 0.12; Fig. 5D) and higher (0.87 versus 0.56, P = 0.11; Fig. 5E) levels in Del_H2 cells compared with Del_H1. Again, in the Del_H2 cells, the R (++) dosage appeared to have less effect than the lower R (+) dosage [pERK1: 0.33 versus 0.26, P = 0.54; Kip1(p27): 0.58 versus 0.87, P = 0.04], but the comparison suffered from small sample sizes (Del_H1: n = 2 clones, Del_H2: n = 2 clones) and was non-significant.
We also compared the cellular morphology and electrophysiological properties of different 16p11.2del lines at the NC stage. Overall, five 16p11.2del clones (Del_H1: n = 2; Del_H2: n = 3) were available for analysis of body size and electrophysiology across the full Days 9–33 interval. Both the weighted mean firing rates (P = 0.285 for Days 9–33; Fig. 5F) and body size (139.86 versus 146.53, P = 0.16; Fig. 5G and H) were similar between the two haplotype groups. However, a haplotype difference was elicited in the rescue experiment, where body size of Del_H2 NCs was significantly lower than Del_H1 NCs [R (+): 143.66 versus 155.63, P < 0.01; Fig. 5I and J]. The hyperactivation of Del_H2 NCs (Fig. 5K and L) was more effectively reversed by increasing MAPK3 expression than Del_H1 NCs. The fact that Del_H1 and Del_H2 cells differ for some but not all haploinsufficiency phenotypes, despite the lower MAPK3 expression in Del_H1 cells, and that these phenotypes can differ with respect to rescue, suggests that the responses to increased MAPK3 expression are non-linear or involve a threshold effect.
Finally, although we had multiple lines for each haplotype, these were from only four donors limiting our ability to account for effects of genetic background. Using the transcriptomic profiles (RNA-seq or qRT-PCR) at the NPC stage, we identified 378 DEGs between Del_H1 and Del_H2 lines (Supplementary Table 20). GO analysis showed that these DEGs are enriched for terms related to synaptic development and function (Supplementary Fig. 6). In addition to MAPK3, several other 16p11.2 genes also differed in expression between Del_H1 and Del_H2 lines (PRRT2, PAGR1, adjusted P-value < 0.05; see Supplementary Table 20). Subsequently, qRT–PCR validated a statistically significant difference only for MAPK3 (Fig. 5B) and PAGR1 (Supplementary Fig. 7). We also compared the NPC transcriptomic profiles of the two haplotype groups in the MAPK3 rescue experiment [at R (+) dosage], KEGG analysis of DEGs (Supplementary Table 21) between different 16p11.2del NPCs showed enrichment of MAPK3-involved pathways (Supplementary Fig. 8 and Supplementary Table 22) suggesting that at least some of the DEGs result from the 16p11.2 haplotype difference rather than differences in genetic background.
We further examined the haplotype difference in the published 16p11.2del neuronal rosette data.18 Of 10 lines studied, only one (Sample ID, DEL_10; SFARI Subject ID, 14799.x1) carried a residual Del_H1 haplotype, while the others all carried Del_H2.30 We compared the transcriptomic data from three clones of the Del_H1 line (Sample DEL_10) with three clones of a sex-matched Del_H2 line (Sample ID, DEL_9; SFARI Subject ID, 14824.x13) (Supplementary Table 23 for the relative expression of 16p11.2 interval genes). Consistent with our observation, the expression of MAPK3 was significantly lower from Del_H1 than that from Del_H2 (P = 6.96 × 10⁻⁵; Supplementary Fig. 9). In this comparison, Del_H1 was also associated with lower relative expression of KIF22 (P = 1.63 × 10⁻⁵) but not PRRT2 or PAGR1.
Haplotype-specific MAPK3 expression due to cis-regulation by enhancer single nucleotide polymorphisms
Expression quantitative trait locus (eQTL) analysis is a powerful method to identify the link between the expression of a target gene and the eSNP.36 To explore the genetic basis of variation in MAPK3 expression, we extracted 135 significant MAPK3 eQTL SNPs from the Genotype-Tissue Expression database (GTEx, https://www.gtexportal.org/home) (Supplementary Table 24), and intersected them with the 58 residual haplotype SNPs, finding 25 whose minor alleles (Supplementary Table 25 and Supplementary Fig. 10) are significantly associated with reduced MAPK3 expression in brain/neurons (Fig. 6A and labelled yellow in Supplementary Table 1). This regulation is consistent with our observation of lower MAPK3 expression from the Del_H1 compared to the Del_H2 haplotype. For PRRT2 or PAGR1, no consistent association between expression levels and residual haplotype in brain/neurons was reported in the GTEx eQTL database.
![Haplotype-specific cis-regulation of MAPK3 in 16p11.2 deletion. (A) 16p11.2 region (chr16:29,923,426–30,057,770; hg19 version) showing gene content, enhancer/promoter regions from the GeneHancer database and RNA-seq from the ENCODE database. Custom tracks include 2077 bait probes designed for target sequencing (black tracks), 58 SNPs of the phased residual haplotype showing complete LD in the Chinese CIP-NDD-16p11.2del cohort (black tracks), 25 potential regulatory SNPs associated with MAPK3 expression in brain in the GTEx database (black tracks), eight non-coding eRNA products covering eSNPs (red tracks) designed for the RT-PCR experiment and four fragments covering eight eSNPs (blue tracks) designed for the in vitro luciferase reporter assay. One reported regulatory SNP associated with schizophrenia is labelled with a black arrowhead. One enhancer fragment of GH16J029972 (1627 bp, black box containing blue vertical bar-lines in the reporter-assay track, labelled yellow in Supplementary Table 3, rs11901/rs4318227) failed in PCR amplification. (B) RT-PCR products of eight non-coding eRNAs using cDNA template of 16p11.2del [n = 4, two Del1 clones (Del_H1) and two Del2 (Del_H2) clones] and control NPCs (n = 2, two clones of C1), cDNA template from blood (n = 2) were also used for RT-PCR to validate NPC-specific eRNA product. The PCR product using DNA template of blood (n = 2) was used for regular PCR to confirm unique genomic sequence. The primers of eight eRNA fragments are listed in Supplementary Table 3. (C) Comparison of the luciferase activities of the entire GH16J029925 (A/-/G/A as a major enhancer; G/A/A/G as a minor enhancer) in HEK293 cells. The entire GH16J029925 contains four haplotype-specific eSNPs (rs12716972/rs1302842915/rs12716973/rs4420550). (D and E) Comparison of the luciferase activities of caudal GH16J029972 in HEK293 cells using two haplotype-specific eSNPs. (D) rs4583255, major allele is A and minor allele is G; (E) rs11150577, major allele is G and minor allele is A. The y-axis represent fold-changes of luciferase activity relative to the empty pGL3 promoter vector. t-test with two tailed P-values, ***P < 0.001, **P < 0.01, *P < 0.05. Each box and whisker plot indicates median (line within box), mean (+), interquartile range (box outline), maximum and minimum values (whiskers).](https://oup.silverchair-cdn.com/oup/backfile/Content_public/Journal/brain/146/8/10.1093_brain_awad071/1/m_awad071f6.jpeg?Expires=1750215855&Signature=0PnkHxEPv~9LrMRtzRz5owgBomcxtP3IhIE0gC3o8gvK1npWfUjThRhahWhXWiU1J-Zrffr06ZDtiqb5qw2SVICDxfCeuDsuxAhbIVm3s9kuw3Erkphrih7276bEGwsCOrGkvBPAxzUs-O5ZEf7qN02PuR5JRIlvNtgTtcGnELeBGb0dqZofbI~a9HG~soWdlNt21WyP76nDaEaTM1DY6eraa0WetqYJWBeFif0DRzHySm1zmMm~WgbujThCA6AyjdtKY~r0RZl3avw75zG79And-729fd~S9X8-upG2wNBnhdwTx8umc20ZHfi4VdL85tak0BVYb0lwxucMr~0hjw__&Key-Pair-Id=APKAIE5G5CRDK6RD3PGA)
Haplotype-specific cis-regulation of MAPK3 in 16p11.2 deletion. (A) 16p11.2 region (chr16:29,923,426–30,057,770; hg19 version) showing gene content, enhancer/promoter regions from the GeneHancer database and RNA-seq from the ENCODE database. Custom tracks include 2077 bait probes designed for target sequencing (black tracks), 58 SNPs of the phased residual haplotype showing complete LD in the Chinese CIP-NDD-16p11.2del cohort (black tracks), 25 potential regulatory SNPs associated with MAPK3 expression in brain in the GTEx database (black tracks), eight non-coding eRNA products covering eSNPs (red tracks) designed for the RT-PCR experiment and four fragments covering eight eSNPs (blue tracks) designed for the in vitro luciferase reporter assay. One reported regulatory SNP associated with schizophrenia is labelled with a black arrowhead. One enhancer fragment of GH16J029972 (1627 bp, black box containing blue vertical bar-lines in the reporter-assay track, labelled yellow in Supplementary Table 3, rs11901/rs4318227) failed in PCR amplification. (B) RT-PCR products of eight non-coding eRNAs using cDNA template of 16p11.2del [n = 4, two Del1 clones (Del_H1) and two Del2 (Del_H2) clones] and control NPCs (n = 2, two clones of C1), cDNA template from blood (n = 2) were also used for RT-PCR to validate NPC-specific eRNA product. The PCR product using DNA template of blood (n = 2) was used for regular PCR to confirm unique genomic sequence. The primers of eight eRNA fragments are listed in Supplementary Table 3. (C) Comparison of the luciferase activities of the entire GH16J029925 (A/-/G/A as a major enhancer; G/A/A/G as a minor enhancer) in HEK293 cells. The entire GH16J029925 contains four haplotype-specific eSNPs (rs12716972/rs1302842915/rs12716973/rs4420550). (D and E) Comparison of the luciferase activities of caudal GH16J029972 in HEK293 cells using two haplotype-specific eSNPs. (D) rs4583255, major allele is A and minor allele is G; (E) rs11150577, major allele is G and minor allele is A. The y-axis represent fold-changes of luciferase activity relative to the empty pGL3 promoter vector. t-test with two tailed P-values, ***P < 0.001, **P < 0.01, *P < 0.05. Each box and whisker plot indicates median (line within box), mean (+), interquartile range (box outline), maximum and minimum values (whiskers).
Of the 25 eQTL SNPs, 24 are non-coding variants and one (rs3935873) is a synonymous variant in DOC2A. We further compared to regulatory elements in the GeneCard database27 and found that 10 SNPs map to three regulatory elements (GH16J029925, GH16J029961, GH16J029972; Fig. 6A), with 2–4 SNPs in each element (Supplementary Table 1), suggesting that these may act as eSNPs to regulate MAPK3 expression. We also examined the potential physical interactions within the 16p11.2 region using public Hi-C data of developed cortex37 via the 3D Genome Browser (http://3dgenome.fsm.northwestern.edu/index.html).38 The phased haplotype and MAPK3 localize to the same large topologically associated domain (Supplementary Fig. 11), consistent with potential long-range regulation by this haplotype.
The identification of eRNA products can be direct evidence of enhancer function,39 so we aligned our NPC RNA-Seq data to the genomic locations of enhancers. RNA reads piled up at three annotated non-coding enhancer regions (Supplementary Fig. 12), confirming the existence of eRNA products. The eRNA levels in 16p11.2del cells were about half of that of controls but there was no significant difference between 16p11.2del cells presenting different residual haplotypes. We also performed RT-PCR after DNA digestion to validate the existence of eRNA fragments (130–359 bp; Supplementary Table 3) (red vertical bar-lines in the eRNA-amplification track; Fig. 6A). Eight small eRNA fragments covering intronic regions (Lanes 3–8 in Fig. 6B) were successfully amplified and confirmed by Sanger sequencing. Seven eRNAs (eRNA1-3, 5–8) were expressed in both NPCs and blood, while eRNA4 was weakly expressed only in NPCs. Reads covering these amplicons were also seen in RNA-Seq data (Supplementary Fig. 12).
We next amplified long haplotype-specific fragments successfully covering six eSNPs in two enhancers (GH16J029925 and GH16J029972; Supplementary Table 3), inserted them into the pGL3-promoter vector and performed in vitro luciferase assays (blue vertical bar-lines in the reporter-assay track; Fig. 6A). This included one long fragment (2564 bp, covering four eSNPs and the entire GH16J029925 element, rs12716972/rs1302842915/rs12716973/rs4420550) and two short fragments (326 and 367 bp, covering two eSNPs and the caudal portion of GH16J029972, rs11150577 and rs4583255).
The regulatory activities of the different enhancer fragments were compared in HEK293T cells. The Del_H1 version of GH16J029925 (G/A/A/G at rs12716972/rs1302842915/rs12716973/rs4420550) led to significantly reduced luciferase activity compared to the Del_H2 version (A/-/G/A) (Fig. 6C; P = 0.002). For the partial GH16J029972, minor alleles for two eSNPs (G at rs4583255, A at rs11150577) led to significantly reduced luciferase activity compared to the corresponding major alleles (A at rs4583255, G at rs11150577) (Fig. 6D and E; rs4583255, P < 0.01; rs11150577, P < 0.01). The reduction index of rs11150577 was higher than that of rs4583255 (92.7% versus 47.4%). These results indicate that eSNPs of the residual haplotype (GH16J029972 and GH16J029925) can regulate the expression of MAPK3 via enhancer activity.
Association of the minor residual haplotype with NDD in 16p11.2 carriers
We next asked whether the residual 16p11.2 haplotype is associated with NDD penetrance. As a quantitative severity of NDD phenotype was not available for all 16p11.2del carriers, we pursued the alternative route of comparing the relative frequency of residual haplotypes in three different 16p11.2del cohorts (Table 1), including 18 with ASD (SFARI-ASD-16p11.2del), 29 with CS (PUMCH-CS-16p11.2del) and our 31 with NDD (CIP-NDD-16p11.2del). We postulated that PUMCH-CS-16p11.2del patients are more likely to be non-NDD or mild NDD because they came to hospital for CS rather than for NDD.
The residual haplotypes of the ASD and CS patients were phased by analysis of whole-genome sequence or SNP array. The minor Del_H1 residual haplotype was significantly enriched in our NDD cohort compared to the CS cohort (61% versus 10%, P < 0.001) but not compared to the ASD cohort (61% versus 44%, P > 0.05). The frequency of the minor Del_H1 residual haplotype in all three cohorts deviated from the minor allele frequencies in the general population (34–39%), suggesting that the presence of this haplotype increases the risk of NDD phenotypes in 16p11.2del carriers. This finding is also consistent with the different phenotypes of our four 16p11.2del iPSC donors. Both carriers with the residual minor haplotype (Del_H1) showed more symptoms or more severe NDD than their intra-family carriers with the major haplotype (Del_H2) (Supplementary Table 5).
Discussion
Neuronal cell models from patient-derived 16p11.2del hiPSCs have been investigated previously, but all were from Western subjects,18-20,40 mainly from SFARI.30 No such resource has been available representing the Asian population, so we generated 20 hiPSC lines for two Chinese families with 16p11.2del and banked them as a publicly available resource (China Center for Type Culture Collection, http://www.cctcc.org) for exploring the potential ethnic differences of 16p11.2del. As an initial use, we have characterized the residual haplotype for these 16p11.2del subjects.
Recurrent 16p11.2del is associated with broad NDDs with variable penetrance1,5,7,41 and with other disorders such as CS,26 high body mass index,42 neuroblastoma43 and anaemia/iron deficiency.44 Recently, two groups reported 16p11.2del as a risk factor for congenital anomalies of the kidney and urinary tract (CAKUT).45,46 Both pointed to TBX6 gene dosage as a major determinant of the pathogenesis of CAKUT when it combines with the three known hypomorphic CS-related alleles (rs2289292T/rs3809624C/rs3809627A) that our group studied previously.26 In some genomic disorders, individual genes are recognized as causative of specific clinical phenotypes via haploinsufficiency in deletion subjects and/or triplo-sensitivity in duplication subjects.47 Previous studies of 16p11.2del in the peripheral blood,48 patient-derived or CRISPR-edited isogenic hiPSCs35 and NCs18 has confirmed pathogenic consequences without identifying an unequivocal driver of NDD, although at least three different candidates (MAPK3, KCTD13 and TAOK2) have been implicated in animal models.8-11,13,14 Recent studies of isogenic 16p11.2del human cells and various tissues from a mouse model have indicated that the molecular effects are widespread but highly cellular context-specific,12,15-17,21 suggesting that different phenotypes may each have one or more different contributors, potentially acting in different cell types.
Our analysis of molecular and cellular phenotypes in 10 hiPSC-derived NCs from four 16p11.2del carriers and results of downregulating MAPK3 expression in these cells indicates that MAPK3 haploinsufficiency is a major contributor.
MAPK3 (mitogen-activated protein kinase 3), is associated with ERK pathway activation affecting neural differentiation and proliferation.49 It has recently been reported to show a greater than expected rate of de novo missense mutations in a population-based study of ASD/ID/DD50 suggesting that heterozygous MAPK3 inactivation can lead to NDDs. Functional studies in both the mouse12,51 and Drosophila models52 have also supported MAPK3 as a potential contributor to NDD. Moreover, abnormal MAPK signalling has been implicated by previous transcriptomic data from hiPSC-derived NCs and organoids from 16p11.2del carriers presenting macrocephaly.18-20,40 In our study, MAPK3 was implicated as contributing to these disruptions via altered ERK signalling and, on the basis of rescue experiments, appeared to be a major contributor to the electrophysiological differences in this cellular context. Failed rescued body size in the 16p11.2del, 16p11.2del of diverse haplotypes may be due in part to the small number of cell donors, or to the variable level of MAPK3 expression achieved, which was more variable than control cells and did not significantly exceed wild-type expression levels (Supplementary Fig. 4), and/or to non-linearity of rescue effects that could reflect different levels of MAPK3 expression being required to rescue cellular phenotypes. The last might explain the greater comparative responsiveness of the Del_H2 cells to lentiviral MAPK3. The potential contributions from other 16p11.2 genes to cellular phenotypes cannot be excluded. For example, MAPK3 and TAOK2 are both involved in synaptic assembly and signalling53 and ALDOA is a participant in the MAPK signalling pathway during neuronal differentiation.54 Pervasive genetic interaction between MAPK3 and other 16p11.2 genes has also been reported in Drosophila11 where suppressor, enhancer and additive interactions have been observed. Such interactions and their contributions to MAPK signalling have not yet been explored in human cells and represent a potentially fruitful avenue for future investigation.
The variable penetrance and expressivity of NDD due to 16p11.2del, even intra-family, is another intriguing issue. Our previous 16p11.2-related CS study demonstrated that hypomorphic regulation of TBX6 expression due to three SNPs26 so we compared the residual haplotypes in our NDD 16p11.2del carriers. An extended residual haplotype (132 kb) is associated with the level of MAPK3 expression from the non-deleted chromosome and with differential individual molecular and cellular phenotypes or rescue effects, suggesting the possibility that different levels of MAPK3 expression are required to elicit or prevent different phenotypes.
Enhancers SNPs (eSNPs) are regulatory DNA variants able to modulate the expression of a target gene dozens of kb away.55 In the residual 16p11.2 haplotype, 25 SNPs are associated with MAPK3 expression in brain tissue, and 10 are eSNPs (GH16J029972, GH16J029961, GH16J029925). Since long-distance, even cell-type-specific, cis-regulation due to non-coding variants has been reported in NCs56 and human frontal lobe,57 we further validated the regulatory roles for six eSNPs (rs12716972, rs1302842915, rs12716973, rs4420550, rs11150577, rs4583255) at two enhancers (GH16J029972 and GH16J029925) by in vitro assay. One of these eSNPs (rs4420550) (black arrow in Fig. 6A) has been reported to regulate MAPK3 expression and confer increased risk of schizophrenia58 in a study that assessed regulatory function in vitro using a short fragment (589 bp) with results similar to ours with the same alleles. We designed our assay to test the entire GH16J029925 fragment (2564 bp, containing rs12716972/rs1302842915/rs12716973/rs4420550), comparing the major enhancer haplotype (A/-/G/A) against the minor enhancer haplotype (G/A/A/G). In addition, we confirmed the potential regulatory role of another enhancer, GH16J029972, using two short eSNP fragments (326 bp for rs11150577, 367 bp for rs4583255). As these regulatory elements (chr16:29,936,654–29,988,941) and MAPK3 (chr16:30,125,426–30,134,630) are in different LD blocks and separated by a large distance (about 137 kb) but in the same TAD, we suspect that these enhancers exert their cis-regulatory effects via long-range spatial contacts. It is conceivable that the effects of this regulatory haplotype are not entirely limited to MAPK3. Several other 16p11.2 genes appeared to show lower expression from the minor residual haplotype, but only MAPK3 and PAGR1 survived qRT–PCR confirmation (Fig. 5B and Supplementary Fig. 7). Similarly, the schizophrenia study also pointed to rs4420550 as associated with the expression of several 16p11.2 genes (INO80E, KCTD13, TAOK2, ALDOA, HIRIP3) beyond MAPK3, suggesting a broader potential regulatory role of this long residual haplotype.
Although we cannot exclude contributions from other 16p11.2 genes or modifier genes elsewhere in the genome, our delineation of eSNPs associated with cis-regulation of MAPK3 expression offers a potential explanation for the variable penetrance associated with 16p11.2del NDD phenotypes. We tested this possibility using three clinical patient cohorts with 16p11.2del ascertained on the basis of different criteria. The minor residual haplotype was indeed associated with increased risk of NDD/ASD in 16p11.2del carriers. We also explored the relationship of the 58 SNP-based haplotype and TBX6 expression assessable in GTEx. In contrast to MAPK3, the regulation of TBX6 expression by this residual 16p11.2 haplotype is predominantly outside brain, where the minor alleles are consistently significantly associated with increased TBX6 expression in a broad range of peripheral tissues. These opposite cis-regulatory effects on MAPK3 and TBX6 expression in brain and periphery, respectively, provide a potential explanation for the relative penetrance of CS and NDD in 16p11.2del subjects and the different frequencies of Del_H1 and Del_H2 residual haplotypes in the CS and NDD cohorts. Such cis-regulatory mechanisms could well extend to other phenotypic differences in 16p11.2del subjects and in those with other CNV disorders. The analysis of the residual haplotype in deletion CNV syndromes might be particularly useful in identifying contributor genes in phenotypically extreme subjects with such disorders.
Limitations and future directions
First, the number of hiPSC clones of 16p11.2del carriers in this study was limited, and the analysis of many more 16p11.2del carriers is needed to replicate residual haplotype-specific molecular and cellular phenotypes, to determine whether the haplotype modifier effect also acts on other 16p11.2 genes and to search for effects of modifier genes outside the 16p11.2 segment. Second, spatial DNA contacts are important for long-range regulation of gene expression in human brain,59,60 but the evidence for it here is indirect and would benefit from future experimental confirmation. Mapping the spatial regulation landscape of 16p11.2del in hiPSC-derived NCs and organoids should be performed to decode the direct regulatory effects of the 16p11.2del during early neurogenesis.
Funding
We appreciated obtaining access to (Simons Searchlight 16p11.2 Phase 2 and Phase 1 Dataset) data on SFARI Base (https://www.sfari.org/), and thank Chigene (Beijing) Translational Medical Research Center Co., Ltd for 600 Chinese WGS data. This work was supported by grants from the Beijing Natural Science Foundation (7202019 to Xiaoli Chen), the National Natural Science Foundation of China (31671310 to Xiaoli Chen); Capital Health Research and Development of Special Fund (2020-1-4071 and 2020-2-1131 to Xiaoli Chen), the Innovation Project of Beijing Municipal Human Resources and Social Security Bureau to Xiaoli Chen. Research Foundation of Capital Institute of Pediatrics (CXYJ-2021006 to Xiaoli Chen). The work from PUMCH team was funded in part by the National Natural Science Foundation of China (82072391 to N.W.), and the CAMS Innovation Fund for Medical Sciences (CIFMS, 2021-I2M-1-051 to J.Z. and N.W.)
Competing interests
The authors report no competing interests.
Supplementary material
Supplementary material is available at Brain online.
References
Author notes
Fang Liu, Chen Liang, Zhengchang Li and Sen Zhao contributed equally to this work.

