


Abstract
With more than 40 causative genes identified so far, autosomal dominant cerebellar ataxias exhibit a remarkable genetic heterogeneity. Yet, half the patients are lacking a molecular diagnosis.
In a large family with nine sampled affected members, we performed exome sequencing combined with whole-genome linkage analysis. We identified a missense variant in NPTX1, NM_002522.3:c.1165G>A: p.G389R, segregating with the phenotype. Further investigations with whole-exome sequencing and an amplicon-based panel identified four additional unrelated families segregating the same variant, for whom a common founder effect could be excluded. A second missense variant, NM_002522.3:c.980A>G: p.E327G, was identified in a fifth familial case. The NPTX1-associated phenotype consists of a late-onset, slowly progressive, cerebellar ataxia, with downbeat nystagmus, cognitive impairment reminiscent of cerebellar cognitive affective syndrome, myoclonic tremor and mild cerebellar vermian atrophy on brain imaging.
NPTX1 encodes the neuronal pentraxin 1, a secreted protein with various cellular and synaptic functions. Both variants affect conserved amino acid residues and are extremely rare or absent from public databases. In COS7 cells, overexpression of both neuronal pentraxin 1 variants altered endoplasmic reticulum morphology and induced ATF6-mediated endoplasmic reticulum stress, associated with cytotoxicity. In addition, the p.E327G variant abolished neuronal pentraxin 1 secretion, as well as its capacity to form a high molecular weight complex with the wild-type protein. Co-immunoprecipitation experiments coupled with mass spectrometry analysis demonstrated abnormal interactions of this variant with the cytoskeleton. In agreement with these observations, in silico modelling of the neuronal pentraxin 1 complex evidenced a destabilizing effect for the p.E327G substitution, located at the interface between monomers. On the contrary, the p.G389 residue, located at the protein surface, had no predictable effect on the complex stability.
Our results establish NPTX1 as a new causative gene in autosomal dominant cerebellar ataxias. We suggest that variants in NPTX1 can lead to cerebellar ataxia due to endoplasmic reticulum stress, mediated by ATF6, and associated to a destabilization of NP1 polymers in a dominant-negative manner for one of the variants.
Introduction
Autosomal dominant cerebellar ataxias (ADCA) are neurodegenerative disorders characterized by a cerebellar syndrome, combining gait alteration, limb incoordination, eye movement anomalies and dysarthria.1 The clinical picture can be completed by pyramidal manifestations, neuromuscular signs, movement disorders, cognitive impairment, or pigmentary retinal degeneration.2,3 Up to now, 43 genes have been implicated, carrying either pathological CAG repeat expansions leading to polyglutamine expression, pathological non-coding repeat expansions or coding point variants.4 The causative gene remains still unidentified in about 50% of patients.3,5
Various pathways underlie ADCA physiopathology,6 whose prominence depends on the geographical origin of the patients. For example, mutations in genes coding for channels are frequent in Caucasian cohorts,5 but rather rare in Chinese Han populations.7 Other common pathways include toxic accumulations of polyglutaminated proteins or repeat RNA,8 autophagy, transcriptional dysregulation and signal transduction alteration.3,9 Endoplasmic reticulum (ER) dysfunction has only been reported in a few instances of ADCA,10 but is often implicated in the physiopathology of spastic paraplegias,11 increasingly recognized as part of a spectrum including cerebellar ataxias.12,13
In this study, we performed whole-exome sequencing in five ADCA patients from two independent pedigrees. We identified a recurrent segregating missense mutation in the neuronal pentraxin 1 (NPTX1) gene, encoding the ER protein NP1. Targeted sequencing in 412 unrelated ADCA patients, as well as diagnostic exome and genome sequencing in 1352 ataxia cases, allowed identification of three additional pedigrees with a total of five patients carrying the same. A second variant was also identified in another familial case. Functional studies showed that the variants induce ER stress and morphological rearrangement, probably explaining the cytotoxicity observed in vitro. Protein modelling, biochemistry experiments and mass spectrometry suggested a deleterious impact on the formation of a multimeric NP1 complex for one of the variants.
Materials and methods
Description of cohorts and databases
In five ADCA patients from families AAD271 and AAD347, a recurrent change in NPTX1 was identified with whole-exome sequencing, associated with whole-genome linkage analysis in the first pedigree. To reinforce the presumption for pathogenicity and exclude a rare polymorphism, further examinations of patients’ cohorts and databases were performed.
A first cohort of 412 index patients, recruited via the SPATAX network (https://spatax.wordpress.com/ Accessed 2 February 2021), with documented autosomal transmission of cerebellar ataxia and no CAG/polyglutamine expansions, was studied with an amplicon-based panel. Specific clinical characteristics were previously reported5 and additional details on the cohort recruitment can be found in the Supplementary material. For 353 of these index patients, no relevant variant was found in a known ADCA gene. A second cohort of 13 535 European patients, including 1352 ataxia cases and more than 10 000 ethnically matched controls or patients without neurological phenotype, was sequenced with whole exome or whole genome in Tübingen. Finally, the public gnomAD database includes 251 148 alleles for this variant, of which 113 534 are of European non-Finnish descent, hence ethnically relevant.
Whole-genome linkage analysis
The genomic DNA of all sampled individuals of Family AAD271 was analysed for 6090 single nucleotide polymorphisms markers using the LINKAGE_24 microarrays (Illumina) according to the supplier’s recommendations. Multipoint logarithm of odds (LOD) scores were calculated using MERLIN 1.1.214 under an autosomal dominant model with 80% penetrance and a disease frequency of 1/100 000 (Supplementary Fig. 1A). Chromosomal regions with a LOD score inferior to –2 were filtered out in the exome analysis.
Whole-exome sequencing
The whole exomes of, respectively, three and two affected patients from families AAD271 and AAD347 (Fig. 1) were captured with the SureSelect Human All Exon 50 Mb kit (Agilent Technologies) and sequenced (paired-ends 75 bp) on a Hiseq2000 sequencer (Illumina), according to the manufacturer’s recommendations. Bioinformatic processing of the reads and filtration steps for the variant are detailed in the Supplementary material. Segregation in available samples was confirmed by Sanger sequencing and the BigDye chemistry (Applied Biosystems; Fig. 1A). The clinical significance of the variants was assessed with the ClinVar (clinvar_20140929) database, while their pathogenic effect was estimated using sequence-based prediction algorithms (PolyPhen-2,15 Sift,16 MutationTaster,17 PROVEAN18 and CADD19). In the two affected family members of family LUEB01 and the index patient of family BER01, from the Tübingen cohort, exome sequencing and variant filtering was performed as described previously.20

Pedigrees and characterization of the mutations. (A) Segregation of the mutations in the six pedigrees. Filled symbols show affected patients, grey the asymptomatic individuals. Asterisks indicate patients for whom whole-exome sequencing was performed, and numbers refer to the patients’ codes. M1 = p.G389R mutation (red), M2 = p.E327G mutation (blue), + = wild-type. (B) Schematic representation of NP1 protein with the positions of both variants relative to the known functional domains. (C) Alignment of NP1 protein sequences surrounding the p.E327G and p.G389R mutations in various species. The arrowhead points to the mutated amino acid. (D) Alignment of NP1 protein sequences surrounding the p.E327G and p.G389R mutations among other members of the pentraxin family in human. The arrowhead points to the mutated amino acid.
Cohort sequencing with amplicon-based panel
The SPATAX cohort was sequenced with an amplicon-based gene panel covering 65 known or candidate ADCA genes, including NPTX1.6 PCR was performed using the Fluidigm workflow according to the manufacturer’s recommendations and sequences were generated with the NextSeq500 sequencer (Illumina). Variants were filtered for quality, effect on coding sequence, frequency in public and internal databases (<0.01%) and heterozygosity. All variants of interest were confirmed via Sanger sequencing.
Mammalian expression vectors, cell culture, transfection
Gateway cloning technology (Thermo Fisher Scientific) was used to generate C-terminal-tagged pEZY-MycHis and pLEX_307-V5 plasmids (Addgene) containing NPTX1 wild-type cDNA via recombination with pDONR221 (DNASU Plasmid repository, Arizona State University, AZ, USA) following the manufacturer’s protocol. A QuickChange Site-Directed Mutagenesis kit (Agilent Technologies) was used with standard procedures to generate the tagged mutated variants, NPTX1-p.E327G and NPTX1-p.G389R. COS7 cells were cultured and transfected following standard procedures described in the Supplementary material.
Immunochemistry, epifluorescence, confocal microscopy
For immunochemistry, 20 000 cells per well of 24-wells plates were seeded on glass coverslips coated with 500 µg/ml poly-D-lysine for 24 h. Forty-eight hours after transfection, cells were fixed and immunochemistry was performed according to standard procedures, described in the Supplementary material. Antibodies used are listed in Supplementary Table 1.
All mice experiments were performed according to good practice of handling laboratory animals consistent with the Canadian Council on Animal Care and approved by the University and Montreal Neurological Institute Animal Care committees. Mice were anaesthetized with 100 mg/ml ketamine, 20 mg/ml xylazine and 10 mg/ml acepromazine, then perfused transcardially with 0.9% NaCl followed by 4% paraformaldehyde. Brains were dissected, post-fixed for 2 h at 4°C in the same fixative, then equilibrated in 30% sucrose/PBS. Sagittal sections (35 μm) were cut using a freezing sled microtome. Details on immunofluorescence are provided in the Supplementary material.
Images were obtained with an Olympus FV-1000 confocal microscope (60× oil immersion objective, NA 1.35) and the Olympus FV-1000 software (Olympus) or with an Olympus IX83 inverted microscope (100× oil immersion objective NA 1.4) with appropriate lasers using Yokogawa spinning disc confocal technology coupled to a Neo camera (Andor).
Electron microscopy
Eight-well glass-bottom microscope slides (Ibidi) were used for cell culture and transfection as described above. In each slide, two wells were transfected by each V5-tagged plasmids and two were not transfected and used as negative controls. All experiments were performed in triplicate; two slides were used for electron microscopy and one for immunofluorescence microscopy, to assess transfection effectiveness. Standard protocols were used and are detailed in Supplementary material. We analysed 40–50 cells per condition.
Total RNA isolation, reverse-transcription, XPB1 splicing
Two hundred and fifty thousand cells were seeded per well in six-well plates. One well was treated with 50 nM thapsigargin for 6 h as a positive control. Forty-eight hours after transfection, total mRNA was isolated using the RNeasy plus mini kit (Qiagen). Total RNA concentration and purity were measured on a NanoDrop spectrophotometer (NanoDrop Technologies, Thermo Fisher Scientific). cDNA synthesis was performed with iScript™ cDNA Synthesis Kit (Bio-Rad).
The following primers were used to amplify the spliced and unspliced XBP1 mRNA (forward: GGAGTGGAGTAAGGCTGGTG, reverse: CCAGAATGCCCAAAAGGATA). PCR products were electrophoresed on 3% agarose gel. The size difference between spliced and unspliced XBP1 isoforms is 26 nucleotides.
Cytotoxicity, proliferation, cell death analysis
Five thousand and 15 000 cells per well were, respectively, seeded in 96-well or 12-well (cell death analysis) plates and transfected for 48 h. For cytotoxicity assays, lactate dehydrogenase was quantified in the supernatant according to the manufacturer’s protocol (CytoTox 96® Non-Radioactive Cytotoxicity Assay, Promega). For proliferation, cells were analysed with the Cell Proliferation Kit (MTT tetrazolium salt based; Roche). Absorbances at 450, 492 and 690 nm were measured using a microplate reader (Spectramax Plus, Molecular Device). For cell death analyses, cells were counted with TC20™ Automated Cell Counter (Bio-Rad) using trypan blue staining with a final concentration at 0.2% (Gibco).
Protein extraction, western blot analyses, blue native PAGE
Proteins were extracted from COS7 pellets; as well as from dissected brain, kidney, liver, gastrocnemii muscles, stomach and spleen from a female 6-month-old wild-type C57B6 mouse. Detailed procedures are described in the Supplementary material.
Proteins were resolved by sodium dodecyl sulphate–polyacrylamide gel electrophoresis (SDS-PAGE), analysed by western blotting (antibodies in Supplementary Table 1) and visualized with fluorescent antibodies or by enhanced chemiluminescence (Pierce or Perkin Elmer, Thermo Fisher Scientific). Fluorescence/chemiluminescence signals were captured with the Odyssey Imaging System (Li-COR), detected on a film (ECL, Amersham Hyperfilm, GE Healthcare), with the Chemidoc Touch Imaging System (Bio-Rad) or with the Intas ChemoCam Imager (Intas Science Imaging) and quantified with Li-COR Image Studio (Li-COR, Lincoln, NE, USA), Image Lab Software (Bio-Rad) or ImageJ software (NIH, Bethesda, MD, USA).
Blue native PAGE was used for separation of the NP1 complexes on 6–15% polyacrylamide gradient gels. Cells were digitonized in 0.8 mg of digitonin/mg of proteins and centrifuged at 10 000g for 10 min. Pellets were solubilized with 1% lauryl maltoside. Twenty milligrams of proteins were used for electrophoresis. Protein ladder and complexes I and V of the respiratory chain were used as molecular size controls, using specific monoclonal antibodies (Molecular Probes, Thermo Fisher Scientific).
Immunoprecipitation assay on supernatants
Two hundred and fifty thousand COS7 cells per well were transfected in 6-well plates for 48 h. One millilitre of supernatant from each condition was harvested and pre-cleared overnight with non-coated Dynabeads Protein A (Invitrogen) to reduce non-specific binding. Binding of V5 antibody to Dynabeads Protein A was performed overnight. Antibodies were then cross-linked to the beads using 20 mM dimethyl pimelimidate (Sigma-Aldrich). The immunoprecipitation reaction was performed overnight at 4°C. Samples were eluted using 0.1 M glycine pH 2.5/0.5% n-dodecyl-β-D-maltoside (DDM). After addition of Laemli buffer, samples were denaturated at 95°C for 8 min, resolved by SDS-PAGE and analysed by western blotting. Cell pellets were lysed and analysed as before.
Co-immunoprecipitation assay, mass spectrometry analysis
For immunoprecipitations, transfected cells were pelleted and rinsed once with PBS buffer. Proteins were extracted in 200 µl of lysis buffer (10 mM Tris–HCl pH 7.5, 150 mM NaCl, 1% DDM, Sigma-Aldrich), with complete protease inhibitors (Roche) on ice for 30 min, then centrifuged at 20 000g at 4°C for 20 min. The supernatants were immunoprecipitated as described above. After elution, samples were precipitated with trichloroacetic acid and analysed by mass spectrometry on an Orbitrap (Thermo Fisher Scientific). Positive hits were read more than 10 times in the sample versus 0 in the control.
Protein modelling and stability prediction
The X-ray structure of the pentraxin domain of human NP1 has recently been resolved in monomeric form at 1.45 Å resolution21 [Protein Data Bank (PDB) code 6YPE, https://www.rcsb.org/structure/6YPE]. To model the pentameric structure of NP1, we used the experimental structure of two other proteins from the pentraxins family: human serum amyloid P component (SAP) and human C-reactive protein (CRP). Their respective X-ray structures have been resolved at 1.40 Å (PDB code 4AVS, https://www.rcsb.org/structure/4AVS22) and 1.98 Å resolution (PDB code 3PVN, https://www.rcsb.org/structure/3PVN23). They show 25% and 29% sequence identity with NP1’s pentraxin domain, respectively, using the EMBOSS Needle pairwise alignment algorithm.24 We built two models of the homopentamer form of NP1’s pentraxin domain by superimposing the 6YPE structure onto the five subunits of either 3PVN or 4AVS using the PyMOL molecular visualization system. The intra- and interprotein residue–residue interactions were identified using the Protein Interactions Calculator.25
The PoPMuSiC algorithm26 was used to evaluate the stability changes due to the point variants based on the tri-dimensional structure, and the SNPMuSIC27 predictor to estimate their deleteriousness due to stability defects.
Data availability
The data that support the findings of this study are available on request from the corresponding author. The data are not publicly available due to containing information that could compromise the privacy of research participants.
Results
Mutations in NPTX1 are responsible for autosomal dominant cerebellar ataxia
In a large family with nine symptomatic sampled members, we performed whole-exome sequencing combined with genome-wide linkage analysis (Fig. 1A, Family AAD271). Linkage analysis identified nine regions with LOD scores above 1 (Supplementary Fig. 1A). Two heterozygous variants with a predicted effect on the protein sequence were shared by the three sequenced patients, absent or very rare in the gnomAD database, and in a region of putative linkage. Segregation in all affected individuals from the family was verified with Sanger sequencing. A missense variant affecting a partially conserved amino acid in P4HB (chr17: g.79,803,813C>T, NM_000918.3:c.1111G>A: p.V371M), a gene involved in a very different disease, Cole–Carpenter syndrome 1 (OMIM 112240), was considered unlikely to cause the phenotype. On the other hand, a missense variant in NPTX1 (chr17: g.78,444,747C>T, NM_002522.3:c.1165G>A: p.G389R, rs1466750124) affected an amino acid conserved up to zebrafish (Fig. 1C), and was reported in a single allele among 251 148 in gnomAD. It was recurrent in exome data from Family AAD347, in which 15 variants—none in genes involved in known neurogenetic disorders—satisfied the filtering criteria and segregated in the affected individuals (Supplementary Table 2). Through a screening of 412 ADCA index cases, a third patient (AAD938-001) carrying the same variant was identified. He also carried a variant in SPTBN2 (chr11: g.66,472,487C>T, NM_006946:c.G2260A: p.A754T, rs756995292), whose alternate allele, however, is the reference in tetraodon, zebrafish and Caenorhabditiselegans. In addition, it was prioritized by diagnostic exome in an additional two ADCA families of German ancestry, in which no other rare variants of putative clinical relevance in ataxia-associated disease genes were observed. The screening additionally identified a fourth patient (AAD498-003)carrying a different NPTX1 missense variant (chr17: g.78,445,629T>C, NM_002522:c.A980G: p.E327G).
Because of the recurrence of the NPTX1 p.G389R variant in five families of European ancestry, Sanger sequencing was initially performed in a cohort of 96 European Caucasian healthy individuals and did not identify the variant. It was also absent from more than 10 000 in-house diagnostic exome and genome datasets from healthy European controls or probands with non-neurological phenotypes (Institute of Medical Genetics and Applied Genomics, University of Tuebingen). It is observed in a unique allele in the gnomAD database, which includes 251 148 alleles for this variant, of which 113 534 are of European descent, hence ethnically relevant to our patients. Founder effect could be excluded thanks to the identification of different haplotypes covering 5.3 kb in individuals from both families AAD271 and AAD347 (Supplementary Fig. 1B). These observations lent further support to the hypothesis of an independent event and provide firm evidence of a disease-causal role of the p.G389R change in ADCA.
Both variants are localized in the pentraxin domain of the NP1 protein (Fig. 1B) and affect highly conserved amino acids across species (Fig. 1C). PolyPhen-2 (scores above 0.999), MutationTaster (scores of 1) and CADD (scores of 24, p.G389R, and 32, p.E327G) predictions converged towards pathogenicity. SIFT and PROVEAN only estimated the p.E327G variant to be damaging. Alignment of human protein sequences (Fig. 1D) showed the conservation of the p.E327 residue in 4 of 7 members of the pentraxin protein family, including CRP and SAP. The p.G389 glycine was only conserved in PTX4, but all orthologous amino acids at this position are polar, except for the alanine in NPTXR, while the aspartate in CRP is also among the smallest amino acids.
Patients carrying NPTX1 variants present a late-onset, slowly progressive cerebellar ataxia
Clinical evaluation at the National Reference Centre for Rare Diseases in Paris, at their home, at the Department of Neurology/Centre of Rare Diseases in Luebeck and at the Department of Neurology of the Charité University Hospital, Berlin, allowed 15 symptomatic individuals carrying the p.G389R variant to be gathered. They showed a mostly mild cerebellar ataxia with late onset at a mean age of 50.7 ± 7.9 years standard deviation (range 34–71; Table 1) and first examination at 58.7 ± 10.8 years (range 40–79). Follow-up evaluations in five patients demonstrated a slow disease course and mild to moderate ataxia after an evolution of 11.4 ± 7.2 years (range 3–20), at a mean age of 64.2 ± 10 years (range 56–80). There was downbeat nystagmus in most patients. Two patients from the LUEB01 pedigree presented a clinical picture dominated by oculomotor apraxia, with visual blurring on lateral gaze and upon following object motion. Symptoms progressed over 15 years in patient LUEB01-010, from visual disturbances at 43 years of age, to severe oculomotor apraxia with the inability to initiate horizontal saccades and smooth pursuit eye movements. Individual LUEB01-011 first suffered from tremor for about 14 years then developed similar visual disturbances and still remains mildly affected after 4 years. The father (LUEB01-003) and uncle (LUEB01-004) presented gait ataxia and the mutation was detected in the father. Additional signs in the cohort included documented myoclonus or postural non-cerebellar tremor in nine patients; as well as chorea, dystonia and hearing loss in a few cases. No pyramidal signs were noticed while urinary urgencies were occasionally observed. Vibration sense was decreased at ankles in four patients, with electroneuromyographic evidence of axonal sensitive polyneuropathy in two, one in the context of diabetes. Brain MRI showed a mild cerebellar, mainly vermian, atrophy (n = 8/10, Fig. 2) occasionally complicated by white matter hyperintensities or brainstem atrophy in single patients.

Brain imaging of NPTX1-mutated patients. (A) Individual AAD271-017: At age 40, 6 years after onset, T1-weighted sagittal view showed vermian cerebellar atrophy, while brainstem volume was preserved. (B) Individual AAD938-001: At age 62, 12 years after onset, T1-weighted sagittal (top) and coronal (bottom) views demonstrated moderate, predominantly vermian, cerebellar atrophy. (C) Individual AAD271-007: At age 75, 20 years after onset, T1-weighted sagittal (top) and coronal (bottom) views showed global and mild cortical and cerebellar atrophy, predominant on the upper cerebellar vermis.
Follow-up and main clinical characteristics at last examination of 17 patients from six NPTX1-mutated families
| Patient | Age at first/last exam (death) | Age at onset | Predominant sign (handicap/7) | Cerebellar ataxia (SARA) | Ocular signs | Cognitive impairment | Brain MRI | Additional signs/remarks |
|---|---|---|---|---|---|---|---|---|
| AAD271-006a | 77 (83) | 53 | Ataxia (6) | Severe | Nys, saccadic | None | Not done | Chorea |
| AAD271-007a | 60/80 | 55 | Ataxia (3) | Mild (8) | Nys, saccadic | Attention deficit, dysexecutive syndrome | Cerebellar atrophy | Myoclonus, hearing loss |
| AAD271-011a | 58 (72) | 55 | Diplopia (2) | Mild | Nys, square waves, diplopia | none | Not done | Tremor UL |
| AAD271-012a | 54/67 | 47 | Ataxia (2) | Mild | Nys, square waves, diplopia, ptosis | Memory impairment | Vermian atrophy | Swallowing difficulties, extrapyramidal rigidity |
| AAD271-015a | 56 | 54 | Ataxia (2) | Mild (6) | Horizontal nys | Frontal syndrome | Hypophysis adenoma | Tremor (myoclonus?) |
| AAD271-016a | 50 | 49 | Ataxia (1) | Mild (1.5) | Horizontal nys | Mild impairment (dysexecutive) | Not done | Tremor (myoclonus), hearing loss |
| AAD271-017a | 40/56 | 34 | Ataxia (3) | Mild (7) | Downbeat nys | Important attention deficit (dysexecutive) | Moderate cerebellar atrophy | Froment sign |
| AAD271-020a | 48 | AS | None | LL only | Horizontal nys | None | Not done | Postural tremor |
| AAD271-021a | 79 | 71 | Tremor (4) | Moderate (17) | Horizontal nys, upwards limitation | Not done | Not done | Myoclonus |
| AAD271-027a | 48 | 46 | Ataxia (2) | Mild (5) | Horizontal nys | None | Normal | None |
| AAD347-009a | 75 | 52 | Ataxia (6) | Moderate | Horizontal nys, upwards limitation | Not done | Cerebellar atrophy | Truncal dystonic attitude, diplopia since age 35, hearing loss |
| AAD347-026a | 53/56 | 47 | Ataxia (4) | Moderate | nys, hypermetric saccades, ptosis, diplopia | None | Vermian atrophy | None |
| AAD938-001a | 57/62 | 50 | Ataxia (2) | Mild (11.5) | Downbeat nys, saccadic | None | Cerebellar atrophy, white matter changes | None |
| LUEB01-010a | 58 | 43 | Ataxia with oculomotor apraxia (4) | Mild | Horizontal oculomotor apraxia | Apraxia | Mild cerebellar atrophy | Tremor, migraine |
| LUEB01-011a | 56 | 54 | Ataxia with oculomotor apraxia (2) | Mild | Mild gaze-evoked nystagmus | Apraxia (mild) | Normal | Action tremor, migraine |
| BER01_010a | 59 | 50 | Ataxia (2) | Mild | Saccadic | None | Vermian atrophy, white matter hyperintensities | Head tremor |
| AAD498-003b | 48 | 45 | Ataxia | N/A | N/A | N/A | N/A | Family not accessible |
AS = asymptomatic; N/A = not available; nys = nystagmus. Handicap/7: 0, no functional handicap; 1, no functional handicap but signs at examination; 2, mild functional handicap, able to run; 3, moderate functional handicap, unable to run, limited walking without aid; 4, severe functional handicap, walking with one stick; 5, walking with two sticks; 6, unable to walk, requiring wheelchair; 7, confined to bed.
Patients from five pedigrees carried the p.G389R mutation (Individuals AAD271, AAD347, AAD938, LUEB01, BER01).
Patients from Family AAD498 carried the p.E327G variant.
Because of self-reported memory difficulties, neuropsychological evaluations were carried out in Individuals AAD271-007, -011, -016 and -017. They all revealed cognitive impairment, not progressive when assessed at two or three different time points (AAD271-007, -017). They showed impaired attentional skills with attentional errors, attentional fluctuations, slower information processing and difficulties maintaining highly demanding cognitive effort. For three patients, impaired working memory was associated (AAD271-007, -011, -017). The attentional difficulties could be related to visual scanning deficits, but the working memory was assessed with a digit span, which is an auditory test; the cognitive deficit is hence not only due to cerebellar ocular dysfunction. Two patients also exhibited difficulties copying a complex geometric figure, resulting from either executive dysfunction or a more global visuo-constructive deficit (AAD271-007, -011). Attentional difficulties were associated with executive impairment: planning difficulties, impaired mental flexibility and/or impaired inhibition processing. For Individual AAD271-011, the evaluation highlighted a significant interference effect, an executive component in the memorization process, combined with mildly impaired everyday memory performance. Memorization was preserved in a verbal learning and memory test. The self-reported memory difficulties hence seem to be due to attention and executive deficits rather than memory loss. This cognitive profile, also known as cerebellar cognitive affective syndrome (CCAS), is characterized by attentional impairment, executive dysfunction and visuo-constructive deficits.28
Individual AAD271-020 only presented with clinically observable tremor at age 48, without subjective complaint, and was considered to have an unknown disease status. Patient AAD498-003, carrying the p.E327G variant, also presented late-onset ataxia at 45 years. Further clinical data were not available and the family was not reachable for further explorations.
NP1 is an endoplasmic reticulum protein predominantly expressed in Purkinje cells
NP1 protein expression pattern was interrogated in mouse tissues and cellular models.
Western blot experiments using adult mouse tissues demonstrated that, among the tested organs, Np1 is expressed in brain and kidney (Fig. 3A). Those results agree with the human GTEX public expression database, showing NPTX1 mRNA expression restricted to the CNS (Supplementary Fig. 2), particularly in the cerebellum (Fig. 3B). Immunohistochemistry in the adult mouse cerebellum demonstrated expression of Np1 in Purkinje cells, identified by Purkinje cell-specific calbindin labelling (Fig. 3C). Those neurons are pivotal in movement coordination and recurrently affected in cerebellar ataxia.29
![Expression pattern and intracellular localization of NP1 protein. (A) Western blot experiment on adult mouse tissues showed NP1 expression in brain and kidney. Antibody directed against the endogenous protein was used to evaluate the level of NP1 protein in each tissue. Ponceau red staining was used as loading control. Full-length blots are available in Supplementary Fig. 6. (B) Quantification of NPTX1 mRNA in human tissues [data obtained from the GTEX portal accessed on 2 February 2021; https://gtexportal.org/home/gene/NPTX1; expression shown in transcripts per million (TPM)] demonstrated almost exclusive expression in the central nervous system (Supplementary Fig. 2), with a marked predominance for the cerebellum. (C) Immunohistochemistry experiment in the adult mouse cerebellum showed an exclusive expression of NP1 in Purkinje cells. Antibody directed against the endogenous NP1 protein was used (green). Calbindin was used as a marker for Purkinje cells (red) and DAPI for nuclei (blue). (D) Immunofluorescence experiment in COS7 cells demonstrated a perfect co-localization of NP1 and ER staining. A plasmid coding for the wild-type form of NP1 in fusion with Myc and His C-terminal tags was overexpressed. c-Myc antibody was used to stain NP1 (red). The following markers were used to identify different subcellular organelles (green): ER (calreticulin), mitochondria (Tom70), early endosomes (EEA1), Golgi apparatus (GM130) and nucleus (blue, Hoechst). Scale bar = 10 µm.](https://oup.silverchair-cdn.com/oup/backfile/Content_public/Journal/brain/145/4/10.1093_brain_awab407/2/m_awab407f3.jpeg?Expires=1749757676&Signature=HdwxMfmdRxaY6jc8SfUVbQ1l8LJBoe9NEXulK73gLCuqEIag8bMxGecNWNsuOA37vq9n5G6zL~JknsYmyWspRV3-omA0Bt-TyfvgTkRT6z0LngpXUNZ2HNg19WLsp9cQdDb9CZAI2b0b5PblNR9dOAq9SuS3~G~Etxtp8~YGWRz1wu3lqNeQRtCEhhJ3Z6v8bXoGmJjlIex~tRSq45zZ5acTMWPauhpZiTJqyAhazhSe2SrCJVt6IujeIet6BqKxtWPg~7rnk0O7EyqkHGZlClKquB0sYfJ-xT~2R-pMYF8cFgquzBxFNtiXIgF6K3c0IPgikRJS2VPwK03eZVi3kA__&Key-Pair-Id=APKAIE5G5CRDK6RD3PGA)
Expression pattern and intracellular localization of NP1 protein. (A) Western blot experiment on adult mouse tissues showed NP1 expression in brain and kidney. Antibody directed against the endogenous protein was used to evaluate the level of NP1 protein in each tissue. Ponceau red staining was used as loading control. Full-length blots are available in Supplementary Fig. 6. (B) Quantification of NPTX1 mRNA in human tissues [data obtained from the GTEX portal accessed on 2 February 2021; https://gtexportal.org/home/gene/NPTX1; expression shown in transcripts per million (TPM)] demonstrated almost exclusive expression in the central nervous system (Supplementary Fig. 2), with a marked predominance for the cerebellum. (C) Immunohistochemistry experiment in the adult mouse cerebellum showed an exclusive expression of NP1 in Purkinje cells. Antibody directed against the endogenous NP1 protein was used (green). Calbindin was used as a marker for Purkinje cells (red) and DAPI for nuclei (blue). (D) Immunofluorescence experiment in COS7 cells demonstrated a perfect co-localization of NP1 and ER staining. A plasmid coding for the wild-type form of NP1 in fusion with Myc and His C-terminal tags was overexpressed. c-Myc antibody was used to stain NP1 (red). The following markers were used to identify different subcellular organelles (green): ER (calreticulin), mitochondria (Tom70), early endosomes (EEA1), Golgi apparatus (GM130) and nucleus (blue, Hoechst). Scale bar = 10 µm.
In COS7 cells, NP1 is not detectable at endogenous levels with commercial antibodies. To assess its subcellular localization (Fig. 3D), cells were transfected with a plasmid coding for the wild-type form of NP1 C-terminally tagged with Myc-His or V5. Co-staining with subcellular organelles markers confirmed that NP1 co-localizes perfectly with calreticulin, an ER protein. The overexpressed protein was also recognized by an antibody directed against the endogenous NP1 (Supplementary Fig. 3A and B).
NP1 hence seems to exert a crucial role in the cerebellum physiology, while the relevance of ER function in the pathogenesis of cerebellar ataxia is suggested.
Ataxia-linked NPTX1 variants alter ER morphology towards hyperplasia and aggregation
The impact of NP1 variants on its subcellular localization was assessed by overexpressing mutated forms of NP1 in COS7 cells. Both p.E327G and p.G389R variants co-localized with the ER marker calreticulin (Fig. 4A). In western blot experiments, the p.E327G variant consistently showed higher expression when revealed with anti-V5 or anti-Myc antibodies (Fig. 5A and B). Lower signal obtained with an antibody raised against the endogenous NP1 (Supplementary Fig. 3A) might reveal altered binding capacity of the specific antibody to the mutated protein. Upon overexpression of NP1 in COS7 cells, the ER compartment adopted morphologies that we classified as tubular (reticulated and distributed all over the cytoplasm), punctiform (dot-like pattern), or aggregated (around the nucleus or as large cytoplasmic accumulations; Fig. 4B and Supplementary Fig. 3C). Compared to the wild-type, transfection of the p.E327G and p.G389R mutants significantly increased the proportion of aggregated ER morphologies (Fig. 4C).

NP1 mutants induce ER stress response and cytotoxicity. (A) Immunofluorescence experiment in COS7 cells showed that both variants of NP1 still co-localized with the ER markers. Plasmids coding for the wild-type (WT) or mutated forms of NP1 in fusion with Myc and His C-terminal tags were overexpressed. c-Myc antibody was used to stain NP1 (red). Calreticulin antibody was used to stain the ER compartment (green). Scale bar = 10 µm. (B) Immunofluorescence experiments in NP1 overexpressing COS7 demonstrated that ER network can adopt different morphologies, that we classified as tubular (reticulated and distributed all over the cytoplasm), punctiform (dot-like pattern), aggregated 1 (around the nucleus) or aggregated 2 (large accumulation in the cytoplasm). Scale bar = 10 µm. (C) Quantification of the ER network morphology in COS7 cells overexpressing either the WT form of NP1 or the two variants. Expression of the NP1 variants induced ER shape modifications towards more aggregated forms. Three independent experiments were done with at least 30 cells per count. P-values are based on two-way repeated-measures ANOVA and Sidak’s multiple comparison test. Results are expressed as means ± SEM. ***P < 0.001; *P < 0.05. (D) Immunofluorescence experiment in COS7 cells overexpressing the WT or p.E327G mutant form of NP1 protein. Expression of the p.E327G variant induced the nuclear translocation of ATF6 transcription factor. Scale bar = 10 µm. (E) Quantification of the subcellular localization of ATF6, classified as cytoplasmic or nuclear, in COS7 cells either transfected with an empty vector (–) or with a construct coding for the WT or mutant forms of NP1. Expression of the mutated forms of NP1 induced nuclear ATF6 relocalization. At least 40 cells per condition from three independent experiments. P-values are based on ordinary one-way ANOVA and Dunnett’s multiple comparison test, with a single pooled variance. Results are expressed as means ± SEM. **P < 0.01. (F) Quantification of the alive cells number after 48 h of overexpression of the WT or mutated NP1 protein (trypan blue method), normalized compared to transfection with an empty vector. Expression of the p.G389R variant of NP1 slightly decreased the cells survival rates. Three independent experiments were done in duplicate. P-values are based on ordinary one-way ANOVA and Dunnett’s multiple comparison test, with a single pooled variance, and show the comparison between NP1-WT and other conditions. Results are represented with boxes and whiskers and contain six values per condition. The centre line of each box denotes the median value (50th percentile), while the box contains the 25th to 75th percentiles of the dataset. The whiskers mark the 5th and 95th percentiles. *P < 0.05. (G) Quantification of the cellular proliferation using MTT method in COS7 cells transfected with an empty vector or a construct coding for the WT or mutant forms of NP1. Cell proliferation was not affected by either the WT or the variants of NP1. Four independent wells were used for quantification, from one representative experiment out of three independent ones performed. P-values are based on ordinary one-way ANOVA and Dunnett’s multiple comparison test, with a single pooled variance. Results are represented with boxes and whiskers. The centre line of each box denotes the median value (50th percentile), while the box contains the 25th to 75th percentiles of the dataset. The whiskers mark the 5th and 95th percentiles, and values beyond these upper and lower bounds are considered outliers, marked with a diamond. No significant difference was observed. AU: Arbitrary Unit. (H) Quantification of the cytotoxicity based on the measurement of the lactate dehydrogenase released in the supernatant of COS7 cells either non-transfected or overexpressing the WT or mutants forms of NP1 (CytoTox® Non-Radioactive Cytotoxicity Assay). Expression of the two NP1 variants significantly increased the cytotoxicity. Four independent experiments were done in duplicate. P-values are based on ordinary one-way ANOVA and Dunnett’s multiple comparison test, with a single pooled variance, and show the comparison between NP1-WT and other conditions. Results are represented with boxes and whiskers and contain eight values per condition. The centre line of each box denotes the median value (50th percentile), while the box contains the 25th to 75th percentiles of the dataset. The whiskers mark the 5th and 95th percentiles. A dash (–) denotes a non-transfected control. **P < 0.01; *P < 0.05.

Ataxia-linked p.E327G mutation induces a loss of NP1 functions. (A) Top: Immunoprecipitation of NP1 (V5-tag) from culture supernatant of COS7 cells transfected with an empty vector or a construct coding for the wild-type (WT) or mutant forms of NP1. Unlike the WT and the p.G389R variant of NP1, the pE327G variant was never found secreted in the supernatant. Bottom: Cell lysates from the cells described above. V5 antibody was used to detect NP1 protein and alpha tubulin served as a loading control. Full-length blots are available in Supplementary Fig. 7A. (B) Top: Blue-native first dimension experiment on COS7 cells overexpressing the WT or mutant forms of V5-tagged NP1, in combination with the WT His-tagged WT NP1 or not. A complex of approximately 1 MDa was found for both the WT and the p.G389R variant. The complex was not detected when the pE327G variant of NP1 was expressed, which was not rescued by co-expression of the WT form, suggesting a dominant negative effect. Bottom: Western blot experiment from the cells described above. V5 and His antibodies are used to detect the difference version of NP1 protein. Full-length blots are available in Supplementary Fig. 7B. (C) Model of the pentameric structure of the NP1’s pentraxin domain obtained from the SAP structure. The residues E327 are in magenta spheres in all chains, and G389 in red spheres. The Ca2+ ions are in green spheres. (D) Spatial environment of E327 in NP1’s pentraxin domain. Chains A and B are in grey and black ribbons, respectively; E327 in red sticks; the environment in pale green sticks; with K385 in blue and W423 in yellow. (E) Spatial environment of G389 in NP1’s pentraxin domain. Chains A and B are in grey and black ribbons, respectively; the mutated side chain G389R in red sticks; the environment in pale green sticks; with Y392 in blue and R429 in orange.
In transmission electron microscopy experiments, we did not observe any modification of the intracellular morphology in non-transfected (Fig. 6A and B) and NTPX1-WT (Fig. 6C and D) transfected cells. However, consistent with our photonic epifluorescence findings, transfection of the p.E327G (Fig. 6E and F) and p.G389R (Fig. 6G and H) variants recurrently triggered significant hyperplasia of the ER, often associated with swollen cisternae. Cytological differences were linked to the specific variant: the hyperplasic ER was evenly distributed in the cytoplasm with the p.G389R mutant plasmid, while the p.E327G variant led to ER cisternae more likely to cluster as a single perinuclear group.
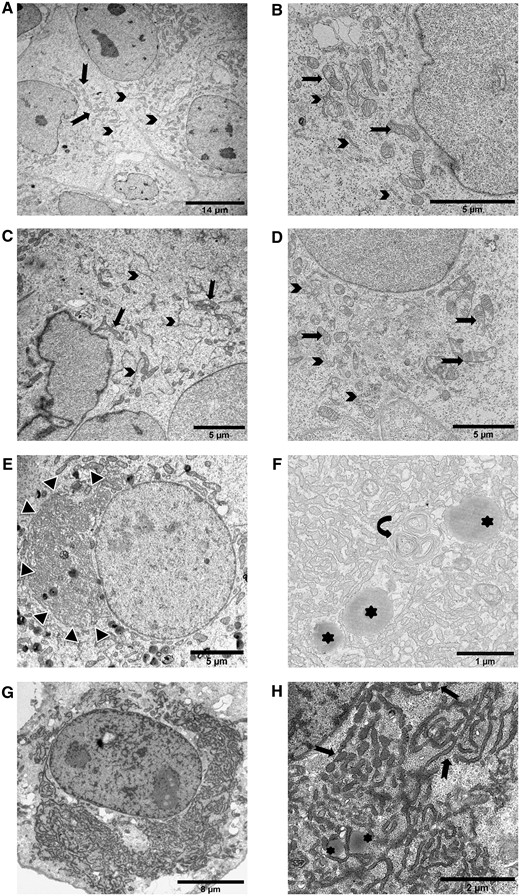
ER morphological alterations induced by NP1 mutants are detected by transmission electron microscopy. For each condition, pictures representative of the characteristic observations are included. ER is indicated by arrows, mitochondria by arrowheads, lysosomes by asterisks. (A and B) Electron microscopy of non-transfected COS7 cells showed normal development of endoplasmic reticulum and mitochondria at low (A) and high magnification (B). (C and D) COS7 cells transfected with the wild-type NP1 plasmid. No modification of cellular organelles was observed at low (C) or high (D) magnification. (E and F) COS7 cells transfected with the p.E327G mutant plasmid showed a single juxtanuclear cluster of ER (E, black and white arrowheads). On high magnification (F), ER cisternae intermingled with some lysosomes and multilamellar bodies (curved arrow). (G and H) COS7 cells transfected with the p.G389R mutant plasmid. The ER cisternae were diffusely distributed in the cytoplasm around the nucleus (G). On high magnification (H), ER cisternae appeared swollen and mingled with some lysosomes, as observed for the p.E327G variant.
Ataxia-linked NPTX1 variants trigger ATF6-dependent ER stress response and induce cytotoxicity
In response to an accumulation of misfolded proteins in the ER lumen, the cell activates the unfolded protein response (UPR), also known as ER stress response.30 Its three branches lead to increased levels of ER chaperones, ultimately promoting protein refolding. We assessed them to evaluate whether ER aggregation triggered by NP1 mutants elicits the ER stress response. Western blot quantification of the chaperone protein BIP/GRP78/HSPA5 did not reveal changes between the wild-type and mutant conditions (Supplementary Fig. 4A). We then tested whether cells alleviated ER stress through global translation limitation to avoid overloading the chaperones capacity. Neither the expression of the translation inhibitor EIF2A nor the levels of its active phosphorylated form were affected by NP1 mutants (Supplementary Fig. 4A). Finally, we looked for the activation of two transcription factors of UPR actors, ATF6 and XBP1. The XBP1 active, shorter form is generated through mRNA splicing. Unspliced (u) and spliced (s) forms of XBP1 mRNA were measured by RT-PCR, with treatment by thapsigargin, a known ER stress inducer, as a positive control (Supplementary Fig. 4B). This did not demonstrate altered activation upon overexpression of NP1 variants compared to the wild-type. The active form of ATF6, on the other hand, is generated by proteolytic cleavage, allowing translocation to the nucleus. Immunofluorescence analyses showed translocation of ATF6 to the nucleus for both NP1 mutants (Fig. 4D and E).
If the proteotoxic stress is prolonged, the cell can switch towards apoptosis; hence, sustained activation of the UPR has been implicated in several neurodegenerative diseases.31 After 48 h of transfection, cell numbers were slightly decreased for both p.E327G and p.G389R constructs, significantly for the latter (Fig. 4F). MTT assay established that this was not due to impaired cell proliferation (Fig. 4G). Conversely, both NP1 mutants increased cytotoxicity, as objectified by elevated levels of lactate dehydrogenase (Fig. 4H).
p.E327G mutation prevents NP1 secretion and impairs multimerization in a dominant-negative fashion
The consequences of NP1 variants on its secretion could not be assessed by classical western blotting, which did not detect NP1 in the supernatant of transfected COS7 cells (Supplementary Fig. 5), presumably because of its very low concentration in the medium. We hence concentrated NP1 protein from the supernatant by immunoprecipitation directed against the V5 tag of the constructs. The p.E327G mutation totally abolished NP1 secretion compared to the wild-type and the p.G389R proteins (Fig. 5A). Conversely, the p.E327G protein level was recurrently increased in transfected cells, reinforcing the hypothesis of impaired secretion and retention of the protein inside the cell.
NP1 is known to form multimers, either with its homologue neuronal pentraxin 2 (NP2), its synaptic receptor neuronal pentraxin receptor (NPTXR), or itself when overexpressed.32,33 Using blue-native PAGE, we identified a complex of approximately 1 MDa, which could either correspond to an icosamer (20 NP1 units) or to a post-translationally modified, e.g. glycosylated, version of a smaller complex (Fig. 5B). The p.E327G mutation specifically prevents the formation of this complex, which cannot be rescued by co-transfection of the wild-type construct. This suggests a dominant-negative effect of the p.E327G NP1 variant on the formation of multimeric complexes with the wild-type protein. To validate these results and better understand NP1 interactions, we performed co-immunoprecipitation experiments coupled with mass spectrometry analysis (Table 2). We did not identify any specific NP1 partner, which supports the hypothesis of a multimeric complex. Yet NP1 binds to several ER chaperones, presumably during its folding process. In agreement with the blue-native gel experiments, the p.G389R variant did not modify NP1 interactions, while the p.E327G mutation induced abnormal contacts with several cytoskeletal proteins (Table 2), possibly suggesting an aggregation process due to a conformational problem.
Mass spectrometry analysis of co-immunoprecipitated proteins using each NP1 variants as bait
| Co-immunoprecipitated proteins | Immunoprecipitated proteins (peptide number of sample/control) | |||
|---|---|---|---|---|
| NP1 WT | NP1 E327G | NP1 G389R | ||
| ER | NP1 | 455 | 363 | 451 |
| HSPA5 (Bip chaperone) | 108 | 54 | 102 | |
| PDIA6 (ER chaperone) | 77 | 30 | 68 | |
| CANX (Ca binding protein) | 28 | 17 | 21 | |
| HSP90B1 (ER chaperone) | 23 | 15 | 23 | |
| PDIA3 (disulphite isomerase) | 10 | 10 | ||
| Nucleus/cytoplasm | EEF1A1(elongation factor) | 34 | 32 | 34 |
| NES (nestin) | 20 | |||
| BAG2 (cytosolic chaperone) | 14 | 14 | ||
| BAG6 (cytosolic chaperone) | 14 | |||
| NIF3L1 (mRNA nuclear export) | 12 | |||
| TCP1 (cytosolic chaperone) | 11 | 11 | ||
| Cytoskeleton | VIM (vimentin) | 612 | ||
| PLEC (plectin) | 370 | |||
| ACTB (actin) | 39 | 187 | 36 | |
| MYH10 | 96 | |||
| MYH18 | 76 | |||
| SPTA1 (spectrin) | 65 | |||
| SPTB (spectrin) | 50 | |||
| KRT7 (sarcolectin) | 41 | |||
| KRT18 | 34 | |||
| GSN (gelsolin) | 19 | |||
| DBN1 | 16 | |||
| MYO1B | 14 | |||
| TMOD3 | 10 | |||
| Mitochondria | HSPD1 | 17 | 20 | |
| ATP5F1A | 17 | 11 | 11 | |
Listed are proteins identified with at least 10 peptides. WT = wild-type.
Protein modelling suggests different pathological mechanisms for both variants
Two models of the homopentamer complex of NP1’s pentraxin domains were obtained by using its monomeric X-ray structure (6YPE) and the pentameric X-ray structures of the homologous proteins CRP (3PVN) or SAP (4AVS; Fig. 5C). The root mean square deviation between the two models is equal to 3.1 Å.
The p.E327 residue has a solvent accessibility of 19% in the monomeric form, which drops to 9% in the pentameric models, locating the residue at the interface between the monomers. The p.E327G substitution is predicted to be destabilizing by PoPMuSiC, with a ΔΔG of 0.8 and 0.9 kcal/mol for the two models, and to be deleterious by SNPMuSiC. As shown in Fig. 5D, p.E327 establishes a salt bridge with p.K385 in the same chain and is close to p.W423 from the interacting chain. A small side chain rearrangement could bring these residues closer so that an interchain cation-π and/or anion-π could form, in addition to the intrachain salt bridge. This hypothesis is supported by the fact that the p.W423–p.E327–p.K385 residues in NP1 align very well with the p.K199–p.E106–p.K116 residues in SAP, which form both an interchain and an intrachain salt bridge. The p.E327G mutation breaks the p.E327–p.K385 intrachain salt bridge and cancels the possibility of an interchain interaction with p.W423. These in silico predictions agree with the hypothesis of a dominant negative effect of the p.E327G mutation and the observed loss of NP1 complex in vivo.
Residue p.G389 is located near the protein surface, not far from the previous variant position, but not at the interface. Its solvent accessibility is around 45% in both pentamer models and in the monomer structure. The p.G389R variant was predicted to be only very slightly destabilizing by PoPMuSiC with a ΔΔG of 0.2–0.3 kcal/mol, and very slightly deleterious by SNPMuSiC; as stated above, the sequence-based deleteriousness predictors oscillate between deleterious and benign. The p.G389 residue is situated in a short helix that protrudes from the structure. Its mutation into an arginine certainly decreases the flexibility of the helix, especially because the arginine can then make a cation-π interaction with the neighbouring residue p.Y392 (Fig. 5E). The mutant arginine is close to another arginine in the interacting chain, p.R429, so that small conformational rearrangements are expected. Note that the equivalent residue to p.G189 in SAP and CRP according to the structure alignment is negatively charged. In summary, the p.G389R mutation is not predicted to change the stability of the pentameric complex, in agreement with the experimental observations, but could alter interaction with other biomolecules from its particular position protruding from the surface.
Note that this analysis did not consider the intrinsically disordered N-terminal region of NP1, which contains about 220 residues according to the Pfam database,34 and possibly influences the effects of the variants as well as the multimerization properties.
Discussion
In six families segregating autosomal dominant cerebellar ataxia, we detected two missense variants in NPTX1. One variant, NM_002522.3:c.1165G>A: p.G389R, identified by whole-genome linkage and exome sequencing, was common to five pedigrees, without a founder effect. Its location in a CpG dinucleotide, more susceptible to variation events, may explain its recurrence. The clinical presentation included a slowly progressive late-onset cerebellar ataxia, with an mean age at onset after 50 years and a cognitive phenotype reminiscent of cerebellar cognitive affective syndrome.28 The second variant, NM_002522:c.A980G: p.E327G, was found in a single patient with a familial history of late cerebellar ataxia. However, the family could not be assessed and the severity of the disease is unknown, which prevents any phenotype–genotype correlation.
NPTX1 encodes a long neuronal pentraxin, NP1, with various and still debated functions. It is synthetized in the ER and secreted,32 preferentially at excitatory synapses,35 where it has been localized at the presynaptic membrane and in the synaptic cleft33 and exerts contrasted regulatory effects. It promotes excitatory synapses formation by stabilizing post-synaptic AMPA receptors subunits GluR1 and GluR4,36,37 leading to ischaemic–hypoxic neuronal death; and negatively regulates their density by interacting with Kv2.7 potassium channel subunit.38 A synthetic synapse organizer including its pentraxin domain induces the formation of excitatory synapses.21 Its homologue protein, NP2, has a synaptogenic function, but is induced by depolarizing conditions,39 while NP1 is induced by lower electric activity and potassium deprivation in cerebellar granule cells. Nptx1-KO mice show no overt neurological phenotype32 but a modest reduction of synaptophysin that might alter synaptic transmission.33 Other described functions of NP1 include a proapoptotic role mediated by Bax translocation at the mitochondria, upon non-depolarizing conditions or hypoxic–ischaemic neuronal injury40,41; a negative regulation of mitochondrial anterograde motility in healthy neurons41; and a reduction of Nodal and BMP signalling by TDGF1 binding upon neural induction.42
NP1 forms multimers with itself, NP2, or neuronal pentraxin receptor (NPTXR), in the brain and in overexpression models.32,33 Its N-terminus includes coiled-coil domains, responsible for the multimerization, while its C-terminus is a pentraxin domain. NP1 is in excess of NP2 in all brain regions, but specifically in the cerebellum, where NP2 is not detected by western blot. The complex, under non-reducing conditions, shows a size of more than 250 kDa, indicative of a pentamer. In overexpression systems, NP1 was also shown to form a larger complex,32 and the broadness of the western blot band suggests possible glycosylation.35 Upon overexpression of WT-NP1 in COS7 cells, blue-native PAGE showed a complex of approximately 1 MDa. It is likely to be an NP1 oligomer because our co-immunoprecitation experiments did not identify any specific NP1 partner. This complex has the size of an icosamer (20 units) and could therefore be a tetramer of pentamers.
Our data suggest that the deleterious effect of both NP1 variants might occur via divergent molecular mechanisms, a loss of function for p.G389R and a dominant negative effect for p.E327G, converging towards a common consequence, ER stress. NP1 secretion and multimerization are indeed disrupted by the p.E327G variant only. The effect on the complex formation could be explained by the differential positioning of affected residues in the monomer structure, as evidenced by the crystal structure of NP1 pentraxin domain,21 p.G389 being at the surface of the complex and p.E327 at the interface between monomers. Thermodynamic prediction of protein stability also suggested the p.E327G variant to be more deleterious for the complex stability. For this variant only, mass spectrometry experiments showed increased interactions with several cytoskeleton proteins including the giant plectin protein, intermediate filaments and actin. This could mechanistically lead to the protein trapping and, in turn, to the abolition of its secretion.
On the other hand, both NP1 mutants have common consequences at the subcellular level. Regardless of the variant, NP1 is still localized at the ER, as confirmed by immunostaining of transfected COS7 cells and by mass spectrometry experiments. Both the p.G389R and the p.E327G mutants induced aggregation and fission of the ER and prompted ER stress, as evidenced by ATF6 nuclear translocation. They slightly decreased cellular viability, seemingly via an increase in cytotoxicity.
While the effects of both variants hence diverge regarding secretion and multimerization, their consequence on ER stress hence eventually converge. Variants causing similar phenotypes via different mechanisms have also been reported in other instances. For example, mutations in CHCHD10 are responsible for autosomal dominant amyotrophic lateral sclerosis, while exerting their effect either via loss of function or toxic gain of function with aggregates.43SPAST mutations are responsible for autosomal dominant spastic paraplegia and either affect the microtubule severing activity of spastin or the endo-lysosomal pathway.44 In ataxia, GRID2 mutations are either responsible for an autosomal recessive ataxia linked to loss-of-function, or a semidominant ataxia with a suspected gain-of-function mechanism.45
Interestingly, despite the major ER rearrangement observed, only the ATF6 branch of the UPR is activated. Under ER stress conditions, the basic leucine zipper (bZIP) ATF6 translocates to the Golgi, where it is processed, releasing a cytosolic fragment that enters the nucleus and directly controls genes from the ER-associated degradation pathway.46 Several studies have suggested that UPR stress sensors may respond differentially to various forms of ER stress.47 Early reports suggested that, under certain conditions, ATF6 may be activated first, before IRE1α and PERK.48,49 A systematic analysis of UPR signalling later demonstrated differential sensitivities of UPR sensors to various inducers of ER stress.47,50 For example, IRE1α and PERK are rapidly activated, before ATF6, upon altered ER calcium homeostasis. IRE1α responds faster to reducing agents than calcium alterations, whereas PERK shows similar kinetics in both conditions. A recent study proposed that ATF6 might also be selectively activated by ER membrane protein load then mediate ER proliferation,51 which is similar to what we observed in our cellular model.
Altogether, these findings suggest that the UPR stress-sensing process is more sophisticated than previously anticipated.
While ion channels, mitochondrial dysfunction, toxic RNA gain-of-function, autophagy and transcription dysregulation are among the major culprits in cerebellar ataxias,3,5 ER dysfunction is only anecdotal so far. Some involvement of ER stress mechanisms, or positive effect of ER stress modulator agents, have been reported in SCA3,52 SCA17,53 Marinesco–Sjögren syndrome54 and mouse models lacking Tmem30a55 and Clcc1.56 SCA2 patients also show ER dysmorphology.57 A more direct involvement of TGM6 mutations overexpression in ER stress and cytotoxicity has been demonstrated in SCA35.10 However, ER dysfunction is prominent in overlapping hereditary neurodegenerative diseases, hereditary spastic paraplegias (HSP).11 In recent years, the border between both entities became increasingly blurry, with HSP genes, such as SPG7, reported to be unexpectedly frequent in patients with a prominent cerebellar phenotype5; and novel genes, such as KIF1C58,59 or GBA2,60,61 simultaneously identified in both diseases. The increasing consensus in the field is to consider both entities as two ends of a spectrum and not as independent diseases; and to instead rely on a mechanistically inspired classification towards the identification of common therapeutic targets.12,13 Interestingly, the patients we report here have very few, if any, pyramidal signs, which suggests that ER dysfunction could also be responsible for cerebellar ataxia in the absence of spasticity.
In conclusion, we report on a newly implicated gene in ADCA, underline the importance of a less-recognized compartment, the ER, in their pathogenesis and describe an intriguing mechanistic situation, where variants with diverge molecular effects lead to intersecting cellular consequences.
Acknowledgements
We are grateful to the patients that participated in this work; to Claire-Sophie Davoine and Victorine Watterlot for technical assistance; to Bruno Eymard for patients’ referral and clinical examination; and to the DNA and cell bank, the Histomics and Microscopy platforms of ICM as well as the IGenSeq sequencing/genotyping facility for their help. We thank the French SPATAX clinical network, for patients’ referral towards the cohort constitution: Mathieu Anheim, Jean-Philippe Azulay, Odile Boesfplug-Tanguy, Cyril Goizet, Didier Hannequin, Vincent Huin, Michel Koenig, Pierre Labauge, Karine N’Guyen, Mathilde Renaud, Diana Rodriguez and Christophe Verny.
Funding
We thank the Association Connaitre les Syndromes Cérébelleux (to G.S.), the European Union Horizon2020 call (Solve-RD project, to G.S.) and the French National Research Agency—ANR (SPATAX-QUEST, to G.S. and D.A.T.) for their financial support. M.C. was the recipient of a fellowship from the Fond National de la Recherche Scientifique (aspirant Fonds National de la Recherche Scientifique). M.J. received a postdoctoral fellowship from the Fondation pour la Recherche Médicale. M.G.P. is funded by the Clinican Scientist School Luebeck (DFG-GEPRIS 413535489). T.B.H. was supported by the Deutsche Forschungsgemeinschaft (DFG, German Research Foundation)—Projektnummer (418081722).
Competing interests
The authors report no competing interests.
Supplementary material
Supplementary material is available at Brain online.
References
Abbreviations
- ADCA
autosomal dominant cerebellar ataxias
- CRP
C-reactive protein
- ER
endoplasmic reticulum
- NP1/2
neuronal pentraxin 1/2 (protein)
- SAP
serum amyloid P component
- UPR
unfolded protein response
Author notes
Marie Coutelier, Maxime Jacoupy contributed equally to this work.

