


Abstract
We investigated whether the impact of tau-pathology on memory performance and on hippocampal/medial temporal memory function in non-demented individuals depends on the presence of amyloid pathology, irrespective of diagnostic clinical stage. We conducted a cross-sectional analysis of the observational, multicentric DZNE-Longitudinal Cognitive Impairment and Dementia Study (DELCODE). Two hundred and thirty-five participants completed task functional MRI and provided CSF (92 cognitively unimpaired, 100 experiencing subjective cognitive decline and 43 with mild cognitive impairment). Presence (A+) and absence (A−) of amyloid pathology was defined by CSF amyloid-β42 (Aβ42) levels. Free recall performance in the Free and Cued Selective Reminding Test, scene recognition memory accuracy and hippocampal/medial temporal functional MRI novelty responses to scene images were related to CSF total-tau and phospho-tau levels separately for A+ and A− individuals. We found that total-tau and phospho-tau levels were negatively associated with memory performance in both tasks and with novelty responses in the hippocampus and amygdala, in interaction with Aβ42 levels. Subgroup analyses showed that these relationships were only present in A+ and remained stable when very high levels of tau (>700 pg/ml) and phospho-tau (>100 pg/ml) were excluded. These relationships were significant with diagnosis, age, education, sex, assessment site and Aβ42 levels as covariates. They also remained significant after propensity score based matching of phospho-tau levels across A+ and A− groups. After classifying this matched sample for phospho-tau pathology (T−/T+), individuals with A+/T+ were significantly more memory-impaired than A−/T+ despite the fact that both groups had the same amount of phospho-tau pathology. ApoE status (presence of the E4 allele), a known genetic risk factor for Alzheimer’s disease, did not mediate the relationship between tau pathology and hippocampal function and memory performance. Thus, our data show that the presence of amyloid pathology is associated with a linear relationship between tau pathology, hippocampal dysfunction and memory impairment, although the actual severity of amyloid pathology is uncorrelated. Our data therefore indicate that the presence of amyloid pathology provides a permissive state for tau-related hippocampal dysfunction and hippocampus-dependent recognition and recall impairment. This raises the possibility that in the predementia stage of Alzheimer’s disease, removing the negative impact of amyloid pathology could improve memory and hippocampal function even if the amount of tau-pathology in CSF is not changed, whereas reducing increased CSF tau-pathology in amyloid-negative individuals may not proportionally improve memory function.
Introduction
The hallmarks of Alzheimer’s disease pathology are extracellular amyloid aggregates and intracellular accumulation of hyperphosphorylated tau.1,2 To what extent the interaction of both pathologies determine brain dysfunction and cognitive impairment is important for clinical research and drug development. Tau accumulation in medial temporal and lateral temporal regions correlates with memory performance3-5 and CSF levels of total-tau correlate with memory performance and hippocampal novelty responses to novel images.6 There is now emerging mechanistic evidence from animal studies that the impact of tau pathology on brain function and cognition can be augmented by concurrent amyloid pathology (for a review see Busche and Hyman7). Behavioural and clinical data from studies in humans support this possibility. Carriers of the ApoE4 allele, a genetic risk factor for Alzheimer’s disease, showed a non-linear relationship between medial temporal tau accumulation and memory performance while there was no relationship in non-carriers.8 More direct assessments of the interaction between amyloid and tau pathology report that the presence of tau and amyloid pathology jointly predict accelerated longitudinal decline in memory.9 Correlations between CSF levels of total-tau and cognitive performance are present in individuals who are positive for amyloid pathology but not in those who are negative.10
While these studies are suggestive of an interaction between amyloid and tau pathology, an important caveat in these studies is that the amyloid-positive groups include considerably more individuals with mild cognitive impairment and very high tau pathology9 (see figure 2b in Timmers et al.10). Hence, it is possible that the reported relationships reflect a sample selection effect where clinical impairment and higher tau values lead to a stronger correlation with memory measures. Another shortcoming of previous studies is that they did not assess brain function in medial temporal lobe structures, hence leaving unclear whether tau pathology causes stronger medial temporal lobe memory dysfunction in individuals who are amyloid-positive as opposed to being amyloid-negative.
Here, we aimed to unravel the interaction of amyloid and tau pathology in causing brain dysfunction and cognitive impairment by overcoming these shortcomings in two ways. First, we followed the recent National Institute on Aging–Alzheimer’s Association research criteria11 and considered a more continuous clinical staging of the predementia continuum of Alzheimer’s disease than including only the preclinical (A+ and cognitively normal, stage 1) and prodromal stages [A+ and mild cognitive impairment (MCI), stage 3]. We enriched our sample with individuals of the transitional stage (stage 2) experiencing subjective cognitive decline (SCD) but performing in the normal range of standard neuropsychological tests.11,12 In this way, we avoided a strong imbalance between amyloid-positive and amyloid-negative individuals in terms of the degree of clinical impairment and levels of tau pathology. Second, we directly assessed medial temporal lobe dysfunction6,13 using task-functional MRI of encoding novel images into memory. This allowed us to test whether the tau-related dysfunction (hypoactivation) of medial temporal lobe regions was dependent on the presence of amyloid pathology. Finally, we also considered the ApoE genetic status to replicate the finding that the presence of an ApoE4 allele is sufficient to drive a relationship between tau pathology and cognition even if the status of amyloid-pathology is not considered.8 To achieve these goals, we used the DZNE-Longitudinal Cognitive Impairment and Dementia Study (DELCODE) cohort of the German Centre for Neurodegenerative Diseases (DZNE),14 which has recruited a large cohort of individuals in stages 1, 2 and 3 and also obtained CSF biomarker levels and multicentric task-functional MRI.6 In the CSF, increasing levels of total-tau and phospho-tau and decreasing levels of amyloid-β42 (Aβ42) provide measures of the magnitude of tau and amyloid pathologies.15–20 Hence, we tested the relationship between CSF levels of total-tau and phospho-tau and brain activity and behavioural performance related to episodic memory in individuals whose Aβ42 levels are normal or pathological and also considered ApoE4 genotype. Behavioural performance was assessed using cognitive performance in the task-functional MRI (delayed recognition memory for novel images) and the free recall performance of the Free and Cued Selective Reminding Test (FCSRT).21
Material and methods
Study design
From the DELCODE study (for details see Jessen et al.14) data from 261 participants could be used for this analysis because these participants completed task functional MRI and also contributed CSF (Table 1). Of the 261 participants, 29 were relatives of participants without diagnosis, 64 classified as healthy controls, 100 as subjective memory complainers (SCDs), 48 as mild cognitively impaired (MCI) and 21 as Alzheimer-type dementia. The patients with dementia of Alzheimer's type were not considered for this study. Two subjects had missing dprime values and were not included in the behavioural analyses, but still contributed to the functional MRI models. We note that this sample partially overlaps with a previous smaller study that only included 76 participants6 and did not investigate the interaction between tau-pathology, amyloid-status and ApoE4 genotype.
Sample characteristics
| Group | Amyloid− | Amyloid+ | Amyloid− | Amyloid+ | P | |
|---|---|---|---|---|---|---|
| n | n | Mean (SD) | Mean (SD) | |||
| Age | HC | 66 | 26 | 68.12 (4.77) | 67.31 (5.62) | |
| SCD | 67 | 33 | 69.38 (5.25) | 71.24 (5.28) | 0.151/0.008 | |
| MCI | 17 | 26 | 70.44 (4.93) | 73.76 (4.57) | 0.441/0.085 | |
| ApoE4 carrier status | HC | 66 | 26 | 13.84% | 52% | |
| SCD | 67 | 33 | 17.46% | 46.66% | ||
| MCI | 17 | 26 | 23% | 60% | ||
| Years of education | HC | 66 | 26 | 14.42 (2.60) | 14.38 (2.85) | |
| SCD | 67 | 33 | 15.22 (2.89) | 15.12 (2.94) | 0.116/0.338 | |
| MCI | 17 | 26 | 13.44 (2.06) | 13.79 (3.09) | 0.035/0.158 | |
| Total-tau | HC | 66 | 26 | 376.83 (125.06) | 414.36 (115.69) | |
| SCD | 67 | 33 | 334.87 (146.40) | 429.26 (178.17) | 0.070/0.005 | |
| MCI | 17 | 26 | 426.17 (206.16) | 658.21 (266.82) | 0.069/0.016 | |
| Phospho-tau | HC | 66 | 26 | 52.16 (15.53) | 51.82 (20.46) | |
| SCD | 67 | 33 | 52.75 (21.22) | 77.62 (27.89) | 0.881/0.001 | |
| MCI | 17 | 26 | 51.25 (16.60) | 84.86 (26.77) | 0.738/0.050 | |
| Aβ42/40 | HC | 66 | 26 | 0.105 (0.016) | 0.063 (0.014) | |
| SCD | 67 | 33 | 0.110 (0.015) | 0.059 (0.009) | 0.100/0.226 | |
| MCI | 17 | 26 | 0.105 (0.018) | 0.051 (0.012) | 0.394/0.170 | |
| Aβ42 | HC | 66 | 26 | 988.3 (229.6) | 478.4 (130.9) | |
| SCD | 67 | 33 | 1013.9 (285.6) | 492.1 (95.4) | 0.571/0.643 | |
| MCI | 17 | 26 | 970.2 (258.9) | 454.2 (119.3) | 0.559/0.170 | |
| MMSE | HC | 66 | 26 | 29.41 (0.84) | 29.12 (1.03) | |
| SCD | 67 | 33 | 29.05 (1.19) | 29.24 (1.19) | 0.032/0.656 | |
| MCI | 17 | 26 | 28.28 (1.63) | 27.72 (1.50) | 0.067/0.000 | |
| ADAS delayed recall | HC | 66 | 26 | 7.58 (1.59) | 8.12 (2.19) | |
| SCD | 67 | 33 | 7.45 (1.56) | 6.91 (1.99) | 0.147/0.031 | |
| MCI | 17 | 26 | 4.39 (2.09) | 3.97 (2.75) | 0.000/0.000 | |
| dprime | HC | 66 | 26 | 1.16 (0.40) | 1.19 (0.44) | |
| SCD | 67 | 33 | 1.29 (0.53) | 1.18 (0.49) | 0.150/0.983 | |
| MCI | 17 | 26 | 0.70 (0.35) | 0.58 (0.47) | 0.000/0.000 | |
| FCSRT Free recall | HC | 66 | 26 | 31.73 (5.34) | 31.38 (8.79) | |
| SCD | 67 | 33 | 29.56 (6.53) | 27.21 (7.63) | 0.039/0.056 | |
| MCI | 17 | 26 | 23.44 (8.92) | 18.38 (8.55) | 0.003/0.000 |
Characteristics of participants who completed task-FMRI. P-values denote results of independent-samples t-test comparison with the group in the line above. P-values before the/sign denote results for the amyloid-negative groups and after the/for the amyloid-positive group. ADAS = Alzheimer's Disease Assessment Scale; HC = healthy control; MMSE = Mini-Mental State Examination.
The DELCODE study is an observational longitudinal memory clinic-based multicentre (10 sites) study of the DZNE in Germany. The participants that have been enrolled include 455 subjects with SCD, 190 MCI patients, 82 Alzheimer’s dementia patients, 236 healthy controls without subjective or objective cognitive decline and 100 first-degree relatives of patients with a documented diagnosis of Alzheimer’s dementia. All patient groups (SCD, MCI, Alzheimer’s dementia) are referrals, including self-referrals, while the control group and the relatives of Alzheimer’s dementia patients are recruited by standardized public advertisement.
All local institutional review boards and ethical committees approved the study protocol. All participants gave written informed consent before inclusion in the study. DELCODE is retrospectively registered at the German Clinical Trials Register (DRKS00007966) (04/May/2015). Data handling and quality control have been previously reported.14
Participants
SCD and MCI patients were all recruited through memory clinic referrals and therefore included only individuals who sought medical advice for their memory complaints. SCD was defined by the presence of subjectively reported decline in cognitive functioning and a test performance above −1.5 SD below the age-, sex- and education-adjusted normal performance on all subtests of the CERAD, according to SCD research criteria.12 A semistructured interview regarding the details of memory complaints was performed according to the SCD-plus criteria.12 Participants with amnestic MCI were defined by an age-, sex- and education-adjusted performance below −1.5 SD on the delayed recall trial of the CERAD word-list episodic memory tests, and were enrolled based on the memory clinic diagnoses, which were guided by the current research criteria for MCI (National Institute on Aging–Alzheimer’s Association).22,23 Additional inclusion criteria for both groups were age ≥ 60 years, fluent German language skills, capacity to provide informed consent and presence of a study partner. The healthy control group was recruited by newspaper advertisements, seeking individuals feeling healthy and without relevant cognitive problems. All individuals who responded to the advertisement were screened by telephone with regard to SCD. The report of very subtle cognitive decline, which did not cause any concerns and was considered normal for age by the individual, was not an exclusion criterion. Healthy controls had to achieve unimpaired cognitive performance according to the same definition as the SCD group. For exclusion criteria see Jessen et al.14
CSF Alzheimer’s disease biomarker assessment
CSF Alzheimer’s disease biomarkers were determined centrally at the Bonn site using commercially available kits according to vendor specifications [V-PLEX Aβ Peptide Panel 1 (6E10) Kit, K15200E and V-PLEX Human Total-tau Kit, K151LAE (Mesoscale Diagnostics LLC) and Innotest Phospho-Tau(181P), 81581, Fujirebio; also see Jessen et al.14]. Cut-offs were calculated from the DELCODE dataset by Gaussian mixture modelling using the R package flexmix (version 2.3–15).11 The following cut-offs were determined: Aβ42 ≤ 638.7 pg/ml, Aβ42/Aβ40 ≤ 0.08 pg/ml, total-tau > 510.9 pg/ml, phospho-tau ≥ 73.65 pg/ml and Aβ42/phospho-tau < 9.68 pg/ml.
To determine amyloid pathology, we used Aβ42 levels. It has been suggested that a decrease of Aβ42 levels may indicate the earliest onset of amyloid pathology24 (also see Reimand et al.25). Also, a recent report showed that Aβ40 levels tend to increase together with increasing p-tau pathology,26 raising the possibility that Aβ42/40 levels would show stronger collinearity with CSF-tau measures than Aβ42 alone. Aβ42 levels have previously been used to determine amyloid positivity in SCD.27
MRI acquisition
MRI data were acquired at nine scanning sites, all equipped with Siemens scanners (three TIM Trio systems, four Verio systems, one Skyra and one Prisma system). For the current report, T1- [3D GRAPPA PAT 2, 1 mm3 isotropic, 256 × 256 px, 192 slices, sagittal, ∼5min, repeptition time (TR) 2500 ms, echo time (TE) 4.33 ms, inversion time (TI) 110 ms, flip angle (FA) 7°] and T2-weighted (optimized for medial temporal lobe volumetry, 0.5 × 0.5 × 1.5 mm3, 384 × 384 px, 64 slices, orthogonal to the hippocampal long axis, ∼12 min, TR 3500 ms, TE 353 ms) images and a task-functional MRI protocol [2D echo planar imaging (EPI), GRAPPA PAT 2, 3.5 mm3 isotropic, 64 × 64 px, 47 slices, oblique axial/AC-PC aligned, ∼9 min, TR 2580 ms, TE 30 ms, FA 80°, 206 volumes] were used.
For task functional MRI, all sites used the same 30′′ MR-compatible LCD screen (Medres Optostim) matched for distance, luminance, colour and contrast constant across sites, and the same response buttons (CurrentDesign). All participants underwent vision correction with MR-compatible goggles (MediGlasses, Cambridge Research Systems) according to the same standard operating procedures (SOP). SOPs, quality assurance and assessment (QA) were provided and supervised by the DZNE imaging network (iNET, Magdeburg) as described in Jessen et al.14
Task functional MRI
During the functional MRI session, subjects performed a modified version of a previously published scene novelty and encoding task (‘FADE’).28 Here, 44 novel indoor scenes, 44 novel outdoor scenes and 44 repetitions of the pre-familiarized images (one indoor and one outdoor, 22 times each; all 8-bit greyscale, scaled to 1250 × 750 pixel resolution and matched for luminance; viewing horizontal half-angle was 10.05°) were presented (‘Presentation’ software by Neurobehavioral Systems Inc.) and subjects had to classify them as either ‘indoor’ or ‘outdoor’ by button press. Stimuli were shown for 2500 ms each, with an optimized jitter for statistical efficiency.29 Two hundred and six functional volumes were recorded with a TR of 2.58 s. The whole task took around 11 min. Following a delay of 70 min, recognition memory for the novel 88 images and the two pre-familarized images was tested together with 44 entirely new images (22 indoor, 22 outdoor) outside of the MRI scanner (viewing horizontal half-angle was 10.05°). Recognition memory responses were given on a 5-step scale (1: ‘I am sure that this picture is new’; 2: ‘I think that this picture is new’; 3: ‘I cannot decide if this picture is new or old’; 4: ‘I think I saw this picture before’; 5: ‘I am sure that I did see this image before’). Recognition memory accuracy was quantified as dprime values using confidence scale scores 1 and 2 as ‘new‘ responses, and 3, 4 and 5 as ‘old’ responses. For the purpose of this analysis, we did not consider the confidence scales further.
MRI analyses
Single subject analyses
After preprocessing (slice time correction, unwarping, realignment and spatial smoothing (isotropic Gaussian kernel of FWHM 6 × 6 × 6 mm), Statistical Parametric Mapping (SPM), Version 12; Wellcome Trust Centre for Neuroimaging, London, UK), first-level general linear models were calculated in native space (including six motion regressors from the realignment process) using a haemodynamic response function with a 128-s high-pass filter, no global scaling and no serial correlations modelled. Pre-familiarized and novel stimuli were used to calculate a ‘novelty’ contrast (‘novel versus old’).
Group-level analyses
A study-specific group template was calculated using the radio frequency-bias corrected (N4-ITK30) magnetization prepared rapid gradient echo (MPRAGE) images using Advanced Normalization Tools (ANTs) v2.1.31 Four rigid-then-affine iterations were followed by six full runs of a non-linear multiresolution routine to ensure stable convergence (three resolutions, maximum of 90 iterations, template update step size of 0.1 mm). The individual SPM contrast images for the first-level ‘novelty’ contrast were warped to the study-specific group template. Co-registration parameters (mean EPI to MPRAGE) and spatial normalization parameters resulting from the template creation were applied to individual contrast images using ANTs. The normalized contrast images were entered into planned multiple regression analyses as outlined below.
Statistical analyses
Regression analyses with the functional MRI novelty contrast [blood oxygenation level-dependent (BOLD) activity difference between novel and repeated scenes] were performed using SPM12 (Wellcome Trust Centre for Neuroimaging, London, UK). Given the known anatomical predilection of predementia tau-pathology to medial temporal lobe structures and the role of these structures in processing novel information, we focused our analyses on this region using a bilateral binary mask of hippocampus, amygdala, parahippocampal cortex and entorhinal cortex, transentorhinal cortex and the perirhinal cortex with the collateral sulcus. For voxel-level analysis of novelty-related brain activations in these regions we applied cluster inference using an initial cluster-forming threshold of P = 0.001 and correction of multiple comparison using cluster familywise error (FWE; P < 0.05). This region-of-interest mask was generated by segmenting the ANTs template for the DELCODE cohort via FreeSurfer v6.0 (https://surfer.nmr.mgh.harvard.edu/) and FSL-FIRST32 and combining the regions of interest for the four regions and for both sides to obtain a common mask. This was smoothed by 2 mm and cut-off at a value of 0.05 to enlarge the mask to allow for some bleeding out of the activated clusters.
Behavioural data
Behavioural data were analysed using SPSS 26 (IBM, Armonk, USA). Univariate ANCOVAs with dprime or FCSRT free recall as the dependent variable, total-tau or phospho-tau as an index of tau-pathology and Aβ42 positivity (binary variable; amyloid-positive Aβ42 < 638.7 and amyloid-negative Aβ42 ≥ 638.7) as factors and age, gender, diagnosis (healthy control, SCD, MCI), years of education and DZNE site as covariates were conducted to assess whether the relationship between tau-pathology memory performance interacted with amyloid-positivity. In case of an interaction between tau pathology and amyloid status, follow-up correlations were conducted. FCSRT free recall and dprime for healthy control, SCD and MCI were correlated with CSF total-tau and phospho-tau levels in the whole sample and separately for amyloid-negative and -positive individuals as well as carriers and non-carriers of the ApoE4 allele. Partial correlations (two-tailed) were used including age, sex, education, DZNE site, diagnosis and Aβ42 levels as covariates. Significant correlations were followed up by excluding very high values of total-tau (>700 pg/ml) and phospho-tau (>100 pg/ml).
Finally, we created amyloid-positive and amyloid-negative groups with comparable levels of tau pathology. In addition to replicating the ANCOVA analyses with memory performance as dependent variables in this matched sample, we also performed a classification based on amyloid and tau-pathology (A−/T−, A−/T+, A+/T−, A+/T+) to assess whether our outcome measures would show significant impairment in A+/T+ despite matching for phospho-tau levels in A−/T+. These analyses were based only on phospho-tau because the ATN classification (amyloid, tau, neurodegeneration) has been proposed for phospho-tau as a marker of tau-pathology.11 For this purpose, we conducted a propensity score-based matching procedure (in SPSS 27, FUZZY procedure for propensity-score matching, with an error of 0.1) of CSF levels for phospho-tau across amyloid-positive and -negative groups.
Functional MRI interaction analysis
Functional MRI interaction analyses were planned if the behavioural analyses indicated a correlation between tau-pathology and cognition in amyloid-positive but not amyloid-negative individuals or ApoE4 carriers but not non-carriers.
To test our a priori hypothesis of a different correlation of novelty activation with tau levels in either Aβ-positive (A+, defined by Aβ42) or Aβ-negative (A−) participants, we set up a model that incorporates amyloid status as a group factor in one model. The model also included MRI site, age, gender, years of education, left and right hippocampal volumes as covariates. Significant interactions were followed-up by including diagnosis (healthy control, SCD, MCI) as a covariate.
To distinguish between groups, a group-assignment variable was created, that was +1 for A+ and −1 for A−. Moreover, we then included the amyloid × tau-pathology interaction term by multiplying the amyloid group variable with the continuous tau regressor (either total-tau or phospho-tau). According to our hypothesis we further tested for a negative amyloid × tau interaction indicating a higher negative correlation of the tau biomarker with novelty in the groups of A+ relative to A− subjects. This was then complemented with a small volume correction of the results using the medial temporal lobe mask. Congruent analyses were planned for ApoE4 status if motivated by the behavioural results.
Multiple regressions
Significant interactions between the relationship of tau pathology with novelty and amyloid pathology were followed up by subgroup analyses in which the whole sample was subdivided into amyloid-positive and -negative according to the CSF cut-off values (Table 1). The relationship between tau pathology and novelty was then assessed separately in each group.
To assess the specific effects of CSF total-tau and phospho-tau on novelty responses within the mask and their dependency on CSF Aβ42-levels, two models were set up: (i) CSF total-tau as a regressor using the MRI site, age, years of education, gender, left and right hippocampal volumes and Aβ42 levels as covariates; and (ii) CSF phospho-tau as a regressor using the MRI site, age, years of education, gender, left and right hippocampal volumes and Aβ42 levels as covariates.
Models with significant effects were followed-up with diagnosis (healthy control, SCD, MCI) as an additional covariate to assess whether any relationship would remain signification independent of diagnosis. Furthermore, the analyses were followed-up after filtering for extreme tau levels by excluding participants with high levels of total-tau (>700 pg/ml) and phospho-tau (>100 pg/ml). This follow-up ensured that any relationship between tau and novelty response in the amyloid-positive group was not driven by individuals with very high pathology. As a further assessment of this possibility, we used the propensity score-based matching of CSF levels for phospho-tau across amyloid-positive and -negative groups to assess the interaction between amyloid (binary classification) and tau pathology (continuous) using functional MRI novelty responses extracted from hippocampus, entorhinal cortex, transentorhinal cortex, parahippocampal cortex and perirhinal cortex bilaterally as dependent variables in an ANCOVA with MRI site, age, years of education, gender and diagnosis as covariates. Finally, we also used the classification based on amyloid and tau pathology (A−/T−, A−/T+, A+/T−, A+/T+) outlined above to assess whether the functional MRI novelty responses in these regions of interest would show a significant decrease in A+/T+ despite matching for phospho-tau levels in A−/T+.
Data availability
Data, study protocol and biomaterials can be shared with partners based on individual data and biomaterial transfer agreements.
Results
Participants and demographics
Table 1 summarizes the sample characteristics including levels for total-tau, phospho-tau, Aβ42, ApoE4 carrier frequency (at least on E4 allele), FCSRT free recall and dprime for healthy control, SCD and MCI separately for amyloid-negative and -positive individuals. Independent samples t-test comparisons between healthy control and SCD as well as SCD and MCI are given in Table 1 separately for amyloid-negative and -positive individuals.
Behavioural results from the task-functional MRI paradigm and FCSRT
Four participants had negative dprime values and these data were excluded because of a potentially wrong use of the response buttons during the functional MRI in those cases. A univariate ANCOVA model with the 235 participants, with dprime as the dependent variable, total-tau and Aβ42 positivity (binary variable; amyloid-positive Aβ42 < 638.7 and amyloid-negative Aβ42 ≥ 638.7) as factors and age, gender, years of education and DZNE site as covariates showed a significant interaction between total-tau and Aβ42 positivity (F = 9.78; P = 0.000; effect of age F = 3.59, P = 0.059; years of education F = 12.05, P = 0.000; sex F = 1.71, P = 0.191). The same analysis for phospho-tau also showed an interaction between phospho-tau and Aβ42 positivity (F = 7.03; P = 0.001; effect of age F = 4.47, P = 0.035; years of education F = 11.89, P = 0.001; sex F = 1.78, P = 0.183). The same ANCOVAs with diagnosis (healthy control, SCD, MCI) as an additional covariate remained significant for the interaction between amyloid-positivity and total-tau (F = 3.8; P = 0.023; effect of diagnosis F = 13.3, P = 0.000) and phospho-tau (F = 3.46; P = 0.033; effect of diagnosis F = 15.5, P = 0.000).
These analyses were repeated for the free recall performance in the FCSRT. We again found an interaction between total-tau and Aβ42 positivity (F = 19.17; P = 0.000; effect of age F = 19.23, P = 0.000; years of education F = 5.85, P = 0.016; sex F = 4.52, P = 0.034) and an interaction between phospho-tau and Aβ42 positivity (F = 18.40; P = 0.000; effect of age F = 20.05, P = 0.000; years of education F = 5.19, P = 0.024; sex F = 4.84, P = 0.029). The same ANCOVAs with diagnosis (healthy control, SCD, MCI) as an additional covariate remained significant for the interaction between amyloid-positivity and total-tau (F = 8.75; P = 0.000; effect of diagnosis F = 20.3, P = 0.000) and phospho-tau (F = 8.25; P = 0.000; effect of diagnosis F = 21.5, P = 0.000).
These findings suggested that the relationship between tau-pathology and memory performance, as assessed with delayed recognition memory and hippocampus-dependent free recall, interacted with amyloid-positivity and that these interactions were not solely attributable to clinical diagnosis/stage.
Given these interactions of the relationship between tau-pathology and behavioural memory measures with amyloid-positivity, we subdivided the 235 participants into amyloid-positive (Aβ42 < 638.7) and amyloid-negative (Aβ42 ≥ 638.7; Fig. 1) for follow-up analyses. In amyloid-negative individuals, partial correlations with age, gender, years of education and DZNE site as covariate showed no correlation between dprime and CSF total-tau (R = −0.072; P = 0.388), phospho-tau (R = −0.016; P = 0.845). In amyloid-positive individuals these correlations were significant for total-tau (R = −0.430; P = 0.000) and phospho-tau (R = −0.393; P = 0.000). After including Aβ42 levels as an additional covariate, the correlations remained significant for total-tau (R = −0.393; P = 0.000) and phospho-tau (R = −0.357; P = 0.001). After including diagnosis as an additional covariate, the correlations in the amyloid-positive group also remained significant for total-tau (R = −0.320; P = 0.004) and phospho-tau (R = −0.398; P = 0.007). When excluding very high levels of tau-pathology, the correlation remained significant for phospho-tau (levels >100 pg/ml excluded; age, gender, years of education, site and diagnosis as covariates; R = −0.159; P = 0.019) and trend-level for total-tau (levels >700 pg/ml excluded; age, gender, years of education, site and diagnosis as covariates; R = −0.119; P = 0.096).
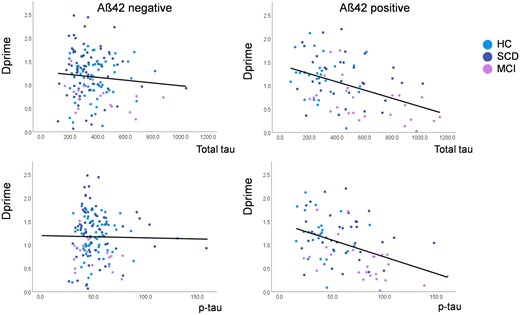
Correlation between CSF levels of total (toprow) and phospho (bottom row) tau (pg/ml) and recognition memory accuracy (dprime) for the novel scenes presented during task-functional MRI. Colour codes indicate healthy controls (blue), subjective complainers (SCD, red) and individuals with MCI (green). The left column shows correlations in Aβ42-negative and the right column in Aβ42-positive individuals.
The same pattern was found for the relationship between FCSRT free recall and CSF levels of total-tau and phospho-tau (Fig. 2). Partial correlations with age, gender, years of education and DZNE site as covariate showed a trend-level correlation of free recall with CSF total-tau (R = −0.142; P = 0.090) and no correlation with phospho-tau (R = −0.096; P = 0.250) in amyloid-negative individuals. In amyloid-positive individuals these correlations were significant for total-tau (R = −0.394; P = 0.000) and phospho-tau (R = −0.395; P = 0.000). After including Aβ42 levels as an additional covariate, the correlations remained significant for total-tau (R = −0.350; P = 0.001) and phospho-tau (R = −0.355; P = 0.001). After including diagnosis as an additional covariate, the correlations in the amyloid-positive group also remained significant for total-tau (R = −0.260; P = 0.020) and phospho-tau (R = −0.263; P = 0.018). When excluding very high levels of tau-pathology, the correlation remained significant for phospho-tau (levels >100 pg/ml excluded; age, gender, years of education, site and diagnosis as covariates; R = −0.210; P = 0.002) and for total-tau (levels >700 pg/ml excluded; age, gender, years of education, site and diagnosis as covariates; R = −0.137; P = 0.048).

Correlation between CSF levels of total (top row) and phospho (bottom row) tau (pg/ml) and free recall performance in the FCSRT free recall test. Colour codes indicate healthy controls (blue), subjective complainers (SCD, red) and individuals with MCI (green). The left column shows correlations in Aβ42-negative and the right column in Aβ42-positive individuals.
A comparison of the magnitude of correlations (Fisher’s z-test, one-tailed) showed that the correlation between CSF total-tau levels and dprime was stronger in the Aβ42-positive group than the -negative (P = 0.0003) and the same was true for phospho-tau (P = 0.0002). This also held for the group comparison of correlations between CSF levels and FCSRT free recall (both P < 0.0001). ApoE4 carrier status (Table 1) did not have any modifying effect on biomarker correlations between dprime or FCSRT free recall and CSF total and phospho-tau levels when added as an additional covariate.
This was confirmed by an analysis analogous to8 where these correlations (again with age, sex, years of education, DZNE site and diagnosis as covariates) were performed separately in carriers and non-carriers of the ApoE4 allele. For dprime, ApoE4 non-carriers showed a significant correlation with total-tau (R = −0.173; P = 0.033) and a trend-level association for phospho-tau (R = −0.145; P = 0.075). For ApoE4 carriers, a correlation of dprime was trending with total-tau (R = −0.217; P = 0.096) but not significant with phospho-tau (R = −0.144; P = 0.273). Similarly, for FCSRT free recall, ApoE4 non-carriers showed a significant correlation with total-tau (R = −0.267; P = 0.001) and phospho-tau (R = −0.198; P = 0.014). For ApoE4 carriers, the correlation with total-tau was not significant (R = −0.156; P = 0.233) and for phospho-tau it also was not significant (R = −0.197; P = 0.131). Hence, unlike amyloid-positivity, the presence of an ApoE4 allele was not associated with a stronger relationship between tau-pathology and memory performance; rather, the data numerically pointed in the opposite direction.
Propensity score-based matching for phospho-tau pathology
Propensity score-based matching resulted in amyloid-positive and -negative groups (n = 84 each) with equal means of phospho-tau [in amyloid-positive 58.7 μg/ml (SD 21.7); in amyloid-negative 55.3 μg/ml (SD 29.2); t-test for independent samples P = 0.445], but variances remained different (Levene test for equal variances F = 13.1, P = 0.000). An ANCOVA with dprime as the dependent variable, with age, sex, MRI site, years of education and diagnosis as covariates showed a significant interaction between amyloid-positivity (binary on the basis of Aβ42 levels) and phospho-tau levels (F = 4.48, P = 0.013), and the same analysis for FCSRT free recall as dependent variable also showed a significant interaction between amyloid-positivity and phospho-tau levels (F = 4.73, P = 0.010). Partial correlations in the amyloid-positive group with age, sex, MRI site, years of education and diagnosis as covariates showed a significant correlation between phospho-tau levels and dprime (R = −0.312, P = 0.005) and FCSRT free recall (R = −0.241, P = 0.034), but not in the amyloid-negative group (dprime R = −0.096, P = 0.405 and FCSRT free recall R = 0.120, P = 0.294).
We then grouped the sample according to the AT scheme [normal (T−) and pathological (T+) phospho-tau values at cut-off 73.65 pg/ml]. In T+, the phospho-tau levels in A− were 97.89 pg/ml (SD 25.06) and in A+ they were 95.36 pg/ml (SD 19.42). In T−, phospho-tau levels in A− were 48.24 pg/ml (SD 9.80) and in A− they were 43.58 pg/ml (SD 16.60; Fig. 4A; sample sizes of matched groups: A−/T− = 72; A−/T+ = 12; A+/T− = 60; A+/T+ = 24). An ANCOVA with dprime (Fig. 4B) as the dependent variable, with age, sex, MRI site, years of education and diagnosis as covariates showed a significant interaction between amyloid-positivity (A+ versus A−) and phospho-tau positivity (T+ versus T−; F = 3.22, P = 0.025) and a trend for an interaction for FCSRT free recall (Fig. 4C) as dependent variable (F = 2.29, P = 0.081). A post hoc independent-samples t-test showed that dprime was significantly lower in A+/T+ than A−/T+ (t = 3.67; P = 0.01) and the same was true for FCSRT free recall (t = 2.495; P = 0.018).
Taken together, these data show that while amyloid positivity significantly modified the relationship between memory performance and CSF tau pathology, such a modification was not present for ApoE4 status, thus failing to replicate a previous tau-PET-based report.8
Functional MRI results
Group-level novelty–effect interaction
Given that carriers of the ApoE4 allele and non-carriers did not differ with respect to the correlation between CSF total-tau and phospho-tau levels and memory performance, we did not conduct any interaction analyses with the functional MRI data.
In the full sample including all diagnostic groups irrespective of amyloid status, novelty was associated with the activation of a widespread network including medial temporal regions, visual areas, parietal and posterior midline regions, basal ganglia and frontal cortex (Fig. 3A) replicating previous reports.6 In the interaction analysis with CSF total-tau levels and amyloid status (binary variable; amyloid-positive Aβ42 < 638.7 and amyloid-negative Aβ42 ≥ 638.7) on novelty activation (covariates age, sex, MRI site, years of education, left and right hippocampal volume), there was one significant cluster in the right hippocampus at the hippocampal head–body border that survived FWE correction (with small volume correction) with the medial temporal lobe mask [P = 0.027 (FWE), size 504 voxels] (Fig. 3B) indicating that amyloid-status significantly changed the correlation between CSF total-tau levels and novelty activation in this region. This finding remained stable after including diagnosis (healthy control, SCD, MCI) as a covariate, albeit with a slightly reduced cluster size [P = 0.043 (FWE), size 389 voxels]. In the interaction analysis with CSF phospho-tau levels and amyloid-status on novelty activation, there was a small cluster in the same region of the right hippocampus at the hippocampal head-body border (Fig. 3C) but did not survive FWE (with SVC) correction with the medial temporal lobe mask [P = 0.301 (FWE), size 38 voxels]. Including diagnosis as a covariate in this analysis did not change the results.
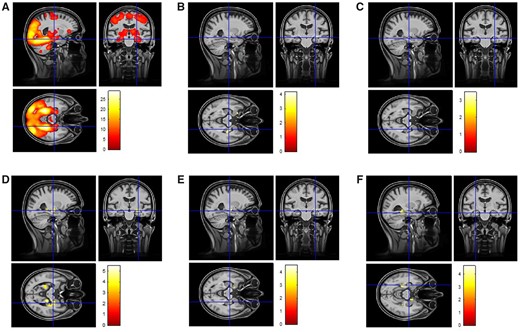
Functional MRI results. (A) The whole-brain novelty response in the full sample (healthy controls, SCD, MCI) without any covariates. (B) Results of an interaction analysis with CSF total-tau levels and amyloid status (binary variable; amyloid-positive Aβ42 < 638.7 and amyloid-negative Aβ42 ≥ 638.7) on novelty activation (covariates age, sex, MRI site, years of education, left and right hippocampal volume). Including diagnosis as an additional covariate did not change the results substantially. (C) Results of an interaction analysis with CSF phospho-tau levels and amyloid status on novelty activation. Including diagnosis as a covariate in this analysis did not change the results substantially. (D) A group-specific regression analysis in amyloid-positive individuals showing the correlation between CSF total-tau levels and medial temporal novelty responses (covariates age, sex, MRI site, years of education, left and right hippocampal volume and Aβ42 CSF levels). This finding remained stable with a slightly lower significance and cluster sizes when including diagnosis as a covariate. (E) A group-specific regression analysis in amyloid-positive individuals showing the correlation between CSF phospho-tau levels (covariates age, sex, MRI site, years of education, left and right hippocampal volume and Aβ42 CSF levels). This finding remained stable with a slightly lower significance and cluster size when including diagnosis as a covariate. (F) A group-specific regression analysis in amyloid-positive individuals (covariates age, sex, years of education, MRI site, diagnosis, Aβ42 CSF levels) showing the correlation between dprime and novelty responses.
A follow-up, group-specific regression analysis showed a significant correlation between CSF total-tau levels and medial temporal novelty responses in amyloid-positive individuals (Fig. 3D; covariates age, sex, MRI site, years of education, left and right hippocampal volume and Aβ42 CSF levels). This correlation was found in the same cluster as in the interaction analysis [P < 0.000 (FWE), 1552 voxels] and additionally in the body–tail region of the right hippocampus [P = 0.0012 (FWE), 623 voxels] and left hippocampal tail and left parahippocampal gyrus [P = 0.003 (FWE), 975 voxels]. This finding remained stable with a slightly lower significance and cluster size when including diagnosis as a covariate—right hippocampal head: P < 0.011 (FWE), 635 voxels; and also in the body–tail region of the right hippocampus: P = 0.035 (FWE), 395 voxels and left hippocampal tail and left parahippocampal gyrus: P = 0.054 (FWE), 311 voxels. The same analyses for CSF phospho-tau replicated these findings from the interaction analysis and the regression analysis for CSF total-tau for the cluster in the right hippocampus at the hippocampal head–body border [P = 0.005 (FWE), 832 voxels; Fig. 3E]. This finding remained stable with a slightly lower significance and cluster size when including diagnosis as a covariate [P < 0.037 (FWE), 382 voxels]. There were no significant correlations between CSF total-tau and phospho-tau levels and novelty responses in the amyloid-negative group.
In order to rule out the possibility that the observed correlations in the amyloid positive group were driven by higher CSF total-tau or phospho-tau values, we replicated the above regression analyses after restricting these values to CSF total-tau <700 pg/ml (n = 74) and CSF phospho-tau < 100 pg/ml (n = 83). These thresholds were chosen because 97% of the amyloid-negative group had lower values. For CSF total-tau, the correlation with novelty in the left hippocampal tail remained significant [P = 0.002 (FWE), 1059 voxels] and for CSF phospho-tau the correlation with novelty in the right hippocampus at the hippocampal head–body border remained significant [P = 0.003 (FWE), 980 voxels].
Propensity score-based matching for phospho-tau pathology
We further assessed whether different means of tau-pathology across amyloid-positive and -negative individuals could have driven the interaction with amyloid pathology. To that end, we analysed the relationship between novelty responses and pathology within the propensity score-matched sample described above for the memory performance analysis. An ANCOVA with the magnitude of bilateral medial temporal and hippocampal novelty (extracted individually as the mean BOLD novelty response from the hippocampus, entorhinal cortex, transentorhinal cortex, parahippocampal cortex and perirhinal cortex bilaterally) responses as the dependent variable, with age, sex, MRI site, years of education and diagnosis as covariates showed a significant interaction between amyloid-positivity (binary, A+ versus A−) and phospho-tau levels (F = 5.13, P = 0.007). We then assessed the interaction in the AT scheme groups. An ANCOVA with novelty as the dependent variable, with age, sex, MRI site, years of education and diagnosis as covariates showed a significant interaction between amyloid-positivity (A+ versus A−) and phospho-tau positivity (T+ versus T−; F = 3.23, P = 0.024). However, a post hoc independent-samples t-test showed that novelty was not significantly lower in A+/T+ than A−/T+ (t = 1.55; P = 0.128). Thus, despite matched tau pathology, medial temporal/hippocampal novelty responses were correlated with tau pathology only in A+ but not in A−, while at a group-level, the numerical reduction of novelty in A+/T+ compared to A−/T+ (0.87 versus 2.3) was not significant.
CSF Aβ42 levels as a regressor
There were no significant correlations between CSF Aβ42 levels and novelty activation in the full sample or within amyloid-positive and amyloid-negative groups.
Relationship between dprime and novelty responses
The relationship of tau pathology with behavioural memory performance in the functional MRI task on the one hand and with medial temporal novelty responses on the other hand interacted with amyloid status. As a follow-up analysis, we investigated whether behavioural memory performance and novelty responses in the medial temporal lobes were also related to each other in amyloid-positive individuals. A regression analysis (covariates: age, sex, years of education, MRI site, diagnosis) showed that dprime correlated with novelty responses in the left hippocampus [P = 0.007 (FWE), 802 voxels] extending into the left parahippocampal cortex and marginally in right entorhinal cortex [P = 0.062 (FWE), 294 voxels], albeit the entorhinal cluster remained below our predefined voxel extent criterion (Fig. 3F). These findings show that novelty responses in the hippocampal region are related to memory performance and establish a link between our behavioural and functional MRI results.
Discussion
Our findings provide clear converging evidence from brain activity and behaviour that increasing levels of tau pathology are associated with hippocampal dysfunction and memory deficits in medial temporal lobe-dependent tasks if there is also concurrent amyloid pathology. In the absence of amyloid pathology, increasing levels of tau pathology are unrelated to hippocampal dysfunction or memory impairment.
The hippocampus and amygdala together with the perirhinal and entorhinal cortices are core components of an episodic memory network that enables detecting of and orienting towards novel events and their subsequent encoding.6,28,33 Neural activation to novel stimuli is a hallmark process of forming new episodic memories.28,34 Indeed, functional MRI studies have consistently shown that these regions and the extended episodic memory network are more active in response to novel as compared to repeated/familiarized images28,35,36 and our data replicate these findings (Fig. 3A). Our data also show that with increasing levels of total-tau and phospho-tau, hippocampal/amygdala novelty responses and recognition memory accuracy decreased in amyloid-positive individuals (Fig. 3B–E).
Converging evidence from studies in humans, non-human primates and rodents show that recognition memory is impaired by hippocampal and perirhinal dysfunction,33,37 where the familiarity component of recognition memory is dependent on the perirhinal cortex, whereas recollection, like free recall, is impaired by hippocampal dysfunction.38 Selective hippocampal injury leads to a stronger impairment in free recall than in familiarity recognition.37,38 Thus, our findings of a relationship between both recognition memory performance (dprime) and free recall (FCSRT) on the interaction of tau and amyloid pathology indicates that both regions are likely to be dysfunctional. However, the functional MRI data show that the most consistent relationship between hypoactivation to novelty and tau pathology emerged in the hippocampus (Fig. 3B–E). That said, regression analyses showed that in amyloid-positive individuals, dprime performance was positively associated with novelty effects in the hippocampus as well as the parahippocampal cortex (Fig. 3F), indicating that in our sample hippocampal encoding indeed contributed to dprime. This correlation provides a link between the functional MRI and memory performance-based analyses of our study.
By enriching our sample of clinical stages 1 (amyloid-positive healthy controls) and 3 (prodromal Alzheimer’s disease) with the transitional clinical stage 2 (amyloid-positive SCD), we were able to reduce the imbalance in clinical impairment and tau pathology between amyloid-positive and amyloid-negative groups that may have contributed to correlations observed in previous studies targeting the predementia stage (see for instance Timmers et al.10). As can be seen in Figs 1 and 2, both groups had individuals with high tau values and Table 1 shows that only 32% of our amyloid-positive group had prodromal MCI, whereas in a previous study this was the case in 76%.10 Furthermore, we have shown that the behavioural correlations displayed in Figs 1 and 2 remained significant even when clinical diagnosis (healthy controls, SCD, MCI) was considered as a covariate, and the same was true for the functional MRI findings (Fig. 3B–E). The correlation between memory performance, hippocampal activation and CSF total-tau and phospho-tau in amyloid-positive individuals also remained stable when diagnosis was used as a covariate and when total-tau values above 700 pg/ml and phospho-tau values above 100 pg/ml were excluded. To further equate means and variance of tau-pathology across amyloid-positive and amyloid-negative individuals, we performed propensity score-based matching. In this matched sample, despite equal means for phospho-tau levels (Fig. 4A), the interactions between the effect of tau-pathology on memory performance and medial temporal novelty and amyloid-status remained significant and tau-pathology correlated with memory performance and novelty only in the amyloid-positive individuals. Also, a group analysis in this matched sample with A−/T−, A−/T+, A+/T− and A+/T+ showed that dprime (Fig. 4C) was reduced with pathological CSF phospho-tau levels only in amyloid-positive individuals (A+/T+), evident as a significant interaction between amyloid- and tau-positivity (for FCSRT free recall there was a trend for an interaction; Fig. 4B). In a direct comparison, dprime and FCSRT free recall were lower in A+/T+ compared to A−/T+. All these aspects taken together, our findings provide strong evidence that amyloid pathology is permissive for tau-related hippocampus/medial temporal lobe-dependent memory impairment in the predementia spectrum of Alzheimer’s disease.
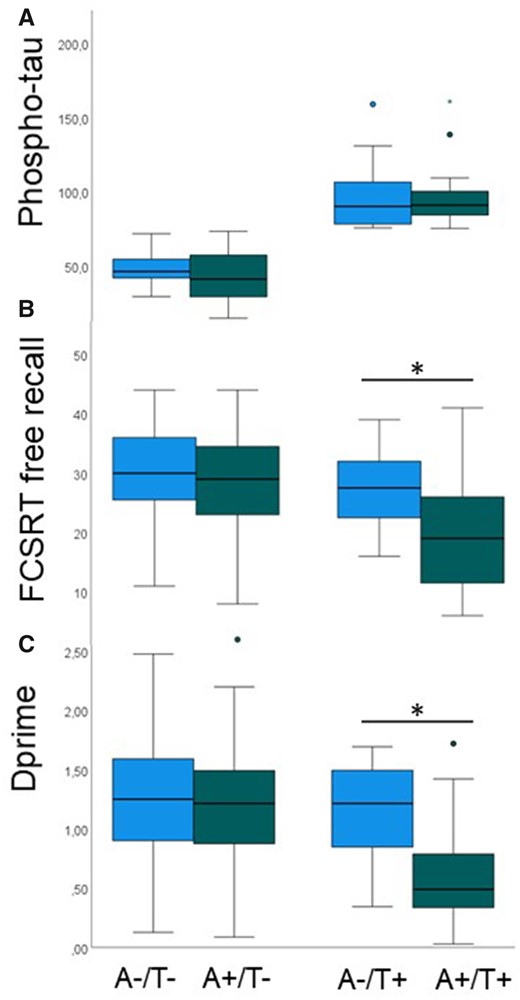
Propensity score matching for phospho-tau pathology across amyloid-positive (A+) and amyloid-negative (A−) individuals. (A) A+ and A− individuals are equated for CSF levels of phospho-tau (y-axis, in pg/ml), both in those with normal (T−) and pathological (T+) phospho-tau levels. (B) Despite matched phospho-tau pathology, FCSRT free recall is reduced in A+/T+ compared to A−/T+. (C) Despite matched phospho-tau pathology, dprime is reduced in A+/T+ compared to A−/T+. Box-and-whisker plots show median (thick horizontal lines), minimum and maximum values (lower and upper end of whiskers) and outliers (circle, star). Whiskers below each box show the first quartile range and those above the fourth quartile range of data. Green bars denote amyloid-positivity and blue bars amyloid-negativity.
Different mechanisms could explain how the additive interaction of amyloid and tau pathology cause hippocampal hypoactivity during encoding. The interaction of amyloid and tau pathology could lead to more pronounced neurodegeneration (hippocampal atrophy) and/or to increased synaptic dysfunction.7 We addressed the first possibility in our analyses by including hippocampal volumes as covariates in our functional MRI analyses. As previously reported by our group on the basis of a smaller sample from the DELCODE study, the relationship between total-tau and novelty was robust even when considering hippocampal volumes as covariates.6 We now show that this is also the case for the relationship between phospho-tau and novelty. This makes it unlikely that the additive effect of amyloid pathology on tau-related hippocampal dysfunction is mediated by stronger neurodegeneration with dual pathology. Rather, our data indicate that increasing levels of tau pathology are associated with increased synaptic dysfunction in the hippocampus when there is concurrent amyloid pathology. However, our volumetric data were cross-sectional and do not reflect potential ongoing volumetric changes within individuals. Moreover, one might consider the possibility that small volumes reflect stable traits rather than indicating a neurodegenerative atrophy process. Nevertheless, the structure-independent functional impact of tau pathology that we observed here is consistent with animal studies showing that misfolded and hyperphosphoylated tau can impair neuronal function.39,40 Early local accumulations of pathological tau in axons leads to presynaptic dysfunction, neuronal hypoactivity and strong behavioural deficits in mice and this effect can be rectified by restoring neuronal energy balance.41 Mislocation of tau to dendritic spines can cause synaptic dysfunction42 and there is evidence that pathological tau reduces network activity.43
When assessing the impact of tau and amyloid pathology on hippocampal function, it is important to consider the interaction of both. Studies in mice showed that tau-dependent hypoexcitability was increased in mice also exhibiting amyloid pathology.7In vitro electrophysiology44 showed that amyloid-β expression in the entorhinal cortex results in hyperexcitability, but in the case of Aβ–tau coexpression activity is reduced because apparently the tau phenotype seems to dominate. Of note, studies in animals indicate that soluble tau species may have greater consequences for neuronal dysfunction than insoluble fibrils,45 compatible with our observation that the hypoactivation caused by tau pathology in amyloid-positive individuals is independent of the size of the hippocampus. By using Aβ42 as covariates in our group-specific regression analyses, we could make sure that the relationship between tau pathology and hypoactivation observed in our study was not driven by parallel variation of CSF tau and amyloid levels. This was also highlighted in our propensity score-matched sample analyses, which showed that even after matching CSF phospho-tau levels for mean value in A+ and A− individuals, medial temporal novelty responses were related to tau pathology only in A+. The neural mechanism leading to reduced novelty responses in our study remains open. One possibility raised by a previous functional MRI study13 is that reduced novelty might be a result of elevated response to repeated stimuli. Another possibility is that the novelty response to the first presentation of each stimulus was reduced. While we cannot resolve this question within the provided set of findings, data from the animal physiology summarized above would support the possibility of hypoactivation by novel stimuli.
Certain amyloid-β oligomer species have been reported to be neurotoxic and cause synaptic dysfunction.1,46,47 A previous study indicated that the earliest accumulation of amyloid-β oligomers (evident in decreased Aβ42 levels in CSF but no discernible amyloid plaque deposition with PET) reduces the resting state connectivity of the precuneus.24 As in a previous study, we did not observe a relationship between CSF Aβ42 levels and novelty responses in any brain region.6 Instead, the additive interaction between tau pathology and amyloid pathology is more akin of amyloid-positivity providing a permissive state for tau-related hippocampal dysfunction irrespective of the actual levels of amyloid pathology.
Developing cognitive and biomarker readouts for clinical trials that target tau pathology in Alzheimer’s disease48 is important given the ongoing uncertainty regarding the efficacy of anti-amyloid treatments. A major question in this context is at what clinical stage and biomarker constellation anti-tau treatments should be assessed. Our data indicate that CSF levels of tau pathology do not bear a clear relationship to hippocampal dysfunction or memory impairment in individuals who are negative for amyloid. Hence, our findings suggest that treatment trials in amyloid-negative individuals with tau pathology would be difficult to perform without suitable outcome measures. Our data also show that for the purposes of inclusion into an anti-tau trial, it would be sufficient to establish amyloid-positivity, whereas the actual level of Aβ42 within the pathological range is not important. Finally, hippocampal and medial temporal novelty responses as used here and medial temporal lobe-dependent memory tasks (delayed recognition memory and free recall) could be suitable as outcome measures given their clear relationship to the degree of tau pathology in amyloid-positive individuals. Another implication of our study is that anti-amyloid treatment could potentially benefit cognition even before tau pathology starts to decrease because the normalization of amyloid pathology could render tau pathology less detrimental. We note that given our negative finding regarding a permissive role of the presence of an ApoE4 allele (failing to replicate8) it would not be sufficient to stratify individuals for ApoE4 status in order to observe a relationship between tau pathology and hippocampal dysfunction or memory impairment.
This study has a number of limitations. Our sample size was not large enough to conduct analyses within each clinical stage of the predementia Alzheimer’s spectrum separately. The sample size after propensity matching of tau pathology across amyloid-positive and -negative individuals was small. Furthermore, this was a cross-sectional analysis and longitudinal data would be helpful to be able to relate the additive effect of amyloid and tau pathology to the rate of neurodegeneration as derived from atrophy over time. Finally, although we spent considerable effort to achieve high imaging quality (harmonized SOPs across sites, continuous QA of data quality and participant positioning, estimation of volumes using combined analyses of T1 and bespoke T2 images) it is possible that total-tau levels were associated with subtle atrophy of the neuropil that we have not been able to capture at 3 T. It would be valuable to follow-up on our results using ultra-high-resolution imaging at 7 T.
To summarize, our results show that across cognitively normal older adults, subjective memory complainers and MCI patients, higher CSF measures of tau pathology are correlated with hippocampal/medial temporal dysfunction and memory impairment, although only in the presence of amyloid-positivity. While the actual degree of CSF-derived amyloid pathology did not modify this relationship, these results show a permissive effect of amyloid pathology on tau-related hippocampal dysfunction and memory impairment. We observed no such permissive effect for the ApoE4 risk allele. These findings have implications for selecting patients in trials targeting tau pathology and also for selecting readouts for target engagement in hippocampal function and hippocampus-dependent memory performance.
Funding
The study was funded by the German Center for Neurodegenerative Diseases [Deutsches Zentrum für Neurodegenerative Erkrankungen (DZNE)], reference number BN012, European Union’s Horizon 2020 Research and Innovation Programme under Grants 785907 (HBP SGA2) and 945539 (HBP SGA3) and the Deutsche Forschungsgemeinschaft (DFG, German Research Foundation) – Project-ID 425899996 – SFB 1436.
Competing interests
E.D. and D.B. are co-founders of neotiv GmbH. E.D. conducted paid consultancy work for Biogen, Roche, RoxHealth (unrelated to this study).
References
Abbreviations
- CERAD
Consortium to Establish a Registry of Alzheimer’s Disease
- DELCODE
DZNE-Longitudinal Cognitive Impairment and Dementia Study
- DZNE
German Center for Neurodegenerative Diseases
- FCSRT
Free and Cued Selective Reminding Test
- MCI
mild cognitive impairment
- SCD
subjective cognitive decline

