


Abstract
The temporal evolutions and relative orderings of Alzheimer disease biomarkers, including CSF amyloid-β42 (Aβ42), Aβ40, total tau (Tau) and phosphorylated tau181 (pTau181), standardized uptake value ratio (SUVR) from the molecular imaging of cerebral fibrillar amyloid-β with PET using the 11C-Pittsburgh Compound-B (PiB), MRI-based hippocampal volume and cortical thickness and cognition have been hypothesized but not yet fully tested with longitudinal data for all major biomarker modalities among cognitively normal individuals across the adult lifespan starting from 18 years. By leveraging a large harmonized database from 8 biomarker studies with longitudinal data from 2609 participants in cognition, 873 in MRI biomarkers, 519 in PET PiB imaging and 475 in CSF biomarkers for a median follow-up of 5–6 years, we estimated the longitudinal trajectories of all major Alzheimer disease biomarkers as functions of baseline age that spanned from 18 to 103 years, located the baseline age window at which the longitudinal rates of change accelerated and further examined possible modifying effects of apolipoprotein E (APOE) genotype. We observed that participants 18–45 years at baseline exhibited learning effects on cognition and unexpected directions of change on CSF and PiB biomarkers. The earliest acceleration of longitudinal change occurred for CSF Aβ42 and Aβ42/Aβ40 ratio (with an increase) and for Tau, and pTau181 (with a decrease) at the next baseline age interval of 45–50 years, followed by an accelerated increase for PiB SUVR at the baseline age of 50–55 years and an accelerated decrease for hippocampal volume at the baseline age of 55–60 years and finally by an accelerated decline for cortical thickness and cognition at the baseline age of 65–70 years. Another acceleration in the rate of change occurred at the baseline age of 65–70 years for Aβ42/Aβ40 ratio, Tau, pTau181, PiB SUVR and hippocampal volume. Accelerated declines in hippocampal volume and cognition continued after 70 years. For participants 18–45 years at baseline, significant increases in Aβ42 and Aβ42/Aβ40 ratio and decreases in PiB SUVR occurred in APOE ɛ4 non-carriers but not carriers. After age 45 years, APOE ɛ4 carriers had greater magnitudes than non-carriers in the rates of change for all CSF biomarkers, PiB SUVR and cognition. Our results characterize the temporal evolutions and relative orderings of Alzheimer disease biomarkers across the adult lifespan and the modification effect of APOE ɛ4. These findings may better inform the design of prevention trials on Alzheimer disease.
Introduction
Alzheimer’s disease is the leading cause of dementia and presents a daunting public health challenge.1 Given that the neuropathological course of Alzheimer’s disease begins decades prior to symptom onset,2–5 the optimal design of prevention trials mandates an accurate identification of early neuropathological events, notably the development of senile plaques and neurofibrillary tangles (NFTs).2,6,7 Decades of biomarker studies have established the validity of multiple Alzheimer’s disease biomarkers to detect amyloid-β (Aβ) and NFT in the brain that correlate with neurodegeneration and cognitive decline. These biomarkers include those from the molecular imaging of cerebral fibrillar Aβ with PET using the 11C-Pittsburgh Compound-B (PiB)8,9 and other tracers (e.g. 18F-AV45), CSF concentrations of Aβ42, total tau (Tau), and phosphorylated tau181 (pTau181),10 tau PET11 and MRI-based brain structural measures. Given that the multifactorial nature of Alzheimer’s disease mandates prevention strategies that can target different aspects of Alzheimer’s disease pathophysiologies, in order to optimally design prevention trials on Alzheimer disease, it is critical to understand the natural history of longitudinal changes in these biomarkers, as well as their relative orderings, among cognitively normal individuals (at baseline). Whereas the biomarker trajectories of longitudinal changes have been well reported for elderly individuals (baseline age of 65 years or older), longitudinal data on fluid and imaging biomarkers of Alzheimer’s disease in cognitively normal individuals from young adulthood of 18 to 45 years may serve as the biomarker baseline and hence are crucial to pinpoint the earliest possible changes. Because age is the biggest risk factor of late onset Alzheimer’s disease, changes in Alzheimer’s disease biomarkers, especially the amyloid and tau markers, as functions of age may be a combined effect of both normal aging and the neuropathological build up in the brain. Hence, for each biomarker, it is important to identify the age window when the longitudinal changes initially start to accelerate, because it may indicate the earliest age when significant neuropathology may be present in the brain. Because Alzheimer’s disease biomarkers from different modalities cannot be directly compared, due to different measurement protocols, units and distributions, accurate estimates of the age windows for accelerated longitudinal changes across Alzheimer’s disease biomarkers allow comparisons on the same scale, and hence shed light on the relative temporal orderings of preclinical biomarker changes. Hypothetical models of Alzheimer’s disease biomarker changes have been proposed12,13 and subsequently tested by at least some cross-sectional studies.14 However, the ultimate testing of these hypotheses requires longitudinal biomarker data sampled from individuals across the entire adult lifespan to ensure the detection of the earliest possible changes. Further, apolipoprotein E (APOE) genotype is the biggest genetic risk factor for late-onset Alzheimer’s disease.14 It remains unknown how APOE genotype may modify the longitudinal trajectories across the entire adult lifespan in amyloid metabolism and neuronal injury, which may have significant implications in designing future prevention trials on Alzheimer’s disease as well.
The primary objective of this study is to estimate the longitudinal trajectories of all major Alzheimer’s disease biomarkers as functions of baseline age that spans from 18 to 103 years from a large sample of 2703 cognitively normal participants who were assessed longitudinally with cognition (n = 2609), MRI (n = 873), PET PiB imaging (n = 519) and CSF biomarkers (n = 475), and to specifically locate the baseline age window when the rates of longitudinal changes accelerated so that the temporal orderings of biomarker changes may be inferred. Another objective is to examine how APOE genotype may modify the longitudinal trajectories of biomarkers and their relative temporal orderings.
Materials and methods
Participants
This retrospective study included harmonized longitudinal data from eight ongoing biomarker studies of Alzheimer’s disease15: (i) Washington University (WU) Adult Children Study (ACS); (ii) Johns Hopkins University (JHU) Biomarkers for Older Controls at Risk for Dementia (BIOCARD) Study; (iii) Wisconsin Registry for Alzheimer’s Prevention (WRAP); (iv) Australian Imaging, Biomarkers and Lifestyle (AIBL) Study; (v) Dominantly Inherited Alzheimer Network (DIAN); (vi) WU Healthy Aging and Senile Dementia (HASD) study; (vii) WU Knight Alzheimer Disease Research Center (ADRC); and (viii) Wisconsin ADRC (WADRC). All eight studies shared a common scientific goal of understanding preclinical changes of Alzheimer’s disease, and recruited young to middle-aged or middle-aged to elderly participants at risk for Alzheimer disease and followed them longitudinally with assessments of Alzheimer’s disease biomarkers (CSF or imaging), cognition and everyday function. Participants’ inclusion and exclusion criteria of individual studies have been described previously.15 The inclusion criteria for the current study were baseline age of at least 18 years, cognitive normality at baseline and availability of longitudinal data on at least one of four modalities: CSF, PiB PET, MRI and cognition. For DIAN participants, only those without a mutation for Alzheimer’s disease (in the genes encoding amyloid precursor protein, presenilin 1 or presenilin 2) were included.3
All participants provided written informed consent at recruitment and agreed to data sharing. The current study was approved by the Institutional Review Board of the WU School of Medicine.
Clinical and cognitive assessments
The clinical and cognitive assessment protocols from all the eight studies are largely consistent with that of the National Alzheimer Coordinating Center Uniform Data Set (UDS),16 which served as the basis for the database harmonization, as described previously.15 The UDS included standard diagnostic criteria for dementia and its differential diagnoses and used the global Clinical Dementia Rating™ (CDR™17,18) to operationalize the presence or absence of dementia and, when present, its severity. Cognitive normality at baseline was defined by a CDR global score of 0. Five cognitive tests were shared by all the studies: the Mini-Mental State Examination,19 Animal Fluency (60 s),20 Wechsler Adult Intelligence Scale (WAIS-R) Digit Symbol,21 Boston Naming Test22 and Logical Memory Delayed Recall.21 For each, a Z-score was calculated by subtracting the mean from the raw score and dividing the difference by the SD of all test scores at baseline. A cognitive composite score was constructed by averaging the five Z-scores.
APOE genotypes
APOE was genotyped from DNA obtained via a blood draw or buccal swab specimens using standard techniques as described previously.15 For this study, APOE ɛ4 status was dichotomized as positive or negative, indicating presence or absence of any ɛ4 alleles, respectively.
CSF sample collection and analysis
Because of well-reported lab-to-lab variations in CSF biomarkers,23,24 CSF analyses were restricted to 4 studies (WU ACS, HASD, ADRC and DIAN) that were similar in collection protocols and also processed longitudinal CSF samples from the same participants on the same assay plates with the same assay platform. Participants underwent lumbar puncture at ∼8 a.m. after overnight fasting; ∼20–30 ml of CSF was collected via gravity drip. Samples were gently inverted to avoid possible gradient effects, briefly centrifuged at low speed and aliquoted into polypropylene tubes prior to freezing at −84°C until analysis. Aβ42, Aβ40, Tau, and pTau181 were measured in batches via an automated immunoassay (LUMIPULSE G1200, Fujirebio, Malverne, PA) according to manufacturer specifications. The analytical performance of the assay has been validated by comparing to results from PET amyloid imaging.25
MRI and PET scan collection and processing
Details of the MRI and PiB PET imaging and MRI collection protocols across studies are provided elsewhere.14,15 In order to best harmonize imaging data across studies, raw PiB PET scans and MRI scans from AIBL, ACS, HASD, WU ADRC, DIAN and WRAP/WADRC were sent to the NeuroImaging Laboratory of WU for central re-processing according to a standard protocol,15 which is similar to that of the Alzheimer Disease Neuroimaging Initiative (ADNI). Structural MRI processing steps included motion correction, if applicable, averaging across scans and atlas transformation. Regional volumes and cortical thickness were obtained via the FreeSurfer image analysis suite (Athinoula A. Martinos Center for Biomedical Imaging, Charlestown, MA). Determination of the regions of interest and pipelines and FreeSurfer quality control (QC) criteria were described elsewhere.26 PET and MRI scans that failed QC or required manual processing were not included in analyses. PiB amyloid in the regions of interest was determined using FreeSurfer, and a standardized uptake value ratio (SUVR) relative to cerebellar grey with correction for partial volume effects was calculated.26 Global Aβ burden was estimated using a mean SUVR over a set of cortical regions (PiB cortical mean) known to be sensitive to Aβ deposition: prefrontal cortex, precuneus (PiB precuneus) and temporal cortex.27
Statistical analyses
Our analytic approaches were designed to address the primary objectives of the study and most importantly, based on the specific structure of our longitudinal database. The major goal is to estimate the longitudinal trajectories of all major Alzheimer’s disease biomarkers as functions of baseline age so that the temporal orderings of biomarker changes may be inferred. There are two primary features of our longitudinal database. One is that almost all participants in the databases had relatively few (2 or 3 or 4) longitudinal assessments for all Alzheimer’s disease biomarkers, covering only a median of 5–6 years of the age window since baseline (Tables 1 and 2). The other is that the baseline age of the participants covered almost the entire adult life span from 18 to 103 years. The former implies that, longitudinally, a linear growth/decline pattern since baseline is a reasonable longitudinal model, which implies that the expected annual rate of change (i.e. the slope) is a reasonable statistic to summarize the short-term longitudinal change of each biomarker. The latter, however, suggests that the relationship between the annual rate of change and the baseline age, which is the biggest risk factor of Alzheimer’s disease, could be very complex and almost surely non-linear, and may also differ from marker to marker. We hence opted to avoid strong parametric assumptions on the rate of change for each biomarker as a function of (continuous) baseline age. Specifically, participants were categorized according to their baseline age into 5-year consecutive intervals with the exception of the youngest and oldest intervals in which the limited sample sizes prevented finer grouping: [18, 45), [45, 50), [50, 55), [55, 60), [60, 65), [65, 70), [70, 75) and [75,104) years. Note here that the left bracket in age interval [x, y) indicates inclusive of age x, while the right parenthesis indicates exclusive of age y. The choice of the 5-year intervals balanced the fineness of the categorization and a reasonable sample size within each interval. Our analyses then focused on estimating the mean longitudinal annual rates of biomarker change among participants whose baseline age fell into each of the baseline intervals. Given that biomarkers across modalities are different in biology, measurement units and distributions, direct and numerical comparisons between them are not biologically meaningful. Although converting all to Z-scores would make data across different biomarkers into a comparable scale with the same mean of 0 and same SD of 1, the estimated rates of change in Z-scores are in the unit of SDs and still cannot be meaningfully compared numerically because different SDs across biomarkers have very different biological interpretations in the biomarker distributions, many of which are not normally distributed. Hence, we aimed to locate the baseline age interval for each biomarker when the longitudinal rate of change initially accelerated. Note that the term ‘acceleration’ here indicates an increase or decrease in the mean rate of biomarker change from participants in a younger baseline age interval to those in the next older interval, and does not imply within-subject acceleration in the rate of change. Importantly, this same approach, due to the fact that no specific functional forms were assumed for the rates of change for any biomarkers as functions of continuous baseline age, can be uniformly applied across all Alzheimer’s disease biomarkers. Therefore, biomarkers across modalities can be compared with respect to the same scale, i.e. the baseline age intervals when their longitudinal rates of change experienced an initial acceleration, leading to possible inferences on the temporal ordering of biomarkers that is not confounded by specific statistical models to specific biomarkers.
Cohort characteristics as defined by modalities
| Variable | CSF cohort | PiB cohort | MRI cohort | Cognition cohort | ||||
|---|---|---|---|---|---|---|---|---|
| Valid na | Summaryb | Valid na | Summaryb | Valid na | Summaryb | Valid na | Summaryb | |
| Baseline age, years | 475 | 61.44 (49.8–68.88) | 519 | 64.11 (52.71–70.98) | 873 | 66.7 (56.98–73) | 2609 | 67.4 (60–74.18) |
| Education, years | 475 | 16 (14–18) | 485 | 16 (13–18) | 837 | 16 (13–18) | 2380 | 16 (12–18) |
| BMI | 394 | 27.32 (24.02–30.7) | 483 | 26.55 (23.7–29.89) | 701 | 26.93 (23.83–30.36) | 1392 | 26.64 (23.75–30.08) |
| Follow-up, years | 475 | 5.94 (3.18–8.99) | 519 | 4.92 (3–6.34) | 873 | 4.65 (3–7.44) | 2609 | 4.62 (3.09–9.22) |
| Gender | 475 | 519 | 873 | 2609 | ||||
| Female | 282 (59.37) | 315 (60.69) | 517 (59.22) | 1595 (61.13) | ||||
| Male | 193 (40.63) | 204 (39.31) | 356 (40.78) | 1014 (38.87) | ||||
| Race | 474 | 518 | 872 | 2607 | ||||
| Black | 37 (7.81) | 25 (4.83) | 71 (8.14) | 163 (6.25) | ||||
| Other | 5 (1.05) | 6 (1.16) | 9 (1.03) | 12 (0.46) | ||||
| White | 432 (91.14) | 487 (94.02) | 792 (90.83) | 2432 (93.29) | ||||
| APOE genotype | 470 | 513 | 863 | 2546 | ||||
| 22 | 2 (0.43) | 2 (0.39) | 3 (0.35) | 12 (0.47) | ||||
| 23 | 61 (12.98) | 64 (12.48) | 112 (12.98) | 313 (12.29) | ||||
| 24 | 18 (3.83) | 15 (2.92) | 28 (3.24) | 78 (3.06) | ||||
| 33 | 247 (52.55) | 271 (52.83) | 447 (51.8) | 1416 (55.62) | ||||
| 34 | 123 (26.17) | 146 (28.46) | 242 (28.04) | 636 (24.98) | ||||
| 44 | 19 (4.04) | 15 (2.92) | 31 (3.59) | 91 (3.57) | ||||
| APOE ɛ4 | 470 | 513 | 863 | 2546 | ||||
| Negative | 475 | 310 (65.96) | 337 (65.69) | 562 (65.12) | 1741 (68.38) | |||
| Positive | 160 (34.04) | 176 (34.31) | 301 (34.88) | 805 (31.62) | ||||
| Education | 475 | 485 | 837 | 2380 | ||||
| ≤12 years | 70 (14.74) | 120 (24.74) | 174 (20.79) | 644 (27.06) | ||||
| >12 years | 405 (85.26) | 365 (75.26) | 663 (79.21) | 1736 (72.94) | ||||
| Family history | 469 | 492 | 839 | 2368 | ||||
| No | 108 (23.03) | 168 (34.15) | 289 (34.45) | 1122 (47.38) | ||||
| Yes | 361 (76.97) | 324 (65.85) | 550 (65.55) | 1246 (52.62) | ||||
Valid n represents the number of participants with no missing values for each modality marker under analysis.
Continuous characteristics are summarized as median and interquartile range (IQR: Q1–Q3); categorical characteristics are summarized as count (percentage).
Number of participants with at least 2, 3 and 4 longitudinal assessments for each Alzheimer’s disease marker, overall and as a function of baseline age
| Baseline age interval | CSF Aβ42 and Aβ40 | CSF Tau | CSF pTau181 | PiB cortical mean and precuneus SUVR | MRI hippocampal volume and cortical thickness | Cognitive composite |
|---|---|---|---|---|---|---|
| All | 475/249/124 | 454/238/119 | 468/247/123 | 519/285/115 | 873/544/301 | 2609/2137/1741 |
| 18–45 | 88/33/12 | 69/22/8 | 81/31/11 | 82/37/17 | 103/52/23 | 132/81/48 |
| 45–50 | 32/24/19 | 32/24/19 | 32/24/19 | 27/20/8 | 42/34/26 | 94/61/47 |
| 50–55 | 45/31/17 | 44/31/16 | 45/31/17 | 40/17/8 | 49/31/22 | 194/150/116 |
| 55–60 | 58/37/24 | 58/37/24 | 58/37/24 | 45/18/6 | 72/46/29 | 230/176/127 |
| 60–65 | 58/39/21 | 57/39/21 | 58/39/21 | 73/39/17 | 102/73/48 | 421/365/308 |
| 65–70 | 99/52/20 | 99/52/20 | 99/52/20 | 107/72/25 | 194/126/63 | 523/465/405 |
| 70–75 | 67/26/11 | 67/26/11 | 67/26/11 | 71/45/17 | 149/89/46 | 442/382/322 |
| 75–104 | 28/7/0 | 28/7/0 | 28/7/0 | 74/37/17 | 162/93/44 | 573/457/368 |
We implemented linear mixed effects (LME) models, more specifically, the random intercept and random slope models28 for each marker that allowed fixed effects of intercepts and slopes (i.e. rates of change) specific to each baseline age interval (group level) and also the random effects of intercept and slope among participants (see detailed implementation in Supplementary material: R and SAS Codes). We first estimated the group-level slopes and then, in order to detect the baseline age interval when the rates of change initially accelerated, compared the slope between participants from two adjacent baseline age intervals by testing the difference against zero (the null hypothesis). Because multiple adjacent baseline age groups were compared, as protection of Type I error rate, we proceeded with these comparisons only after observing a significant overall test (at 5% level) which tested the null hypothesis that all slopes across all eight baseline age groups are equal (see the Supplementary material: R and SAS Codes). As another protection of Type I error rate, we further corrected the raw P-values from the tests of slope differences over all pairs of adjacent baseline age groups and across all the Alzheimer’s disease biomarkers to control for the false discovery rate (FDR) using the Benjamini–Hochberg procedure.29 Because multiple studies contributed longitudinal data to the analyses, we also included study as another random effect to allow study-to-study variation. We further examined the effect of major covariates and confounding factors, including race, gender, APOE ɛ4 status, education and family history as additional fixed effects. In order to assess how APOE ɛ4 status may affect the estimated longitudinal trajectories of biomarkers and the estimated baseline age intervals when the rates of change accelerated, we conducted two analyses. First, we independently repeated the similar analyses as described above by stratification of APOE ɛ4 status (i.e. separate LME models of APOE ɛ4-positive and -negative participants). Second, we included APOE ɛ4 status as a covariate in the LME models and its interactions with baseline age intervals on both the intercept and slope as fixed effects to allow estimates of intercept and slopes specific to each combination of baseline age group and APOE ɛ4 status. The detailed implementation of the integrative LME models on APOE ɛ4 status can be found in the Supplementary material: R and SAS Codes. The missing data were assumed to be missing at random.28
All computations were conducted using the statistical programming language R (version 3.3.1)30 and SAS (version 9.4, Cary, NC).31 LME modelling was conducted using the R package lme432 and PROC MIXED/SAS.31 All statistical tests and CIs were two-sided. Statistical significance was claimed for P < 5%.
Data availability
The de-identified data with a comprehensive database dictionary will be available to all qualified investigators. Data requests should be submitted online (https://biostat.wustl.edu/adrc/pbs_1/register.html). Once the data request is received, a project manager will contact the data requestor to obtain project information about the scientific rationale and hypotheses to be tested and the proposed statistical analysis plan. Upon approval, data will be shared securely after the data requestor signs a data use agreement.
Results
Cohort characteristics by modalities
A total of 2703 unique participants had longitudinal data on at least one of the four modalities: 475 with CSF biomarkers, 519 with PET PiB biomarkers, 873 with MRI biomarkers and 2609 with cognition (Table 1). The sample sizes differ across biomarker modalities because of the different focus of different studies on biomarkers, different processing protocols (only longitudinal data processed under the same protocols were included) and different preferences of participants in biomarker studies. The three biomarker cohorts (CSF, MRI, PET PiB) were essentially subsets of the cognition cohort, and also shared a large number of participants (n = 283). Participants’ age at baseline spanned from 18 to 103 years. Participant characteristics are summarized in Table 1 for all four cohorts as defined by the four modalities. Median follow-up times were 5–6 years across the cohorts. Overall, 2137 participants in the cognition cohort, 544 in the MRI cohort, 285 in the PET PiB cohort and 249 in the CSF cohort had three or more serial observations, and the sample size was reasonable within each baseline age interval from each cohort (Table 2). Baseline characteristics were largely similar across the cohorts: the median baseline age was around 66 years, approximately 60% were female, the majority (∼90%) of the participants were Caucasian, the proportion of APOE ɛ4-positive participants was slightly over 30% and the median year of education was ∼16 years. Around 66–77% of participants in the three biomarker cohorts had a family history of Alzheimer’s disease or dementia, compared to ∼53% in the cognition cohort. Study-specific baseline characteristics are shown in Supplementary Table 1. Baseline age distribution across the eight studies is demonstrated in Supplementary Fig. 1. The DIAN mutation non-carrier had, as expected, much younger baseline age (median/IQR = 36.73, 29.81–43.91 years), but a similar proportion of females (61.15%) to other studies. The proportion of APOE ɛ4 positivity ranged from 27.11% (AIBL) to 40.91% (WRAP) across eight studies. To further assess how studies may vary in their contribution to the estimated longitudinal trajectories, for each biomarker, we tested the null hypothesis that the variance of studies (as a random effect) is 0 (which implies that the studies are homogenous) against the alternative that the variance is positive. No significant study-to-study variation was found for CSF Aβ42, Aβ42/Aβ40, Tau, pTau181, PiB mean cortical SUVR and SUVR in the precuneus. However, the variance associated with studies for hippocampal volume, cortical thickness and cognitive composite was all statistically significant (P < 0.0004), suggesting significant variations across studies. The reported trajectories of longitudinal biomarkers (Fig. 1) hence represent the mean of different trajectories across the studies. Finally, participant baseline characteristics by baseline age groups are also summarized in Supplementary Table 2.
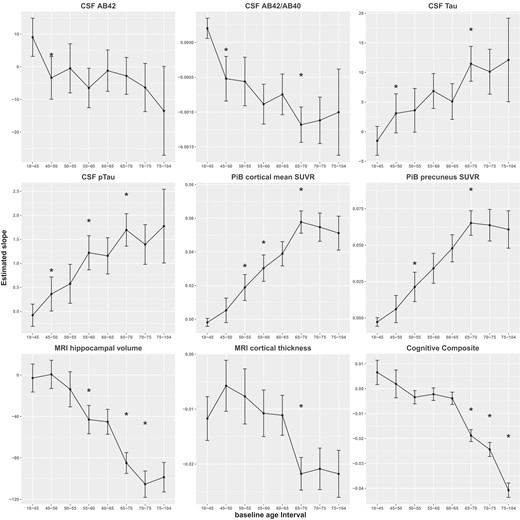
Estimated annual rates of change and their 95% CIs against baseline age interval. AB42 = Aβ42, AB40 = Aβ40, pTau = pTau181. Asterisks indicate the significant difference in slope at a baseline age window in comparison to the previous age window.
Longitudinal trajectories during young adulthood: 18–45 years at baseline
The estimated annual rates of change (i.e. the slopes) for participants 18–45 years at baseline are presented in the first row of Table 3. The cognitive composite showed a statistically significant learning effect (slope = 0.0065, SE = 0.0025, P = 0.0093). The annual rate of change for CSF Aβ42 and Aβ42/Aβ40 ratio was estimated as 9.03 pg/ml (SE = 2.98, P = 0.0028) and 0.0002 (SE = 7.43E-05, P = 0.0077), respectively. This statistically runs counter to the direction these biomarkers behave during the older age intervals (starting from the second row of Table 3). A similar change of direction, but not statistically significant, was also observed to other biomarkers for participants 18–45 years at baseline: cortical mean PiB SUVR (slope = −0.002, SE = 0.0012), SUVR in the precuneus (slope = −0.0028, SE = 0.0015), CSF Tau (slope = −1.55 pg/ml, SE = 1.2449), and pTau181 (slope = −0.08 pg/ml, SE = 0.1180). MRI cortical thickness (slope = −0.0117 mm, SE = 0.0020, P < 0.0001), on the other hand, decreased over time even for the youngest age group.
Estimated annual rates of longitudinal change by baseline age interval and consecutive slope difference from unadjusted analyses
| Baseline age interval | Slope | Slope difference | SE | Raw P | FDR P | Slope | Slope difference | SE | Raw P | FDR P | Slope | Slope difference | SE | Raw P | FDR P |
|---|---|---|---|---|---|---|---|---|---|---|---|---|---|---|---|
| CSF Aβ42 | CSF Aβ42/Aβ40 | CSF Tau | |||||||||||||
| 18–45 | 9.03 | 0.0028 | 0.00020 | 0.0077 | −1.55 | 0.216 | |||||||||
| 45–50 | −3.39 | −12.42 | 4.47 | 0.0055 | 0.039 | −0.00052 | −0.00072 | 0.00018 | 5.6 × 10⁻⁵ | 0.0007 | 3.09 | 4.64 | 2.09 | 0.027 | 0.109 |
| 50–55 | −0.47 | 2.91 | 5.08 | 0.567 | 0.765 | −0.00056 | −0.00004 | 0.00024 | 0.867 | 0.881 | 3.60 | 0.51 | 2.53 | 0.840 | 0.867 |
| 55–60 | −6.50 | −6.03 | 4.92 | 0.221 | 0.437 | −0.00089 | −0.00033 | 0.00023 | 0.157 | 0.354 | 6.87 | 3.27 | 2.41 | 0.176 | 0.382 |
| 60–65 | −1.20 | 5.30 | 4.46 | 0.235 | 0.449 | −0.00075 | 0.00014 | 0.00021 | 0.501 | 0.735 | 5.09 | −1.78 | 2.16 | 0.408 | 0.659 |
| 65–70 | −2.79 | −1.59 | 4.33 | 0.714 | 0.849 | −0.00118 | −0.00044 | 0.00020 | 0.028 | 0.109 | 11.46 | 6.37 | 2.15 | 0.003 | 0.024 |
| 70–75 | −6.35 | −3.56 | 4.74 | 0.452 | 0.695 | −0.00112 | 0.00006 | 0.00021 | 0.770 | 0.851 | 10.13 | −1.33 | 2.45 | 0.587 | 0.765 |
| 75–104 | −13.49 | −7.14 | 7.90 | 0.366 | 0.623 | −0.00100 | 0.00012 | 0.00036 | 0.744 | 0.849 | 12.11 | 1.99 | 4.09 | 0.627 | 0.790 |
| CSF pTau181 | PiB cortical mean SUVR | PiB precuneus SUVR | |||||||||||||
| 18–45 | −0.08 | 0.500 | −0.002 | 0.121 | −2.8 × 10⁻³ | 0.072 | |||||||||
| 45–50 | 0.36 | 0.44 | 0.22 | 0.041 | 0.129 | 0.005 | 0.007 | 0.0039 | 0.068 | 0.186 | 6.1 × 10⁻³ | 0.009 | 0.005 | 0.077 | 0.202 |
| 50–55 | 0.57 | 0.21 | 0.27 | 0.438 | 0.690 | 0.019 | 0.014 | 0.0054 | 0.012 | 0.063 | 0.02 | 0.015 | 0.007 | 0.030 | 0.110 |
| 55–60 | 1.22 | 0.65 | 0.28 | 0.019 | 0.085 | 0.030 | 0.011 | 0.0056 | 0.041 | 0.129 | 0.03 | 0.013 | 0.007 | 0.083 | 0.210 |
| 60–65 | 1.16 | −0.06 | 0.26 | 0.808 | 0.867 | 0.039 | 0.009 | 0.0054 | 0.116 | 0.270 | 0.05 | 0.014 | 0.007 | 0.052 | 0.156 |
| 65–70 | 1.70 | 0.54 | 0.26 | 0.037 | 0.128 | 0.058 | 0.019 | 0.0050 | 0.00017 | 0.0017 | 0.07 | 0.017 | 0.006 | 0.007 | 0.043 |
| 70–75 | 1.39 | −0.30 | 0.27 | 0.267 | 0.495 | 0.055 | −0.003 | 0.0055 | 0.579 | 0.765 | 0.06 | −0.001 | 0.007 | 0.831 | 0.867 |
| 75–104 | 1.78 | 0.38 | 0.44 | 0.391 | 0.648 | 0.051 | −0.004 | 0.0067 | 0.595 | 0.765 | 0.06 | −0.003 | 0.009 | 0.731 | 0.849 |
| MRI hippocampal volume | MRI cortical thickness | Cognitive composite | |||||||||||||
| 18–45 | −2.91 | 0.673 | −0.0117 | 3.8 × 10⁻⁸ | 0.0065 | 0.009 | |||||||||
| 45–50 | 0.62 | 3.52 | 9.79 | 0.719 | 0.849 | −0.0058 | 0.0060 | 0.0031 | 0.056 | 0.161 | 0.0019 | −0.0046 | 0.0038 | 0.222 | 0.437 |
| 50–55 | −13.79 | −14.40 | 11.10 | 0.195 | 0.409 | −0.0077 | −0.0019 | 0.0035 | 0.580 | 0.765 | −0.0034 | −0.0053 | 0.0032 | 0.091 | 0.222 |
| 55–60 | −43.09 | −29.31 | 11.13 | 0.008 | 0.049 | −0.0108 | −0.0031 | 0.0034 | 0.359 | 0.623 | −0.0022 | 0.0012 | 0.0019 | 0.521 | 0.746 |
| 60–65 | −45.15 | −2.06 | 9.29 | 0.824 | 0.867 | −0.0111 | −0.0004 | 0.0028 | 0.899 | 0.899 | −0.0039 | −0.0017 | 0.0018 | 0.362 | 0.623 |
| 65–70 | −84.95 | −39.80 | 7.97 | 5.9 × 10⁻⁷ | 0.00001 | −0.0218 | −0.0106 | 0.0024 | 8.6 × 10⁻⁶ | 0.0001 | −0.0188 | −0.0149 | 0.0018 | 2.0 × 10⁻¹⁷ | 1.3 × 10⁻¹⁵ |
| 70–75 | −105.42 | −20.47 | 8.27 | 0.013 | 0.065 | −0.0209 | 0.0009 | 0.0025 | 0.716 | 0.849 | −0.0244 | −0.0056 | 0.0019 | 3.1 × 10⁻³ | 0.024 |
| 75–104 | −98.66 | 6.77 | 9.76 | 0.488 | 0.732 | −0.0218 | −0.0009 | 0.0029 | 0.755 | 0.849 | −0.0407 | −0.0163 | 0.0021 | 1.9 × 10⁻¹⁵ | 6.0 × 10⁻¹⁴ |
Estimated annual rates of longitudinal change (slope) as a function of baseline age intervals, and the slope differences between two adjacent baseline age intervals along with the associated SE, raw P-value (raw P) for testing whether each slope difference equals to 0 and FDR-corrected P-value (FDR P). The raw P-value on the first row tests whether the slope at the youngest baseline age interval equals 0. Raw P < 0.05 and FDR P < 0.05 are in bold. Slope difference = annual rate from the older age interval – annual rate from prior younger age interval. For example, slope difference at baseline age interval 50–55 equals the annual rate at 50–55 subtracting the annual rate at baseline age interval 45–50. SE = standard error to slope difference estimates.
Longitudinal trajectories after 45 years: at baseline
We first performed, for each marker analysed, an overall approximate F-test to test the null hypothesis that the slopes across all eight baseline age groups are the same, and confirmed that the slopes significantly differed from each other (Supplementary Table 3; all markers P < 0.014). Estimated mean annual rates of change are presented in Table 3 for each baseline age interval older than 45 years, along with the differences in the rates of change between two adjacent baseline age intervals and SE and P-values for testing the null hypothesis that the difference is 0. The annual rate of change for both CSF Aβ42 and Aβ42/Aβ40 ratio turned negative for participants whose baseline age fell into the next interval of [45,50) years, and was estimated at −3.39 pg/ml and −0.00052, respectively, resulting in a statistically significant difference for the age interval relative to its preceding interval [18, 45) years (slope difference/SE = −12.42/4.47 pg/ml and P = 0.0055 for Aβ42; slope difference/SE = −0.00072/0.00018 and P < 0.0001 for Aβ42/Aβ40 ratio; Table 3). In fact, [45, 50) years is the only baseline age interval in which a significant acceleration in the rate of change for Aβ42 was observed from the preceding interval. Similarly, the rates of change for CSF Tau and pTau181 turned positive in the baseline age interval of [45, 50) years, significantly different from those in the preceding interval [18, 45) years (slope difference/SE = 4.64/2.09 pg/ml, P = 0.027 for Tau; slope difference/SE = 0.44/0.22 pg/ml, P = 0.041 for pTau181). The rate of increase in pTau18 further accelerated at the age interval of [55, 60) years when compared to [50, 55) years (difference/SE = 0.65/0.28 pg/ml, P = 0.019).
For PiB mean cortical SUVR, the annual rate of increase nearly quadrupled at the baseline age interval of [50, 55) years when compared to [45, 50) years (slope difference/SE = 0.014/0.0054, P = 0.012), resulting in the first significant acceleration in its longitudinal change. A similarly accelerated rate of change was observed at the same baseline age interval for PiB SUVR at the precuneus (P = 0.030).
The annual rate of decline for hippocampal volume more than tripled (slope = −43.09 mm3) at the baseline age interval of [55, 60) years in comparison to the preceding interval (slope = −13.79 mm3), resulting in the first significant acceleration (P = 0.008). For cortical thickness, albeit a significant decline already in the youngest age interval of [18, 45) years, the first and only significant acceleration in the annual rate of decline appeared at the baseline age interval of [65, 70) years (P < 0.0001).
Another acceleration in the rate of decline was observed at the baseline age interval of [65, 70) years (in comparison to the age interval of [60, 65) years) for CSF Aβ42/Aβ40 ratio (P = 0.028) and hippocampal volume (P < 0.0001), and another acceleration in the rate of increase was observed at the same baseline age interval of [65, 70) years for CSF Tau (P = 0.003), pTau181 (P = 0.037), PiB mean cortical SUVR (P = 0.041) and PiB SUVR at the precuneus (P = 0.007). The decline in hippocampal volume continued to accelerate at the baseline age interval of [70, 75) years (P = 0.013).
Finally, for cognition, the first significant acceleration in the rate of decline was observed at the baseline age interval of [65, 70) years when the annual rate of decline (slope = −0.0188) more than quadrupled in comparison to that at the preceding interval (slope = −0.0039; P < 0.0001). The rate of cognitive decline continued to accelerate subsequently all the way until the oldest baseline age interval of [75, 104) years (P’s < 0.0001).
For each biomarker, the estimated annual rate of change and its 95% CI within each baseline age interval are presented separately in Fig. 1. To better visualize the longitudinal trajectories, the estimated longitudinal trajectory for participants within each baseline age group was plotted against the actual longitudinal age window at which the marker was repeatedly assessed (Fig. 2). Across adjacent baseline age groups, because longitudinal follow-ups from some participants in the younger group stretched into the older age window, the estimated trajectories overlapped slightly. A smoothed trajectory was obtained across the entire age range by using piecewise polynomial B-splines (Fig. 2). Specifically, we specified 11 knots (with the 2 boundary knots), varied the degree from 1 to 4, and found that the optimal degree was 3, i.e. cubic spline basis. Additionally, we applied the generalized additive model for location, scale and shape (GAMLSS)33,34 and used the R package ‘gamlss’ to obtain another smooth curve of the predicted mean marker expression against age (Supplementary Fig. 2). The mean and SD of the predicted marker expression were both assumed to be B-spline functions of age whose degrees of freedom (DF) were simultaneously optimized to attain optimal Akaike information criterion (AIC). Overall, the trajectories by cubic spline smoothing (Fig. 2) displayed very similar patterns to the smoothed trajectories by the GAMLSS (Supplementary Fig. 2).
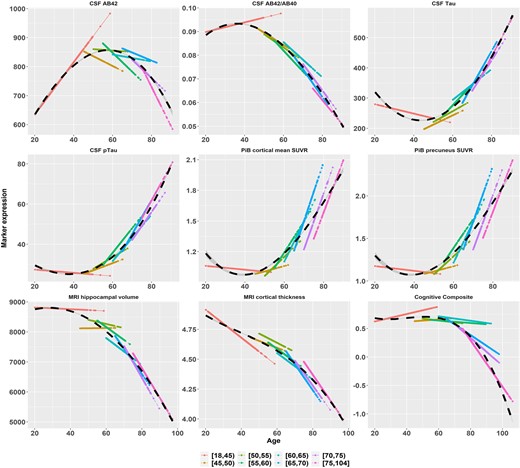
Longitudinal trajectories (in solid lines) as functions of age overlaid across baseline age groups. AB42 = Aβ42, AB40 = Aβ40, pTau = pTau181. The data-points and lines are the predicted mean expression of Alzheimer’s disease markers based on the LME model fitting. The black dashed curve is the cubic spline smoothed curve over the entire age span.
Longitudinal trajectories after adjusting for covariates
The adjusted analyses, taking into account of possible effects of major covariates and confounding factors, including race, gender, APOE ɛ4 status, education and family history, are presented in Table 4. The adjusted analyses confirmed the learning effect on cognition and also the unexpected directions of change on CSF and PiB biomarkers during the young adulthood of [18, 45) years at baseline, and the subsequent baseline age intervals when the rate of change accelerated.
Estimated annual rates of longitudinal change by baseline age interval and consecutive slope difference from adjusted analyses
| Baseline age interval | Slope | Slope difference | SE | Raw P | FDR P | Slope | Slope differencce | SE | Raw P | FDR P | Slope | Slope difference | SE | Raw P | FDR P |
|---|---|---|---|---|---|---|---|---|---|---|---|---|---|---|---|
| CSF Aβ42 | CSF Aβ42/Aβ40 | CSF Tau | |||||||||||||
| 18–45 | 9.1722 | 0.0035 | 0.0002 | 0.0136 | −1.6152 | 0.2739 | |||||||||
| 45–50 | −3.0699 | −12.2421 | 4.3514 | 0.0049 | 0.0386 | −0.00051 | −0.00071 | 0.00019 | 0.0001 | 0.0015 | 3.6128 | 5.2279 | 2.0427 | 0.0105 | 0.0551 |
| 50–55 | 1.0897 | 4.1595 | 5.2129 | 0.4249 | 0.6462 | −0.00051 | 0 | 0.00025 | 0.9922 | 0.9922 | 3.6709 | 0.0582 | 2.2123 | 0.979 | 0.9922 |
| 55–60 | −6.6762 | −7.7659 | 5.2525 | 0.1393 | 0.3250 | −0.00095 | −0.00044 | 0.00023 | 0.0558 | 0.1758 | 6.7151 | 3.0442 | 2.3352 | 0.1924 | 0.4040 |
| 60–65 | 1.2232 | 7.8994 | 5.2063 | 0.1292 | 0.3131 | −0.0008 | 0.00015 | 0.00021 | 0.4787 | 0.6462 | 5.6248 | −1.0903 | 2.466 | 0.6584 | 0.8002 |
| 65–70 | −2.9333 | −4.1565 | 5.2033 | 0.4244 | 0.6462 | −0.00119 | −0.00039 | 0.0002 | 0.0491 | 0.1627 | 12.9568 | 7.332 | 2.8717 | 0.0107 | 0.0551 |
| 70–75 | −6.9236 | −3.9903 | 5.0671 | 0.431 | 0.6462 | −0.00113 | 0.00006 | 0.00021 | 0.7827 | 0.8127 | 10.1329 | −2.8239 | 2.8067 | 0.3144 | 0.5883 |
| 75–104 | −13.0343 | −6.1107 | 7.5542 | 0.4186 | 0.6462 | −0.001 | 0.00013 | 0.00036 | 0.7172 | 0.8127 | 12.0701 | 1.9372 | 3.6755 | 0.5982 | 0.7660 |
| CSF pTau181 | PiB cortical mean SUVR | PiB precuneus SUVR | |||||||||||||
| 18–45 | −0.1156 | 0.3900 | −0.00192 | 0.0265 | −0.0028 | 0.0159 | |||||||||
| 45–50 | 0.3393 | 0.4549 | 0.224 | 0.0423 | 0.1553 | 0.00621 | 0.00813 | 0.00312 | 0.00918 | 0.0551 | 0.0071 | 0.0099 | 0.0043 | 0.0207 | 0.0932 |
| 50–55 | 0.5977 | 0.2584 | 0.2585 | 0.3175 | 0.5883 | 0.01929 | 0.01308 | 0.00638 | 0.04036 | 0.1553 | 0.022 | 0.0149 | 0.0089 | 0.0941 | 0.2695 |
| 55–60 | 1.2759 | 0.6782 | 0.3191 | 0.0335 | 0.1409 | 0.03224 | 0.01295 | 0.00796 | 0.10387 | 0.2726 | 0.0346 | 0.0126 | 0.0104 | 0.2257 | 0.4587 |
| 60–65 | 1.1745 | −0.1014 | 0.3751 | 0.7869 | 0.8127 | 0.03741 | 0.00517 | 0.00714 | 0.46916 | 0.6462 | 0.0439 | 0.0093 | 0.0093 | 0.3165 | 0.5883 |
| 65–70 | 1.9003 | 0.7258 | 0.3883 | 0.0616 | 0.1847 | 0.05399 | 0.01658 | 0.00636 | 0.00917 | 0.0551 | 0.0608 | 0.0169 | 0.0084 | 0.0444 | 0.1553 |
| 70–75 | 1.4123 | −0.488 | 0.3362 | 0.1467 | 0.3301 | 0.04922 | −0.00477 | 0.00677 | 0.48121 | 0.6462 | 0.0579 | −0.0029 | 0.0084 | 0.7315 | 0.8127 |
| 75–104 | 1.7777 | 0.3654 | 0.3887 | 0.3471 | 0.6247 | 0.05432 | 0.0051 | 0.00725 | 0.48208 | 0.6462 | 0.0645 | 0.0066 | 0.0092 | 0.4681 | 0.6462 |
| MRI hippocampal volume | MRI cortical thickness | Cognitive composite | |||||||||||||
| 18–45 | −3.4962 | 0.5961 | −0.0111 | 1.18 × 10⁻⁷ | 0.0069 | 0.0041 | |||||||||
| 45–50 | 0.6985 | 4.1948 | 9.6283 | 0.6631 | 0.8002 | −0.0059 | 0.0052 | 0.0031 | 0.099 | 0.2711 | 0.0034 | −0.0035 | 0.0112 | 0.7519 | 0.8127 |
| 50–55 | −14.7296 | −15.4281 | 10.8221 | 0.154 | 0.3345 | −0.0079 | −0.002 | 0.0035 | 0.5674 | 0.7447 | −0.003 | −0.0064 | 0.0125 | 0.6079 | 0.7660 |
| 55–60 | −46.5483 | −31.8187 | 10.737 | 0.003 | 0.0274 | −0.0109 | −0.0029 | 0.0035 | 0.4004 | 0.6462 | −0.0014 | 0.0016 | 0.0061 | 0.7866 | 0.8127 |
| 60–65 | −40.0167 | 6.5316 | 9.1747 | 0.4765 | 0.6462 | −0.0096 | 0.0012 | 0.0029 | 0.6732 | 0.8002 | −0.0037 | −0.0023 | 0.0015 | 0.1282 | 0.3131 |
| 65–70 | −83.2864 | −43.2697 | 7.8659 | 4.00 × 10⁻⁸ | 7.94 × 10⁻⁷ | −0.022 | −0.0124 | 0.0024 | 5.0 × 10⁻⁷ | 7.12 × 10⁻⁶ | −0.0172 | −0.0135 | 0.0015 | 1.44 × 10⁻¹⁸ | 9.07 × 10⁻¹⁷ |
| 70–75 | −103.9726 | −20.6862 | 8.1728 | 0.0114 | 0.0551 | −0.0211 | 0.0009 | 0.0025 | 0.722 | 0.8127 | −0.0236 | −0.0064 | 0.0017 | 0.0001 | 0.00126 |
| 75–104 | −95.4141 | 8.5584 | 9.7428 | 0.3797 | 0.6462 | −0.0221 | −0.001 | 0.003 | 0.7401 | 0.8127 | −0.0361 | −0.0126 | 0.0019 | 9.45 × 10⁻¹¹ | 2.98 × 10⁻⁹ |
Estimated annual rates of longitudinal change (slope) as a function of baseline age intervals, and the slope differences between two adjacent baseline age intervals along with the associated SE, raw P-value (raw P) for testing whether each slope difference equals to 0 and FDR-corrected P-value (FDR P). The raw P-value on the first row tests whether the slope at the youngest baseline age interval equals 0. Raw P < 0.05 and FDR P < 0.05 are in bold. Slope difference = annual rate from the older age interval – annual rate from prior younger age interval. For example, slope difference at baseline age interval 50–55 equals to the annual rate at 50–55 subtracting the annual rate at baseline age interval 45–50. SE = standard error to slope difference estimates. Adjusted analyses included fixed effects of APOE ɛ4, race, gender, education, family history and a random effect of study.
Effect of APOE ɛ4 on longitudinal trajectories
Overall, the stratified analyses by APOE ɛ4 status (positive versus negative) and the integrative model that included the interactions between APOE ɛ4 status and baseline age intervals on both the intercept and slope as fixed effects yielded similar results. Stratified analyses by APOE ɛ4 status are presented in Table 5, Fig. 3 and Supplementary Table 4. The tables included the estimated annual rates of change by APOE ɛ4 stratum and each baseline age interval, along with the differences in the rates of change between two adjacent baseline age intervals and SE, and P-values for testing the differences (Table 5 and Supplementary Table 4). The estimated longitudinal trajectories as functions of age for APOE ɛ4-positive and -negative participants are presented in Fig. 3. Similar results of integrative analyses are presented in Supplementary Table 5 and Supplementary Fig. 3. Statistical tests for the difference in the rate of change between APOE ɛ4-positive and -negative participants are presented in Supplementary Fig. 4 for the integrative LME model and Supplementary Fig. 5 for the stratified LME models. Although these preliminary analyses have limited statistical power, several observations are important. First, during the young adulthood of [18,45) years at baseline, significant longitudinal increases in CSF Aβ42 and Aβ42/Aβ40 ratio and decreases in PET SUVRs occurred only in APOE ɛ4 non-carriers but not carriers. Second, for baseline ages older than 45 years, APOE ɛ4 carriers, in comparison to non-carriers, had greater magnitudes in the estimated rates of change for all CSF biomarkers and PET amyloid SUVRs as well as cognition, and the differences were statistically significant at multiple baseline age intervals for all the markers except for CSF Tau and cortical thickness (Supplementary Figs 4 and 5). Third, for hippocampal volume and cortical thickness, their longitudinal trajectories were largely overlapping among APOE ɛ4 carriers and non-carriers. Finally, among APOE ɛ4 carriers, the earliest baseline age intervals when the rate of change accelerated for CSF Aβ42, Aβ42/Aβ40 ratio, Tau, pTau181, PiB SUVR (precuneus), hippocampal volume, and even cognition were all very early, either [45, 50) or [50, 55) years. Among APOE ɛ4 non-carriers, however, only PiB SUVRs and the cognition showed the earliest acceleration of longitudinal change at the baseline age intervals of [45, 50) and [50, 55) years, mainly due to the unexpected directions of change in PiB SUVRs and learning effect in cognition at the youngest baseline age intervals.
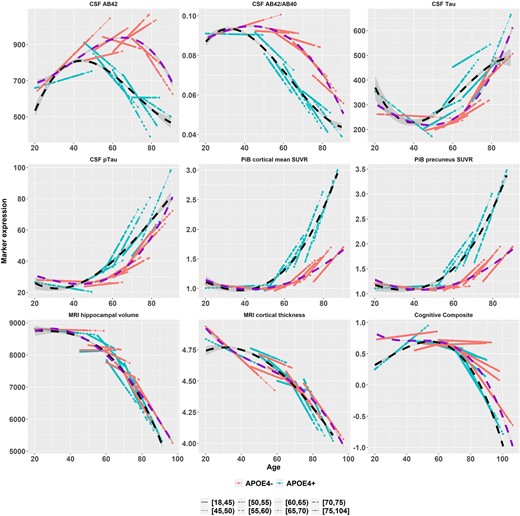
Longitudinal trajectories (in solid lines) for APOE ɛ4-positive (red) and -negative (green) participants as functions of age overlaid across baseline age groups. AB42 = Aβ42, AB40 = Aβ40, pTau = pTau181. The data-points and lines are the predicted mean expression of Alzheimer’s disease markers based on the LME model fitting. The dashed curves are the cubic spline smoothed curves over the entire age span (black = APOE ɛ4 positive, dark violet = APOE ɛ4 negative).
Estimated annual rates of longitudinal change by baseline age interval and consecutive slope difference from unadjusted analyses stratified by APOE ɛ4 status
| APOE ɛ4 positive | |||||||||||||||
|---|---|---|---|---|---|---|---|---|---|---|---|---|---|---|---|
| Baseline age interval | Slope | Slope difference | SE | Raw P | FDR P | Slope | Slope difference | SE | Raw P | FDR P | Slope | Slope difference | SE | Raw P | FDR P |
| CSF Aβ42 | CSF Aβ42/Aβ40 | CSF Tau | |||||||||||||
| 18–45 | 3.21 | 0.487 | −0.00002 | 0.848 | −6.22 | 0.0255 | |||||||||
| 45–50 | −9.1 | −12.31 | 6.24 | 0.048 | 0.235 | −0.00096 | −0.00093 | 0.00028 | 0.0008 | 0.016 | 4.52 | 10.74 | 4.15 | 0.01 | 0.087 |
| 50–55 | −13.08 | −3.98 | 7.89 | 0.614 | 0.841 | −0.00141 | −0.00045 | 0.00042 | 0.281 | 0.693 | 3.69 | −0.83 | 5.69 | 0.884 | 0.955 |
| 55–60 | −12.33 | 0.75 | 8.16 | 0.927 | 0.955 | −0.00147 | −0.00006 | 0.00042 | 0.881 | 0.955 | 10.31 | 6.62 | 5.83 | 0.256 | 0.693 |
| 60–65 | −19.2 | −6.87 | 6.69 | 0.305 | 0.711 | −0.00168 | −0.00021 | 0.00037 | 0.568 | 0.841 | 4.76 | −5.56 | 5.2 | 0.286 | 0.693 |
| 65–70 | −16.17 | 3.03 | 6.01 | 0.614 | 0.841 | −0.0015 | 0.00018 | 0.00033 | 0.576 | 0.841 | 8.35 | 3.59 | 4.89 | 0.462 | 0.841 |
| 70–75 | −0.04 | 16.13 | 7.35 | 0.028 | 0.162 | −0.00077 | 0.00073 | 0.00039 | 0.059 | 0.265 | 11.37 | 3.02 | 5.75 | 0.6 | 0.841 |
| 75–104 | −7.04 | −7 | 10.68 | 0.512 | 0.841 | −0.00126 | −0.0005 | 0.00067 | 0.46 | 0.841 | 19.44 | 8.07 | 41.26 | 0.845 | 0.955 |
| CSF pTau181 | PiB cortical mean SUVR | PiB precuneus SUVR | |||||||||||||
| 18–45 | −0.21 | 0.329 | 0.0016 | 0.545 | 0.0019 | 0.557 | |||||||||
| 45–50 | 0.69 | 0.9 | 0.38 | 0.018 | 0.129 | 0.0075 | 0.0059 | 0.0516 | 0.909 | 0.955 | 0.0075 | 0.0056 | 0.0102 | 0.584 | 0.841 |
| 50–55 | 1.08 | 0.39 | 0.55 | 0.481 | 0.841 | 0.0384 | 0.0309 | 0.0554 | 0.577 | 0.841 | 0.0539 | 0.0464 | 0.0146 | 0.001 | 0.023 |
| 55–60 | 2.25 | 1.17 | 0.58 | 0.044 | 0.233 | 0.05 | 0.0116 | 0.0214 | 0.589 | 0.841 | 0.0541 | 0.0002 | 0.0145 | 0.989 | 0.989 |
| 60–65 | 2.32 | 0.08 | 0.54 | 0.888 | 0.955 | 0.0606 | 0.0106 | 0.0118 | 0.367 | 0.77 | 0.072 | 0.0179 | 0.0161 | 0.266 | 0.693 |
| 65–70 | 1.52 | −0.81 | 0.49 | 0.098 | 0.341 | 0.0871 | 0.0265 | 0.0112 | 0.018 | 0.129 | 0.0992 | 0.0272 | 0.0152 | 0.074 | 0.309 |
| 70–75 | 1.57 | 0.05 | 0.55 | 0.93 | 0.955 | 0.0971 | 0.01 | 0.0222 | 0.653 | 0.842 | 0.1075 | 0.0083 | 0.0147 | 0.572 | 0.841 |
| 75–104 | 3 | 1.43 | 0.96 | 0.137 | 0.41 | 0.0995 | 0.0024 | 0.0253 | 0.924 | 0.955 | 0.1144 | 0.0068 | 0.022 | 0.756 | 0.934 |
| MRI hippocampal volume | MRI cortical thickness | Cognitive composite | |||||||||||||
| 18–45 | −5.51 | 0.717 | −0.0069 | 0.135 | 0.0211 | 0.003 | |||||||||
| 45–50 | 2.39 | 7.89 | 18.42 | 0.668 | 0.842 | −0.0058 | 0.0011 | 0.0057 | 0.841 | 0.955 | −0.0021 | −0.0232 | 0.0079 | 0.003 | 0.041 |
| 50–55 | −29.2 | −31.58 | 19.66 | 0.108 | 0.341 | −0.0121 | −0.0063 | 0.0059 | 0.286 | 0.693 | −0.0041 | −0.0021 | 0.0046 | 0.656 | 0.842 |
| 55–60 | −63.51 | −34.31 | 20.19 | 0.089 | 0.331 | −0.0125 | −0.0004 | 0.0058 | 0.94 | 0.955 | −0.0075 | −0.0033 | 0.0035 | 0.341 | 0.755 |
| 60–65 | −79.74 | −16.24 | 17.28 | 0.347 | 0.755 | −0.0045 | 0.008 | 0.0049 | 0.104 | 0.341 | −0.0107 | −0.0032 | 0.0038 | 0.394 | 0.801 |
| 65–70 | −115.24 | −35.49 | 15.882 | 0.025 | 0.16 | −0.0253 | −0.0208 | 0.0045 | 4.10 × 10⁻⁶ | 1.30 × 10⁻⁴ | −0.0213 | −0.0106 | 0.0038 | 0.006 | 0.061 |
| 70–75 | −127.73 | −12.49 | 16.169 | 0.44 | 0.841 | −0.0265 | −0.0012 | 0.0046 | 0.8 | 0.955 | −0.0419 | −0.0206 | 0.0042 | 8.70 × 10⁻⁷ | 5.50 × 10⁻⁵ |
| 75–104 | −117.95 | 9.78 | 21.128 | 0.643 | 0.842 | −0.0303 | −0.0038 | 0.0062 | 0.537 | 0.841 | −0.0497 | −0.0078 | 0.0046 | 0.089 | 0.331 |
Table 5 displays the results among APOE ɛ4-positive participants only. The full results stratified by APOE ɛ4 negative and by APOE ɛ4-positive participants are provided in the Supplementary material. Estimated annual rates of longitudinal change (slope) as a function of baseline age intervals, and the slope differences between two adjacent baseline age intervals along with the associated SE, by stratification of APOE ɛ4 status, raw P-value (raw P) for testing whether each slope difference equals to 0 and FDR-corrected P-value (FDR P). The raw P-value on the first row tests whether the slope at the youngest baseline age interval equals 0. Raw P < 0.05 and FDR P < 0.05 are in bold. Slope difference = annual rate from the older age interval – annual rate from prior younger age interval. For example, slope difference at baseline age interval 50–55 equals to the annual rate at 50–55 subtracting the annual rate at baseline age interval 45–50. SE = standard error to slope difference estimates.
Results after rigorous multiplicity adjustment
More sensitivity analyses after implementing the Benjamini–Hochberg procedure29 to rigorously correct for multiplicity revealed (see the last column of Tables 3–5 and Supplementary Tables 4 and 5), as expected, some attenuated statistical significance in detecting the accelerated rates of changes for some markers, but largely consistent estimates to the baseline age intervals when the rates of biomarker changes accelerated. Specifically, from the adjusted analyses (Table 4), the initial acceleration of the annual rate of change remained statistically significant for CSF Aβ42 (FDR P = 0.0386) and Aβ42/Aβ40 ratio (FDR P = 0.0015) at the baseline age interval of [45,50) years, for MRI hippocampal volume (FDR P = 0.03) at [55,60) years, for cortical thickness (FDR P < 0.0001) at [65,70) years, and for cognition (FDR P < 0.0001) at [65, 70) years, and a statistical trend for CSF Tau at the baseline age interval of [45, 50) years (FDR P = 0.0551) and the PIB cortical mean SUVR at the baseline age interval of [45,50) years (FDR P = 0.0551). The additional accelerations also remained statistically significant for the MRI markers at the baseline age interval of [65, 70) years (FDR P < 0.0001) and for cognition at and beyond the baseline age interval of [65, 70) years (FDR P < 0.0013).
Discussion
Decades of Alzheimer’s disease research has converged to demonstrate that the neuropathological course of Alzheimer’s disease is decades long, and may begin many years prior to symptomatic onset.2–5 A fundamental question, however, remains unanswered: at exactly what age windows, as opposed to the retrospective time window counting backward from symptomatic onset, do neuropathological changes initiate in this long disease process? Answers to this question are crucial because they not only enhance our understanding of the natural history and the relative orderings of changes for this complex and multifactorial disease process, but also allow optimal designs of future prevention trials to target the initiating neuropathological events, and most importantly, in the right age window.
To address the question, we analysed a large harmonized longitudinal biomarker and clinical/cognitive database from eight ongoing longitudinal studies of Alzheimer’s disease15 whose baseline age spanned from 18 to 103 years, and our findings are significant. Individuals of 18–45 years at baseline, as expected, showed learning effects in cognition with a positive rate of change. However, they also showed unexpected directions of longitudinal change in multiple CSF and imaging biomarkers (i.e. increases in CSF Aβ42 and Aβ42/Aβ40 ratio and decreases in PET SUVRs). Whereas the rate of change in the opposite direction is statistically significant only for CSF Aβ42 and Aβ42/Aβ40, these findings are consistent with a recent study that reported age-dependent relationships between CSF biomarkers, and suggested an earlier preclinical stage than currently appreciated which may involve either elevations or reductions in Aβ42.35 The unexpected cortical thinning that already occurred at the baseline age interval of 18–45 years is primarily from the DIAN non-carriers and consistent with previous reports.36,37 Because our study has no data younger than 18 years, the relative position of cortical thickness in the evolutions of all Alzheimer’s disease biomarkers remains an open question. More and much larger longitudinal studies are needed to understand the underlying mechanism of biomarker changes in this young age group and perhaps even among individuals younger than 18 years.
As baseline age increased to 45 years and older, the rates of change accelerated, and the baseline age interval for the initial acceleration differed across the markers, providing insights into the temporal orderings of preclinical biomarker changes. Specifically, partly due to the unexpected directions of change for multiple biomarkers at the youngest baseline age interval of 18–45 years, the earliest acceleration of longitudinal change occurred for CSF Aβ42 and Aβ42/Aβ40 ratio (with an increase) and for Tau and pTau181 (with a decrease) at the next baseline age interval of 45–50 years. These were followed by an accelerated increase in PiB SUVR at the baseline age of 50–55 years and an accelerated decrease in hippocampal volume at the baseline age of 55–60 years, and finally by an accelerated decrease in cortical thickness and cognition at the baseline age of 65–70 years. Another acceleration in the rate of decrease was observed at the baseline age of 65–70 years for Aβ42/Aβ40 ratio and hippocampal volume and increase for Tau, pTau181 and PiB SUVR. Accelerated declines in hippocampal volume and cognition continued after 70 years. The lack of consistent acceleration over other baseline age intervals could be a result of multiple factors, including the somewhat arbitrary nature of the interval lengths, the distribution of age in the contributing studies leading to different characteristics and sample sizes of participants across different age intervals (hence, different statistical power in comparing rates of changes between age intervals) and the noise in the biomarker measurements.
Our findings provide likely the first comprehensive longitudinal trajectories on all major Alzheimer’s disease biomarkers covering the entire adult lifespan among cognitively normal individuals at baseline. The inflection on the rate of change from the young adulthood of 18–45 years to the next age intervals for multiple Alzheimer’s disease biomarkers is important because it may indicate the very early initiation of the Alzheimer’s disease-related changes from what may be considered the disease-free age window. Our findings also largely support the hypothesized orderings of Alzheimer’s disease biomarker changes during preclinical stages38,39 and are consistent with results from other large biomarker studies including the Alzheimer Disease Neuroimaging Iniative.40 Specifically, we confirm that amyloid, as measured from both CSF and PiB PET imaging, showed an early acceleration in the annual rate of change at the baseline age interval of 45–55 years. However, our results also suggest that the acceleration in the longitudinal progression of other biomarkers, e.g. CSF Tau and pTau181, may initially occur early as well (thanks to the unexpected decrease at the baseline age of 18–45 years), before another acceleration much later at baseline age of 65–70 years.
Perhaps the most surprising, albeit preliminary, finding is that APOE ɛ4 carriers experienced the first acceleration in the longitudinal change in almost all major Alzheimer’s disease markers within a very early age window of 45–50 years or 50–55 years, whereas only PiB PET SUVRs, cortical thickness and cognition showed the earliest longitudinal acceleration of change at the same baseline age intervals among APOE ɛ4 non-carriers. These results suggest that APOE ɛ4 may modulate Alzheimer’s disease biomarker changes much earlier than originally assumed, likely starting in middle age ranges, consistent with a recent cross-sectional study.41 Further, these findings imply that APOE ɛ4 carriers and non-carriers may have different temporal evolutions of changes across biomarkers, consistent with a previous cross-sectional study.42 Because the sample sizes prevented definite assessments of APOE ɛ4 effects on the longitudinal trajectories of these biomarkers, more and larger longitudinal studies are needed to validate these findings.
Our findings may better inform the design of future prevention trials on late-onset Alzheimer’s disease. First, our estimated rates of change across all major Alzheimer’s disease biomarkers and cognition may serve as the pilot data for appropriately powering future prevention trials within specific baseline age windows. The unexpected inflection of directions in the rates of change from the baseline age window of 18–45 years to the next age window of 45–50 years for multiple biomarkers is also important to future design and analyses of prevention trials for late-onset Alzheimer’s disease, especially for primary prevention trials whose primary efficacy of interest is likely the change of Alzheimer’s disease biomarkers. Second, the estimated baseline age intervals when the rate of change initially accelerated, if fully validated, provide the earliest possible age window of intervention for an array of biomarker targets. For example, primary prevention trials targeting amyloid and Tau may need to start from the age window of 45–55 years. Secondary prevention trials that are designed to establish the cognitive efficacy of novel prevention among individuals with positive biomarker profiles may start from the age window of 65–70 years when the first accelerated cognitive decline was observed. Importantly, this is also the age window where an additional acceleration of longitudinal change occurred for multiple biomarkers, consistent with the established associations between longitudinal changes in biomarkers and cognition.7 Third, the relatively early change in MRI-based structure markers suggests that future prevention trials targeting neurodegeneration, in addition to amyloid and Tau, may be necessary to fully prevent Alzheimer’s disease. Finally, the modifying effect of APOE ɛ4 may necessitate stratified randomization and analyses by APOE ɛ4 status in prevention trials.
The current literature in this area of research has limitations: most studies employed a cross-sectional design,14,40 focused on the elderly population (≥65 years) or genetically at-risk population for Alzheimer’s disease,14,40 and were short in longitudinal follow-up with relatively small sample sizes.43 Our study addressed all these limitations: a large and harmonized longitudinal database from multiple biomarker studies using standardized re-processing of imaging scans and CSF samples, coverage of the entire adult lifespan of 18–103 years at baseline and large sample sizes with median follow-ups of 5–6 years, including CSF biomarkers. Our study also has limitations. First, our sample size and lengths of longitudinal follow-ups are still limited, especially for the APOE ɛ4-stratified analyses, including the analyses for the baseline age of 18–45 years where participants were primarily from DIAN non-carriers and had to be lumped together for analyses, and the analyses of CSF biomarkers for the oldest age interval (>75 years) where a very large SE was observed for the slope in CSF Tau. Second, the cognitive composite was based on five shared tests across the studies that may miss cognitive domains important to the preclinical progression. Third, a major limitation is the potential retention and selection bias from eight studies. For example, White constituted ∼90% of the participants in our study, which implies that our findings may not generalize to the general population, especially African Americans. This is especially important because of recent reports on potential racial differences in Alzheimer’s disease biomarkers.44,45 Further, retention bias and survival bias may also confound the findings, especially for individuals in the late adulthood. Finally, the observed biomarker changes may not be due to the Alzheimer’s disease pathology alone, many age-related comorbidities or copathologies may contribute to these changes.
Funding
This study was supported by National Institute on Aging (NIA) grant R01 AG053550 (Dr Xiong) and NIA grants P50 AG005681, P01AG026276 and P01 AG0399131 (Dr Morris), UF1AG032438 (Dr Bateman), U19-AGO33655 and R01 AG059869 (Albert), R01 AG027161 and R01 AG021155 (Johnson), P50AG033514 (Asthana), and The Commonwealth Scientific and Industrial Research Organisation (CSIRO) (Masters). Image processing was supported in part by National Institute of Neurological Disorders and Stroke grant 1P30NS098577 (Neuroimaging Informatics and Analysis Center) and R01 EB009352 (Benzinger). The AIBL study (www.AIBL.csiro.au) was supported by the Alzheimer’s Association (US), the Alzheimer’s Drug Discovery Foundation, an Anonymous foundation, the Science and Industry Endowment Fund, the Dementia Collaborative Research Centres, the State Government of Victorian (Operational Infrastructure Support program), the McCusker Alzheimer’s Research Foundation, the National Health and Medical Research Council and the Yulgilbar Foundation, plus numerous commercial interactions that supported data collection and analysis. Data collection and sharing for this project was partly supported by National Institute on Aging (NIA) grant UF1AG032438 for the Dominantly Inherited Alzheimer’s Network (DIAN) and by the German Center for Neurodegenerative Diseases (DZNE), Raul Carrea Institute for Neurological Research (FLENI), Japan Agency for Medical Research and Development (AMED) grant JP21dk0207049 (Dr. Ikeuchi), and Korea Health Industry Development Institute (KHIDI) (the Korea Health Technology R&D Project). This manuscript has been reviewed by DIAN Study investigators for scientific content and consistency of data interpretation with previous DIAN Study publications. We acknowledge the altruism of the participants and their families and contributions of the DIAN research and support staff at each of the participating sites for their contributions to this study.
Competing interests
All the authors declare no competing interests.
C.X. consults for Diadem. There are no conflicts with this work. S.C.J. has served on a scientific advisory board for Roche Diagnostics and has received research funding from the NIH and from Cerveau Technologies. There are no conflicts with this work. A.M.F. has received research funding from the National Institute on Aging of the National Institutes of Health, Biogen, Centene, Fujirebio and Roche Diagnostics. She is a member of the scientific advisory boards for Roche Diagnostics, Genentech and AbbVie and also consults for Araclon/Grifols, Diadem and DiamiR. There are no conflicts with this work. J.C. has served on a medical advisory board for Otsuka Pharmaceuticals. There are no conflicts with this work. T.I. is supported by Japan Agency for Medical Research and Development (AMED) JP21dk0207049. There are no conflicts with this work. GSD is supported by National Institutes of Health/National Institute on Aging (K23AG064029). He serves as a topic editor on dementia for DynaMed Plus (EBSCO Industries, Inc.), a consultant for Parabon NanoLabs, is the clinical director for the Anti-NMDA Receptor Encephalitis Foundation (uncompensated), has provided record review and expert medical testimony on legal cases pertaining to management of Wernicke encephalopathy and holds stocks (>$10,000) in ANI Pharmaceuticals (a generic pharmaceutical company). There are no conflicts with this work.
Supplementary material
Supplementary material is available at Brain online.
References
Abbreviations
- Aβ
amyloid-β
- DIAN
Dominantly Inherited Alzheimer Network
- LME
linear mixed effects
- PiB
Pittsburgh Compound-B
- SUVR
standardized uptake value ratio

