


Abstract
Seronegative autoimmune encephalitis is autoimmune encephalitis without any identifiable pathogenic antibody. Although it is a major subtype of autoimmune encephalitis, many unmet clinical needs exist in terms of clinical characteristics, treatments and prognosis. In this institutional cohort study, patients diagnosed with seronegative autoimmune encephalitis with available 2-year outcomes were analysed for the disease course, 2-year outcome prediction system, effect of immunotherapy, necessity of further immunotherapy at 6 or 12 months and pattern of brain atrophy. Seronegative autoimmune encephalitis was subcategorized into antibody-negative probable autoimmune encephalitis, autoimmune limbic encephalitis and acute disseminated encephalomyelitis. Poor 2-year outcome was defined by modified Rankin scale scores 3–6, and the 2-year serial data of Clinical Assessment Scales in Autoimmune Encephalitis score was used for longitudinal data analyses. A total of 147 patients were included. The frequency of achieving a good 2-year outcome (modified Rankin scale 0–2) was 56.5%. The antibody-negative probable autoimmune encephalitis subtype exhibited the poorest outcomes, although the baseline severity was similar among the subtypes. The RAPID score, consisting of five early usable clinical factors, refractory status epilepticus, age of onset ≥60 years, probable autoimmune encephalitis (antibody-negative probable autoimmune encephalitis subtype), infratentorial involvement and delay of immunotherapy ≥1 month, was associated with poorer 2-year outcomes. Any immunotherapy was associated with clinical improvement in the patients with low risk for poor 2-year outcomes (RAPID scores 0–1), and the combination immunotherapy of steroid, immunoglobulin, rituximab and tocilizumab was associated with better outcomes in the patients with high risk for poor 2-year outcomes (RAPID scores 2–5). In patients with persistent disease at 6 months, continuing immunotherapy was associated with more improvement, while the effect of continuing immunotherapy for more than 12 months was unclear. In the longitudinal analysis of MRI, the development of cerebellar atrophy indicated poor outcomes, while the absence of diffuse cerebral atrophy or medial temporal atrophy indicated the possibility of a good outcome. This study provides information about the clinical characteristics and courses, the effect of immunotherapy and its duration, and prognostic factors in seronegative autoimmune encephalitis.

For the podcast associated with this article, please visit https://dbpia.nl.go.kr/brain/pages/podcast
See van Steenhoven and Titulaer (https://doi.org/10.1093/brain/awac338) for a scientific commentary on this article.
Introduction
Seronegative autoimmune encephalitis (AE) is AE without any identifiable pathogenic antibody and can be defined by the recently established operational criteria for probable AE.1 On the basis of the criteria, seronegative AE is categorized into three subtypes: autoimmune limbic encephalitis (LE), acute disseminated encephalomyelitis (ADEM) and antibody-negative probable AE (ANPRA).1
While the clinical spectrum of AE has rapidly expanded,1–4 seronegative AE has become the major subtype of AE. The incidence and prevalence of seronegative AE might be similar to those of seropositive AE.4 Although novel autoantibodies that have not yet been identified might account for some portion of seronegative AE, seronegative AE is a major portion of AE with distinct clinical features and pathomechanisms.3,5
Nevertheless, many critical unmet needs exist for seronegative AE. In seropositive AE, the disease mechanism, clinical features and courses, prognosis and effect of combination immunotherapy are established for each autoantibody-mediated disease.6–11 Furthermore, antibody titre changes and seroconversion serve as biomarkers that help to determine the duration of immunotherapy.3,7,12,13 However, in seronegative AE, a highly heterogeneous pathomechanism within the disease entity and lack of autoantibodies have been the major obstacles preventing adequate outcome prognostication, decisions on immunotherapy regimens and durations, and optimization of the effect of each immunotherapy regimen, which are the key elements for treatment.3,5,14,15
In this study, we aimed to address those unmet needs to enable more standardized care for seronegative AE. Thus, we collected 2-year data on clinical severity changes assessed using a recently developed comprehensive clinical severity scale for AE, the Clinical Assessment Scale in Autoimmune Encephalitis (CASE).16 On the basis of these data, we evaluated the clinical characteristics according to the subtypes, effect of each immunotherapy regimen and prognosis in seronegative AE. Furthermore, we investigated the factors available at an early clinical stage that predict 2-year outcomes, markers to monitor the disease course and the effect of immunotherapy in chronic phases in patients with persistent disease.
Materials and methods
Study population
Based on the prospective cohort of patients with clinical suspicion of AE at Seoul National University Hospital (SNUH) from 1 January 2014 to 1 March 2020, this study included all consecutive adult patients who met the following criteria: (i) admitted in SNUH, a national referral centre for encephalitis, presenting with acute or subacute onset of working memory deficits, altered mental status (decreased or altered level of consciousness, lethargy or personality change) or psychiatric symptoms1; (ii) satisfied the diagnostic criteria for possible AE after reasonably excluding infectious aetiologies or aetiologies other than encephalitis; (iii) satisfied the diagnostic criteria for probable AE along with negative results of tests for AE-associated autoantibodies; and (iv) and available 2-year clinical outcomes.
Along with brain MRI and CSF evaluations, the diagnostic work-up for AE included tests for AE-associated autoantibodies and investigations of other aetiologies of encephalitis or encephalopathy. The detection of autoantibodies included the initial screening of patient’s serum and CSF for the presence of autoantibodies using 3,3′-diaminobenzidine immunohistochemical staining on rat brain sections,17,18 followed by cell-based analyses for synaptic/cell-surface antibodies against NMDAR, leucine-rich-glioma-inactivated 1, contactin-associated protein 2, α-amino-3-hydroxy-5-methyl-4-isoxazolepropionic-acid-receptor-1 and 2, dipeptidyl-peptidase–like protein 6, anti-amphiphysin and γ-aminobutyric-acid-receptor-B (Euroimmune Ag) and immunoblotting for intracellular antibodies including collapsin response mediator protein 5, Ma2, Ri, Yo, Hu, Recoverin, Sox-1, Titin, Zic4 and glutamic-acid decarboxylase-65 (Euroimmune Ag).14,19–24
An investigation panel for the other aetiologies of encephalitis/encephalopathy included culture, polymerase chain reaction or Ab assays for bacteria and major viruses, including Herpesviridae, Enterovirus, respiratory virus, John Cunningham (JC) virus, measles, Japanese B virus, Mycobacterium, fungus, mycoplasma, Toxoplasma, Cryptococcus and other infectious aetiologies, if suspected, using patient serum and CSF samples. Based on the patients’ clinical and laboratory profiles, toxic/metabolic aetiologies, systemic or primary CNS vasculitis, demyelinating diseases associated with anti-aquaporin 4 or myelin oligodendrocyte glycoprotein antibodies, prion disease and CNS neoplasm were carefully excluded, if indicated, using relevant diagnostic modalities.1,22 Hashimoto’s encephalopathy and Bickerstaff encephalitis were not included in this study population because those two diseases represent clearly distinct clinical features. This study was approved by the institutional review board of SNUH, and written informed consent was obtained from all enrolled patients or their next of kin.
Analysis of clinical profiles
Time course data of seronegative AE over 2 years were collected using the modified Rankin scale (mRS) score (range 0–6) and CASE scores (ranges 0–27) obtained at each of the following time points: at the time that the essential symptoms of encephalitis developed (baseline), every week (time window of ±2 days) for 12 weeks, every month (time window of ±5 days) for the next 9 months and then every 3 months (time window of ±2 weeks) for the remaining 12 months.11 Two experts in AE (W.-J.L. and S.-T.L. or K.C.) retrospectively evaluated the CASE scores based on the medical records because the data was missing in the prospective cohort. Consensuses were reached after a discussion for the discrepant cases. Data at a time point without available records were left blank.
Along with the disease subtypes, the presence of symptoms of encephalitis constituting the nine CASE score domains was evaluated.16 Refractory status epilepticus (RSE) was defined as persistent status epilepticus despite using an appropriate dose of ≥2 intravenous antiepileptic drugs, including benzodiazepine.11,14
Analysis of brain imaging and laboratory parameters
Two neurologists (W.-J.L. and S.-T.L.) reviewed patients’ baseline MRI. Based on T2-weighted fluid-attenuated inversion recovery images, lesions were present in the cortex, medial temporal cortex, subcortex/white matter, striatum/capsule, thalamus and infra-tentorium, including the brainstem and cerebellum, and spine. Significant diffusion restriction or gadolinium enhancement in the parenchymal lesion was also assessed. CSF parameters included the protein level, leucocyte level and presence of any abnormalities in CSF (leucocyte count ≥5 cells/μl or protein level of ≥40 mg/dl).1,23–26
Analysis of treatment profiles
For the treatment of seronegative AE, corticosteroids and intravenous immunoglobulin (IVIG) (SI) as first-line immunotherapy,23–25 rituximab as second-line immunotherapy and tocilizumab or cyclophosphamide as next-line immunotherapy were administered sequentially or in combination.23–25,27 The timing, number of courses and dosages of each immunotherapy regimen were determined by treating physicians on the basis of the disease severity, responsiveness to previous immunotherapy and safety. Steroids were administered at 1 g daily for 3–5 consecutive days, IVIG at 1−2 g/kg over 1–5 days, rituximab at 375 mg/m2 weekly for four courses with or without additional monthly maintenance15,23–25,27 and tocilizumab at 8 mg/kg monthly (initial dose divided into two 4 mg/kg injections). Reduced or split doses of immunotherapy were applied in patients susceptible to haematologic or infectious complications based on the physicians’ decisions.11,15,24 The time from disease onset to the administration of each immunotherapy regimen was obtained, along with the number of treatment courses.11,23,24
Analysis of the predictors of 2-year outcomes
Univariate analyses and subsequent logistic regression analyses were performed to identify the factors associated with poor 2-year clinical outcomes (mRS scores 3–6).23–27 Using variables that remained significant in the logistic regression model, a prediction score for 2-year outcomes was constructed. Although an unweighted scoring system (assigning each factor 1 point) or a weighted scoring system (assigning points according to the odds ratio (OR, exponential B) of the factor in the regression model) were both evaluated, an unweighted scoring system was chosen for simplicity if both scoring systems showed a significant association with 2-year outcomes. Patients with scores of 3–5 were pooled to overcome the small number of patients with each score. The Cuzick–Wilcoxon test for trends was used to evaluate the association between the prediction score and outcome in the total study population or in each disease subtype. The validation of the scoring system was not performed due to the rarity of the disease and the small number of patients.
Analysis of the effect of immunotherapy
Based on the time-series data of the CASE score, the effects of each treatment regimen on the CASE score change over time was evaluated using a linear mixed model (LMM), in the total study population or subgroups with a low or high risk for poor outcomes divided by the 2-year outcome prediction score. Repeated measure analysis of covariance (RM-ANCOVA) was performed to compare the CASE scores at given time points before and after the immunotherapy regimens, which are at 4 weeks before the initiation, at the time of initiation, at 4 weeks after the initiation and at 8 weeks after the initiation of rituximab or tocilizumab, adjusting for the outcome associated factors. Any adverse event was reviewed along with the regimens used at the time of its development, and the severity was classified using the Common Terminology Criteria for Adverse Events (CTCAE v.5.0).28
Effect of further immunotherapy on persistent disease
Persistent disease at 6 months or at 12 months was defined as mRS score of ≥3 at each time point. To evaluate the effect of administering further immunotherapy at those time points in patients with persistent disease, logistic regression analyses for achieving a further improvement (≥1 score) in the outcome scores at 2 years were used, adjusting for the outcome-predicting factors. RM-ANCOVA for the score changes adjusting for the outcome factors was also performed. Analyses were separately performed for mRS and CASE score improvements. For patients with CSF data within 6 ± 1 months from the onset, CSF protein and leucocyte levels were compared between the groups with or without further immunotherapy, and between the groups with or without further mRS improvement after further immunotherapy.
Serial brain MRI analysis
Follow-up MRI data were reviewed by two neurologists (W.-J.L. and S.-T.L.), blinded to outcomes and other clinical data, to evaluate the development of brain atrophy in the cortex, cerebellum and medial temporal area. Diffuse cortical atrophy (DCA) was assessed using the scale of Pasquier et al.29 on the basis of axial T1-weighted images (range 0–3),29 cerebellar hemisphere atrophy using the scale of Naka et al.30 based on sagittal T1-weighted images (range 0–3)30 and medial temporal atrophy (mTA) using the De Leon et al.31 scale based on axial T1-weighted images (range 0–3).31 In every assessment, MRIs were compared to the template images displayed in the reference articles and moderate to severe atrophy (grade 2–3) was designated significant atrophy.29,30,32,33 The numbers of patients who were identified to have developed atrophy until 3, 6, 12 and 24 months were assessed along with their association with poor 2-year outcomes.
Statistical analysis
Data are presented as the mean ± standard deviation, median (interquartile range) or number (percentage). R software v.4.0.3 (2021; R team, Vienna, Austria) and SPSS 25.0 (IBM Corp., Armonk, NY, USA) were used for statistical analyses, and a P-value <0.05 was considered significant. Here, t-tests, Mann–Whitney U-tests, or ANOVA for continuous variables or χ2 or Fisher’s exact tests for categorical variables were used for the intergroup comparisons. Variables with P-values <0.10 in the univariate analyses for poor 2-year clinical outcomes were entered in multivariate logistic regression analysis using the backward elimination method. Age, sex, time from onset and baseline CASE scores were included in LMM analyses to evaluate the effect of each treatment regimen. The Bayesian information criterion (BIC) value was used to examine the fitness of the LMM. To validate the models derived from the logistic regression, LMM or RM-ANCOVA analyses, bootstrapping with 1000 iterations of random resampling was used. The final model was refit for each iteration, and the mean values of the statistical parameters were calculated. Considering that each subtype might have a distinct disease course, additional analyses were performed after excluding the ADEM Subgroup or dividing each subtype.
Data availability
The datasets of the current study are available from S.-T.L. on request from any qualified investigator.
Results
Patient characteristics
Of the 454 patients admitted to SNUH presenting with acute or subacute onset of working memory deficits, altered mental status or psychiatric symptoms and initially examined, 82 with an identified infectious aetiology, 19 diagnosed with aetiologies other than encephalitis and 57 who did not meet the diagnostic criteria for possible AE were excluded. Among the remaining 296 patients with possible AE, 119 with antibody-positive definitive AE, 16 who did not meet the diagnostic criteria for probable AEs (ANPRA, LE or ADEM) and 14 with a follow-up duration of less than 2 years were sequentially excluded. Finally, 147 patients with seronegative AE [69 (46.9%) female, 78 (53.1%) male, median age 40.0 (24.0–58.0) years] were included in the study analysis (Supplementary Fig. 1).
Every patient was followed up for more than 24 months, except for the five patients who died during the first 24-month of follow-up. Among the 147 patients, a total of 3753 (98.2%) of 3822 (147 patients × 26 time points) clinical data-points were obtained. At baseline, the median CASE score was 13 (9–20), and the median mRS score was 5 (4–5). Three patients had underlying malignancy including small cell lung cancer, anaplastic thyroid cancer and pancreatic neuroendocrine tumour each.
Next, 117 (79.6%) patients were classified as ANPRA, 23 (15.6%) as LE and seven (4.8%) as ADEM subtype. Among the 117 patients with the ANPRA subtype, 117 (100.0%) had a brain MRI abnormality, 84 (71.8%) had CSF pleocytosis (≥5 cells/μl), 37 (31.6%) had elevated CSF immunoglobulin G index (≥0.7), 11 (9.4%) had CSF restricted oligoclonal bands and 3 (2.6%) were confirmed by brain biopsy demonstrating brain inflammatory infiltration and exclusion of other disorders.1 There was no significant difference in the demographic profiles and baseline severity among the subtypes (Table 1).
Comparison of clinical, laboratory, treatment and outcome profiles among the disease subgroups
| Total (n = 147) | ANPRA (A, n = 117) | LE (B, n = 23) | ADEM (C, n = 7) | P | ||
|---|---|---|---|---|---|---|
| Age of onset (years) | 43.0 [24.5–58.0] | 44.0 [24.0–60.0] | 44.0 [30.5–57.5] | 37.0 [30.0–43.5] | 0.710 | |
| Male sex (%) | 78 (53.1) | 65 (55.6) | 10 (43.5) | 3 (42.9) | 0.488 | |
| Clinical profiles | ||||||
| Initial CASE scores | 13 [9–20] | 13 [9–20] | 15 [9–18.5] | 15 [9.5–18.5] | 0.982 | |
| Initial mRS scores | 5 [4–5] | 5 [4–5] | 4 [4–5] | 5 [4–5] | 0.674 | |
| RSE (%) | 44 (29.9) | 35 (29.9) | 8 (34.8) | 1 (14.3) | 0.584 | |
| Symptom profiles [frequency (%), median] | ||||||
| Seizure (%) | 119 (81.0) | 96 (82.1) | 18 (78.3) | 5 (71.4) | 0.737 | |
| Memory dysfunction (%) | 137 (93.2) | 110 (94.0) | 22 (95.7) | 5 (71.4) | 0.062 | |
| Psychiatric symptoms (%) | 112 (76.2) | 90 (76.9) | 19 (82.6) | 3 (42.9) | 0.089 | |
| Impaired consciousness (%) | 118 (80.3) | 94 (80.3) | 17 (73.9) | 7 (100.0) | 0.315 | |
| Language problem (%) | 105 (71.4) | 86 (73.5) | 16 (69.6) | 3 (42.9) | 0.214 | |
| Dyskinesia/dystonia (%) | 37 (25.2) | 33 (28.2) | 3 (13.0) | 1 (14.3) | 0.246 | |
| Gait instability and ataxia (%) | 117 (79.6) | 96 (82.1) | 14 (60.9) | 7 (100.0) | 0.027* | A, C > B |
| Brainstem dysfunction (%) | 78 (53.1) | 66 (56.4) | 7 (30.4) | 5 (71.4) | 0.045* | C > B |
| Weakness (%) | 86 (58.5) | 73 (62.4) | 9 (39.1) | 4 (57.1) | 0.117 | |
| CSF/MRI profiles | ||||||
| CSF protein level (mg/dl) | 57.0 [43.0–84.0] | 60.0 [45.0–90.0] | 53.0 [36.5–64.5] | 73.0 [58.0–82.0] | 0.241 | |
| CSF leucocyte level (cells/μl) | 10.0 [2.0–29.0] | 11.0 [4.0–34.0] | 9.0 [3.0–15.5] | 2.0 [0.0–16.5] | 0.102 | |
| CSF restricted oligoclonal bands (%) | 12 (8.2) | 11 (9.4) | 0 (0.0) | 1 (14.3) | 0.272 | |
| Any CSF profile abnormality (%) | 133 (90.5) | 106 (90.6) | 20 (87.0) | 7 (100.0) | 0.586 | |
| Any abnormality in MRI (%) | 134 (91.2) | 107 (91.5) | 20 (87.0) | 7 (100.0) | 0.550 | |
| Cortex (%) | 118 (80.3) | 88 (75.2) | 23 (100.0) | 7 (100.0) | 0.168 | |
| Medial temporal cortex (%) | 102 (69.4) | 75 (64.1) | 23 (100.0) | 4 (57.1) | 0.009** | B > A, C |
| Subcortex/white matter (%) | 63 (42.9) | 55 (47.0) | 2 (8.7) | 6 (85.7) | <0.001** | C > A > B |
| Striatum/capsule (%) | 33 (22.4) | 28 (23.9) | 2 (8.7) | 3 (42.9) | 0.115 | C > B |
| Thalamus (%) | 23 (15.6) | 21 (17.9) | 0 (0.0) | 2 (28.6) | 0.060 | C > B |
| Infra-tentorium (%) | 19 (12.9) | 17 (14.5) | 0 (0.0) | 2 (28.6) | 0.074 | C > B |
| Spine (%) | 7 (4.8) | 5 (4.3) | 0 (0.0) | 2 (28.6) | 0.007** | C > B, A |
| Parenchymal enhancement (%) | 11 (7.5) | 11 (9.4) | 0 (0.0) | 0 (0.0) | 0.218 | |
| Diffusion restriction (%) | 47 (32.0) | 36 (30.8) | 6 (26.1) | 5 (71.4) | 0.065 | C > B, A |
| Medial temporal cortex (%) | 15 (10.1) | 9 (7.7) | 6 (73.9) | 0 (0.0) | 0.018* | B > C, A |
| Cortex (%) | 30 (20.3) | 24 (20.5) | 1 (4.3) | 5 (71.4%) | <0.001** | C > B, A |
| Subcortex/white matter (%) | 9 (6.1) | 5 (4.3) | 0 (0.0) | 4 (57.1%) | <0.001** | C > B, A |
| Corpus callosum (%) | 4 (2.7) | 4 (3.4) | 0 (0.0) | 0 (0.0) | 0.596 | |
| Basal ganglia/thalamus (%) | 9 (6.1) | 9 (7.7) | 0 (0.0) | 0 (0.0) | 0.297 | |
| Infra-tentorium (%) | 1 (0.7) | 1 (0.9) | 0 (0.0) | 0 (0.0) | 0.881 | |
| Treatment profiles | ||||||
| Onset to immunotherapy (days) | 8.0 [3.5–17.5] | 7.0 [3.0–17.0] | 12.0 [7.5–22.5] | 7.0 [3.0–9.0] | 0.197 | |
| Delay of immunotherapy ≥1 month (%) | 21 (14.3) | 18 (15.4) | 3 (13.0) | 0 (0.0) | 0.519 | |
| IVIG treatment (%) | 142 (96.6) | 112 (95.7) | 23 (100.0) | 7 (100.0) | 0.515 | |
| IVIG courses | 1 [1–2] | 1 [1–2] | 1 [1–3.5] | 1 [1–1.5] | 0.502 | |
| Steroid treatment (%) | 117 (80.1) | 92 (79.3) | 19 (82.6) | 6 (85.7) | 0.872 | |
| Steroid courses | 1 [1–1] | 1 [1–1] | 1 [1–1] | 1 [1–1] | 0.323 | |
| Rituximab treatment (%) | 113 (78.5) | 88 (77.2) | 21 (91.3) | 4 (57.1) | 0.120 | |
| Onset to rituximab (days) | 31.0 [16.0–74.0] | 30.0 [15.0–77.0] | 33.0 [23.0–73.0] | 34.5 [13.5–55.5] | 0.682 | |
| Rituximab courses | 5.0 [4.0–8.0] | 5 [4–8] | 7 [4–8] | 6 [3–8] | 0.481 | |
| Tocilizumab treatment (%) | 59 (40.4) | 50 (43.1) | 8 (34.8) | 1 (14.3) | 0.268 | |
| Onset to Tocilizumab (days) | 73.0 [25.5–169.5] | 79.0 [25.0–201.0] | 75.5 [42.0–133.0] | 14.0 [14.0–14.0] | 0.467 | |
| Tocilizumab courses | 4 [2–6] | 4 [2–6] | 4.5 [4–5.5] | 1 [1–1] | 0.272 | |
| Cyclophosphamide treatment (%) | 15 (10.2) | 14 (12.0) | 1 (4.3) | 0 (0.0) | 0.358 | |
| Cyclophosphamide courses | 4 [2.5–5.5] | 3.5 [2–5] | 6 [6–6] | – | NA | |
| Outcomes profiles | ||||||
| Follow-up duration (months) | 29.0 [25.0–48.0] | 26.0 [25.0–48.0] | 32.0 [27.0–46.0] | 41.0 [26.5–48.5] | 0.791 | |
| 2-year CASE scores | 3 [1–9.5] | 4 [1–11] | 2 [0.5–5] | 2 [0–7] | 0.136 | |
| 2-year mRS scores | 2 [0–4] | 2 [1–4] | 1 [0.5–2] | 1 [0–3] | 0.069 | A > B, C |
| Favourable 2-year mRS score (%) | 83 (56.5) | 60 (51.3) | 18 (78.3) | 5 (71.4) | 0.042* | B, C > A |
Data are presented as mean ± standard deviation or as median [interquartile range].
*P < 0.05 and **P < 0.01.
Immunotherapy was initiated at 8.0 (3.5–17.5) days from the onset. A total of 142 (96.6%) patients received IVIG treatment, and 117 (80.1%) received steroids. Rituximab was administered to 113 (78.5%) patients for 5 (4–8) courses. Fifty-nine (40.4%) patients received tocilizumab treatment for 4 (2–6) courses, and 15 (10.2%) patients received cyclophosphamide treatment for 4 (2.5–5.5) courses.
For the total seronegative AE patients (n = 147), the median CASE score at 2 years was 3 (1–9.5) and the median mRS score was 2 (0–4). The frequency of favourable 2-year outcomes (mRS scores 0–2) was 83 (56.5%) (Fig. 1A and B). There was no significant difference in the treatment profiles among the subtypes. When CASE score changes in each subtype were plotted over time, there was a trend of decreasing CASE score over time, although the improvement was no more evident after 12-month from the onset. Additionally, the ANPRA subtype was associated with higher mRS scores and a lower frequency of favourable outcomes (Fig. 1C). Comparisons of clinical, laboratory, brain MRI, treatment and outcome profiles among AE subtypes are summarized in Table 1.
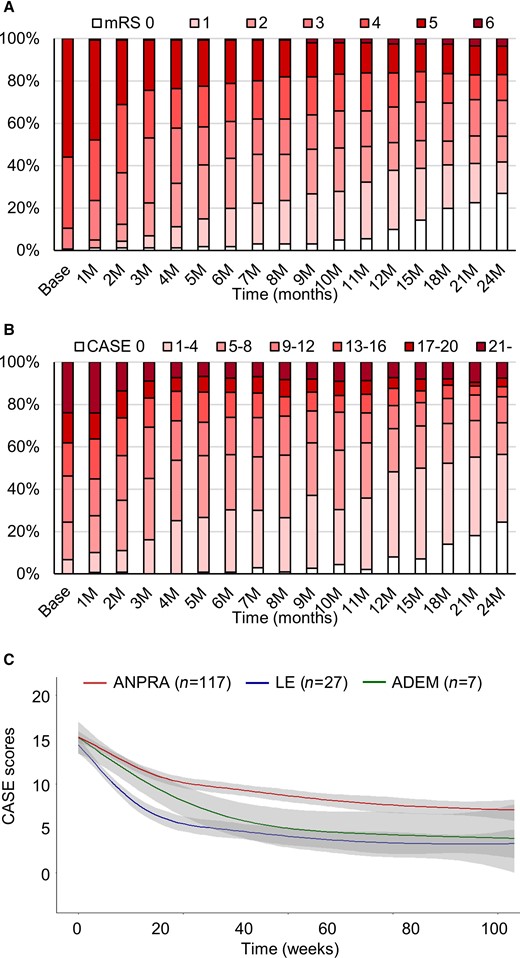
Clinical courses and outcomes of the study population. The mRS score profiles (A), CASE score profiles (B) and CASE score changes in each subtype (C) during the follow-up period. The grey-filled areas indicate the 95% confidence interval (CI) of the trend lines.
Factors associated with 2-year outcomes and the construction of RAPID scores
In univariate analysis, the patients with poor 2-year outcomes were associated with a higher age; higher frequency of ANPRA subtype; brainstem dysfunction and weakness; any CSF profile abnormality; higher CSF protein levels; MRI abnormalities in the subcortex/white matter, striatum/capsule, thalamus and infra-tentorium; diffusion-restriction lesions; delay of immunotherapy ≥ 1 month; cyclophosphamide treatment, compared to the patients with favourable 2-year outcomes, although the baseline severity was comparable (Supplementary Table 1). In subsequent logistic regression analyses, RSE [odds ratio (OR) 4.171, 95% confidence interval (CI) 1.656 to 10.503, P = 0.002], age of onset ≥ 60 years (OR 4.110, 95% CI 1.594 to 10.598, P = 0.003), ANPRA subtype (OR 4.789, 95% CI 1.411 to 16.254, P = 0.012), infratentorial involvement in brain MRI (OR 10.225, 95% CI 3.110 to 33.616, P < 0.001) and delay of immunotherapy for ≥ 1 month (OR 7.379, 95% CI 2.383 to 22.843, P = 0.001) were significantly associated with poor 2-year outcomes (Table 2). The bootstrap validation performed with 1000 iterations (Supplementary Table 2) and the analysis excluding the ADEM subtype (Supplementary Table 3) reproduced the same results.
Logistic regression analysis for the factors associated with the poor clinical course
| Odds ratio (95% CI) | P | |
|---|---|---|
| Refractory status epilepticus (RSE) (n = 44, 29.9%) | 4.171 (1.656 to 10.503) | 0.002** |
| Age of onset ≥ 60 years (n = 34, 23.1%) | 4.110 (1.594 to 10.598) | 0.003** |
| Probable AE (ANPRA) subtype (n = 117, 79.6%) | 4.789 (1.411 to 16.254) | 0.012** |
| Infra-tentorium involvement in brain MRI (n = 19, 12.9%) | 10.225 (3.110 to 33.616) | <0.001** |
| Delay of immunotherapy ≥ 1 month (n = 21, 14.3%) | 7.379 (2.383 to 22.843) | 0.001** |
R2 = 0.422 and P < 0.001 for the logistic regression equation.
**P < 0.01.
Five factors—RSE, age of onset ≥60 years, probable AE (ANPRA) subtype, infratentorial involvement and delay of immunotherapy for ≥1 month—were used to construct a 2-year outcome scoring system, the RAPID score. As associations with outcomes were similar between the unweighted and weighted scoring systems (both, P < 0.001, Cuzick–Wilcoxon test for trends), an unweighted system assigning each factor one point was chosen (score range 0–5). Among the 147 patients, 15 (10.2%) patients had a RAPID score of 0, 52 (35.4%) had a score of 1, 59 (40.1%) had a score of 2, 19 (12.9%) had a score of 3 and 2 (1.4%) had a score of 4. While a RAPID score of 0 was associated with an 86.7% frequency of good 2-year outcomes, higher scores were progressively associated with poor clinical courses and lower frequencies of good 2-year outcomes (Fig. 2). Receiver operating characteristic analysis returned that the RAPID score cut-off of 2 (0–1 versus 2–5) best discriminates the group with poor 2-year outcomes (sensitivity 81.3%, specificity 66.3%).
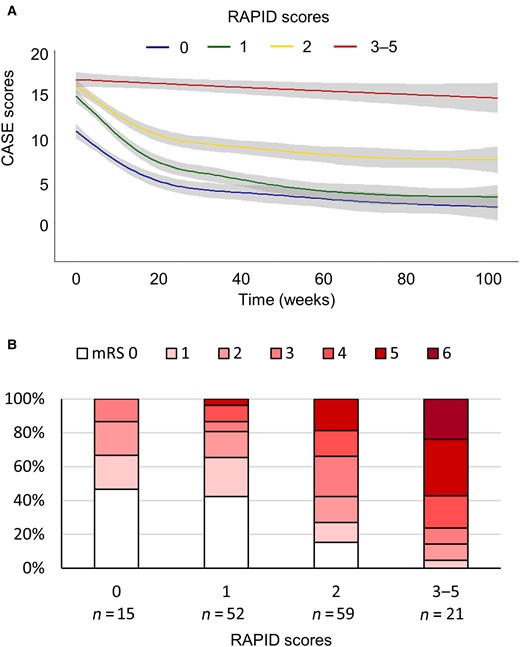
The association of the RAPID scores with 2-year outcomes. The CASE score changes in each RAPID score subgroup during the 2-year follow-up period (A) and distribution of 2-year mRS scores according to the RAPID score subgroups (B). RAPID: RSE, age of onset ≥60 years, antibody-negative probable AE (ANPRA) subtype, infratentorial involvement and delay of immunotherapy for ≥1 month. The grey-filled areas indicate the 95% CI of the trend lines.
When we analysed the validity of RAPID score in each disease subtype (ANPRA, LE and ADEM), RAPID score correlated well with the 2-year outcomes in each ANPRA and LE subtype, but not in the ADEM subtype (Cuzick–Wilcoxon test P < 0.001, P = 0.004 and P = 0.102 for ANPRA, LE, ADEM subtypes, respectively), possibly due to the low number of patients in the ADEM subtype (Supplementary Fig. 2). Nevertheless, the RAPID score was sensitive for predicting poor outcomes in the ANPRA subtype (sensitivity 86.0%), and highly specific for predicting poor outcomes in the LE and ADEM subtypes (both specificity 100.0%)
Analysis of the effect of immunotherapy
In the LMM model, time was inversely (P < 0.001) correlated with CASE score changes, indicating that the immunotherapy improved the patients in overall (Table 3). Age (P = 0.008) and baseline CASE score (P < 0.001) were positively correlated with longitudinal CASE scores. In the analysis of each immunotherapy regimen administered up to each time point, the SI regimen had no outperforming effect in lowering the longitudinal CASE scores [fixed effect (FE) 0.204, 95% CI −0.353 to 0.762, P = 0.472] after adjusting time and other confounders. This LMM analysis does not mean that the SI regimen has no effect, but means that the effect of SI regimen is fully incorporated into the time-dependent recovery. Meanwhile, adding rituximab (FE −1.454, 95% CI −1.967 to −0.941, P < 0.001) or adding tocilizumab (FE −1.372, 95% CI −1.950 to −0.794, P < 0.001) was associated with lower longitudinal CASE scores even after adjusting time and other confounders, indicating that adding these regimens might have accelerated the recovery. The bootstrap validation performed with 1000 iterations (Supplementary Table 4) and the analysis excluding the ADEM subtype (Supplementary Table 5) reproduced the same results.
Linear mixed models for the longitudinal CASE score changes
| Coefficient for the fixed effect (mean ± SE) | 95% CCI | P | |
|---|---|---|---|
| Intercept | 3.017 ± 1.536 | −0.016 to 6.05 | 0.051 |
| Age (years) | 0.058 ± 0.022 | 0.015 to 0.100 | 0.008** |
| Male sex | 0.559 ± 0.792 | −1.004 to 2.123 | 0.481 |
| Baseline CASE scores | 0.523 ± 0.064 | 0.397 to 0.649 | <0.001** |
| Time (weeks) | −0.074 ± 0.003 | −0.08 to −0.069 | <0.001** |
| Regimens | |||
| SI regimen | 0.204 ± 0.284 | −0.353 to 0.762 | 0.472 |
| Adding rituximab | −1.454 ± 0.262 | −1.967 to −0.941 | <0.001* |
| Adding tocilizumab | −1.372 ± 0.295 | −1.950 to −0.794 | <0.001** |
SI = steroid and IVIG. Bayesian information criterion (BIC) values: 19 312.2.
*P < 0.05 and **P < 0.01.
When the LMM analyses were repeated for the patients with low risk for poor 2-year outcomes (RAPID scores 0–1), the SI regimen (P = 0.001), adding rituximab (P < 0.001) and adding tocilizumab (P < 0.001) all significantly were associated with lower longitudinal CASE scores. However, in the patients with a high risk for poor 2-year outcomes (RAPID scores of 2–5), the combined immunotherapy using all of the steroids, immunoglobulin, rituximab and tocilizumab was associated with lower longitudinal CASE scores (P = 0.013) (Table 4). The bootstrap validation performed with 1000 iterations (Supplementary Table 6) and the analysis excluding the ADEM subtype (Supplementary Table 7) reproduced the same results.
Linear mixed models for the longitudinal CASE score changes in subgroups divided by RAPID scores
| Coefficient for the fixed effect (mean ± SE) | 95% CI | P | |
|---|---|---|---|
| Model 1: RAPID scores 0–1 | |||
| Intercept | 3.468 ± 1.746 | −0.012 to 6.949 | 0.051 |
| Age (years) | 0.072 ± 0.031 | 0.009 to 0.134 | 0.025* |
| Male sex | 2.407 ± 0.883 | 0.645 to 4.169 | 0.018** |
| Baseline CASE scores | 0.457 ± 0.072 | 0.312 to 0.601 | <0.001** |
| Time (weeks) | −0.087 ± 0.004 | −0.094 to −0.079 | <0.001** |
| Regimens | |||
| SI regimen | −1.354 ± 0.394 | −2.127 to −0.580 | 0.001** |
| Adding rituximab | −2.742 ± 0.332 | −3.393 to −2.09 | <0.001** |
| Adding tocilizumab | −1.756 ± 0.375 | −2.491 to −1.0200 | <0.001** |
| Model 2: RAPID scores 2–5 | |||
| Intercept | 7.617 ± 2.515 | 2.616 to 12.619 | 0.003** |
| Age (years) | 0.013 ± 0.029 | −0.045 to 0.071 | 0.651 |
| Male sex | −2.470 ± 1.164 | −4.786 to −0.155 | 0.037* |
| Baseline CASE scores | 0.480 ± 0.094 | 0.294 to 0.667 | <0.001** |
| Time (weeks) | −0.065 ± 0.004 | −0.073 to −0.056 | <0.001** |
| Regimens | |||
| SI regimen | 0.873 ± 0.384 | 0.119 to 1.626 | 0.023* |
| Adding rituximab | −0.372 ± 0.377 | −1.111 to 0.366 | 0.323 |
| Adding tocilizumab | −1.057 ± 0.423 | −1.887 to −0.228 | 0.013* |
SI = steroid and IVIG. Bayesian information criterion (BIC) values: model 1 = 8022.9 and model 2 = 11 063.2.
*P < 0.05 and **P < 0.01.
To directly compare the pre- and post-CASE score change after the use of rituximab or tocilizumab, we performed RM-ANCOVA analyses adjusted for RAPID score factors. In patients treated with rituximab, 97/113 (85.8%) had available CASE score data at 4 weeks before the initiation, at the time of initiation and at 4 and 8 weeks after the initiation of rituximab. The remaining 16/113 patients initiated rituximab in 4 weeks from the onset and were excluded from the analysis. While there was no significant change in CASE score for 4 weeks before the rituximab administration (mean change 0.6, 95% CI −0.5 to 1.7, P = 0.257), CASE scores decreased at 4 and 8 weeks after the initiation of rituximab (mean change 2.2, 95% CI 1.5 to 3.0, P < 0.001 and mean change 1.4, 95% CI 1.0 to 1.8, P < 0.001, respectively) (Fig. 3A and Supplementary Table 8).
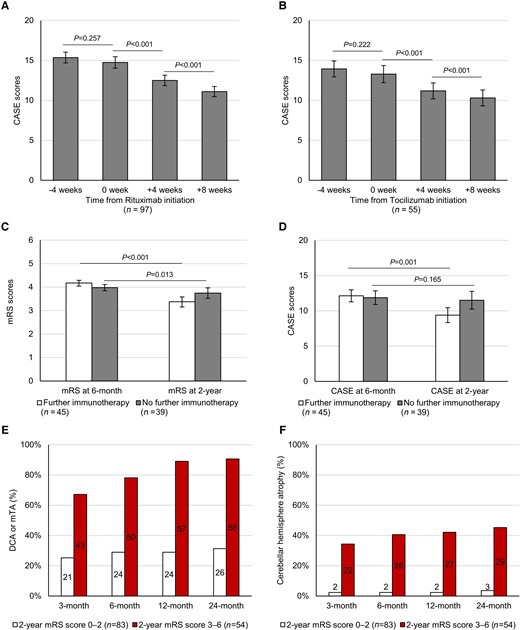
The change in CASE scores before and after the initiation of rituximab or tocilizumab regimens, the effect of further immunotherapy on persistent disease at 6 months and the development of brain atrophy in serial brain MRI follow-up. CASE scores at 4 weeks before the initiation, at the time of initiation, at 4 weeks after the initiation and at 8 weeks after the initiation of rituximab (A) or after the initiation of tocilizumab (B). Comparison of the changes in mRS scores (C) and CASE scores (D) from 6 months to 2 years between groups with or without further immunotherapy. Frequency of patients who developed DCA or mTA (E) and cerebellar hemisphere atrophy (F) at 3, 6, 12 and 24 months, in subgroups with favourable (RAPID scores 0–2) or poor (RAPID scores 3–6) 2-year mRS scores. Error bars indicate the standard error of the mean. P-values were derived from RM-ANCOVA analyses.
For tocilizumab, 55/59 (93.2%) patients had available CASE score data at each time points (at −4, 0, 4 and 8 weeks). While there was no significant change in CASE score for 4 weeks before tocilizumab (mean change 0.7, 95% CI −0.4 to 1.7, P = 0.222), CASE scores decreased at 4 and 8 weeks after the initiation of tocilizumab (mean change 2.1, 95% CI 1.1 to 3.1, P < 0.001 and mean change 0.9, 95% CI 0.5 to 1.3, P < 0.001, respectively) (Fig. 3B and Supplementary Table 8).
A total of 147 adverse events developed during the follow-up. Pneumonia was the most common, followed by leukopenia, acute liver injury, urinary tract infection, acute kidney injury and thrombocytopenia. Sixty-four (43.5%) events occurred during SI, 48 (32.7%) occurred after adding rituximab, and 35 (23.8%) occurred after adding tocilizumab. Serious adverse events (CTCAE Grade 4) developed in four (2.7%) patients (Supplementary Table 9).
Effect of further immunotherapy on persistent disease
Eighty-four (57.1%) patients exhibited persistent disease at 6 months. Among them, 45 (53.6%) patients received further immunotherapies, which were IVIG in 10 (22.2%) patients, rituximab in 29 (64.4%) and tocilizumab in 29 (64.4%). For 39 (46.4%) patients who did not receive further immunotherapy, the major reasons for withholding immunotherapy included infectious complications in 14 (35.9%), respiratory failure/intensive care unit admission in 11 (28.2%) and leukopenia in 8 (20.5%). The baseline characteristics were similar between the patients with and those without further immunotherapy (Supplementary Table 10). Available CSF profiles at 6 ± 1 months were also similar between the groups although the sample sizes were small and the indication of lumbar puncture was not controlled (n = 13 for those with further immunotherapy and 5 for those without further immunotherapy). In RM-ANCOVA adjusting for RAPID scores, administrating further immunotherapy beyond 6 months was associated with more improvement in the mRS (F = 9.29, P < 0.001) and CASE (F = 13.45, P = 0.001) scores until 2 years (Fig. 3C and D). Bootstrap validation performed with 1000 iterations reproduced the results (improvement in mRS: F = 7.15, P = 0.009 and in CASE: F = 5.43, P = 0.022). In the logistic regression analyses adjusting for the factors included in the RAPID score, administrating further immunotherapy beyond 6 months were associated with achieving a further improvement in the mRS (OR 3.381, 95% CI 1.306 to 8.750, P = 0.012) and CASE (OR 5.320, 95% CI 1.977 to 14.315, P = 0.001) scores (Table 5). The bootstrap validation performed with 1000 iterations (Supplementary Table 11) and the analysis excluding the ADEM subtype (Supplementary Table 12) reproduced the same results. Available CSF protein and leucocyte levels at 6 ± 1 months were similar between the patients with and those without mRS improvement after further immunotherapy (n = 7 and 6, respectively, Supplementary Table 13).
Logistic regression analysis for the factors associated with the improvement in mRS or CASE scores after 6 months until 2-year, in the patients with mRS scores ≥3 at 6 months
| Odds ratio (95% CI) | P | |
|---|---|---|
| mRS score improvementa | ||
| Further immunotherapy after 6 months | 3.381 (1.306–8.750) | 0.012* |
| RSE | 0.393 (0.140–1.102) | 0.076 |
| Age of onset ≥ 60 years | 0.416 (0.139–1.240) | 0.116 |
| Probable AE (ANPRA) subtype | 0.986 (0.385–2.523) | 0.976 |
| Infra-tentorium involvement in brain MRI | 0.390 (0.109–1.398) | 0.148 |
| Delay of immunotherapy ≥ 1 month (%) | 0.331 (0.089–1.225) | 0.098 |
| CASE score improvementb | ||
| Further immunotherapy after 6 months | 5.320 (1.977–14.315) | 0.001** |
| RSE | 0.689 (0.248–1.912) | 0.475 |
| Age of onset ≥ 60 years | 0.462 (0.160–1.334) | 0.154 |
| Probable AE (ANPRA) subtype | 1.387 (0.546–3.528) | 0.492 |
| Infra-tentorium involvement in brain MRI | 0.366 (0.099–1.348) | 0.131 |
| Delay of immunotherapy ≥ 1 month (%) | 0.794 (0.219–2.882) | 0.725 |
R2 = 0.229 and P < 0.001 for the logistic regression equation.
R2 = 0.280 and P < 0.001 for the logistic regression equation.
*P < 0.05 and **P < 0.01.
For the 72 (49.0%) patients who exhibited persistent disease at 12 months, administrating further immunotherapy beyond 12 months was not significantly associated with improvement in outcome scores at 2 years in RM-ANOVA (P > 0.05, Supplementary Fig. 3, see Supplementary Table 14 for the profiles of further immunotherapy, reasons for withholding immunotherapy and comparison of the baseline clinical characteristics).
Serial brain MRI analysis
The number of follow-up MRI evaluations was 3 (2–5). During follow-up, DCA developed in 63 (42.9%) patients after a median of 2 (1–3.5) months, cerebellar atrophy in 33 (22.4%) at 2 (1.5–4) months and mTA in 82 (55.8%) at 2 (1–3) months. The development of either DCA or mTA until 6, 12 and 24 months was associated with poor 2-year outcomes with a sensitivity of 78.1, 89.1 and 90.6%, respectively, and a negative predictive value of 80.8, 89.4 and 90.1%, respectively. The development of cerebellar atrophy until 6, 12 and 24 months was associated with poor 2-year outcomes with a specificity of 97.6, 97.6 and 96.4%, respectively, and a positive predictive value of 92.9, 93.1 and 90.6%, respectively (Fig. 3E and F and Supplementary Fig. 4 for representative cases).
Discussion
This study comprehensively describes the features, courses and prognosis of seronegative AE based on a large cohort defined by established diagnostic criteria. The major findings of the current study provide some important information on the current issues with the diagnosis and treatment of seronegative AE. First, the frequency of good 2-year outcomes was 56.5%, and the ANPRA subtype exhibited the poorest outcomes. Second, RAPID scores consisting of five early usable clinical factors (RSE, age of onset ≥60 years, antibody-negative probable AE (ANPRA) subtype, infra-tentorial involvement in brain MRI and delay of immunotherapy for ≥1 month) were associated with poorer 2-year clinical outcomes. Third, the immunotherapy using steroids, IVIG, rituximab or tocilizumab was effective in the disease, and the combined immunotherapy was feasible, especially in patients with a high risk for poor outcomes at baseline (RAPID scores of 2–5). Fourth, further immunotherapy might be effective for improving outcomes in cases of persistent disease at 6 months, while the effect of further immunotherapy after 12 months was unclear. Fifth, the development of cerebellar atrophy indicated poor outcomes, while the absence of DCA or mTA indicated a possibility of recovery.
The frequency of good 2-year outcomes was low in the ANPRA subtype. Compared to the data from NMDAR-antibody encephalitis (NMDAR encephalitis) cohort, good 2-year outcomes were less frequent in the current seronegative AE cohort (56.5% versus 74.4%), although the baseline CASE score was less severe in the seronegative AE cohort [13 (9–20) versus 18.5 (15–23)].11 A possible explanation might be that seronegative AE might have a more irreversible and cytotoxic pathomechanism, whereas the antibody-mediated functional disruption of NMDAR encephalitis is largely reversible. Poor outcomes of the ANPRA subtype might be because of more heterogeneous and mixed pathomechanisms that are refractory to conventional immunotherapy. Therefore, the early diagnosis and prognostication might be crucial to improving the treatment and outcomes of seronegative AE.
The RAPID score can be a useful tool to predict 2-year clinical outcomes. Among the factors included in the RAPID scoring system, RSE and delay of immunotherapy for ≥1 month have been suggested as prognostic factors in NMDAR encephalitis,11,26 while the prognostic association of other factors is newly recognized. The onset age of ≥60 years might reflect lower brain functional reserves, intractable disease subtypes, higher risk of medical complications or lower tolerance to immunotherapy. Additionally, age-related alterations in the CNS immune system, which include amplified activation and impaired regulation of microglia,34,35 might augment the susceptibility for irreversible and cytotoxic mechanisms of seronegative AE. The infratentorial area is where the critical brain function is highly concentrated, and the infratentorial involvement in brain MRI represents the involvement of this susceptible area and the risk of progression. The use of the RAPID score can aid in the clinical stratification of patients for treatment selection and provide outcome information.
Although the combination immunotherapy that adds rituximab and tocilizumab to steroids and IVIG led to better outcomes, especially in patients with a high risk for poor outcomes at baseline (RAPID scores of 2–5), this uncontrolled study does not mean that steroid and IVIG are insufficient for the treatment. In the LMM analysis, the CASE score improved continuously over time and this time-dependent improvement was likely to be initiated by the first lint treatment of steroids and IVIG. This study only suggests that the synergistic interaction of each immunotherapy regimen with different mechanisms might effectively maximize the chance of addressing the diverse pathomechanisms of seronegative AE. Steroids exert broad-spectrum immunomodulation by inhibiting both lymphocyte and myelocyte cells, and inflammatory cytokines.15,36 IVIG promotes pathogenic IgG clearance by saturating neonatal Fc receptors,37,38 neutralizes autoantibodies, downregulates the inflammatory cytokine network and suppresses both T cells and B cells.37,38 Rituximab targets CD20 and thereby inhibits activated and memory B cells. Tocilizumab suppresses B cells, plasma cells, cytotoxic T cells, T helper 17 cells and microglia while facilitating regulatory T cell function and inhibiting interleukin (IL)-6-mediated proinflammatory cytokine production.14,15,24,39–42 In further studies, other treatment options, such as cyclophosphamide,25 an IL-1 receptor antagonist (anakinra),43 a Janus kinase inhibitor (tofacitinib),44 proteasome inhibitor (bortezomib),45 anti-CD19 agents (such as inebilizumab)46 or a novel IL-6 blocker (satralizumab),47,48 could be considered on the basis of the disease status and presumed pathomechanism. Adverse events were frequent during the disease course, but combination immunotherapy was well tolerated in most cases, and severe adverse events were uncommon. However, leukopenia and thrombocytopenia were associated with a high degree of combination immunotherapies and warrant regular surveillance and management.49,50
Our study also provides some evidence about the duration of immunotherapy in seronegative AE. Further immunotherapy might be effective in improving outcomes in cases of persistent disease at 6 months, while it was unclear after 12 months. Currently, there is no consensus on the protocol of immunotherapy in AE and it is a major issue to decide whether to continue immunotherapy in patients with the persistent disease with suboptimal treatment responses in seronegative AE. Our finding might provide a time criterion for deciding when to cease immunotherapy in cases that are refractory despite continuing immunotherapy. Nevertheless, the duration of immunotherapy must be decided on a patient-by-patient basis by carefully considering the patient’s clinical situation. Although we observed that CSF inflammatory markers are not associated with the further use of immunotherapy or the response to further immunotherapy, it is possible that this negative result is due to the small sample size or the indication bias of CSF re-evaluation at 6 months. Those patients with negative treatment responses or marginal CSF abnormality in prior lumbar punctures might have undergone repeated CSF evaluations, decreasing the biomarker value of CSF profiles. Future studies should still aim to identify biomarkers that aid the decision of immunotherapy duration and optimal regimens.
The development of cerebellar atrophy indicates poor outcomes, and the absence of DCA or mTA indicates a possibility of recovery. This finding suggests that serial follow-up MRI might provide information for long-term prognostication and treatment decisions. When significant cerebellar atrophy develops, the probability of achieving a good outcome might be low despite the administration of further immunotherapy. In contrast, the absence of DCA or mTA indicates that further treatments might improve the outcomes. Despite the underlying mechanism of different clinical implications between cerebellar and cortical atrophy, the irreversibility and negative prognostic value of cerebellar atrophy were also demonstrated in NMDAR encephalitis.51,52 However, potential selection bias should be taken into account, as patients with poorer clinical courses might have a higher chance of undergoing repetitive MRI evaluations.
There is an institutional effect to be addressed in this study. In this study, the number of seronegative AE patients was higher than that of seropositive AE. This might be explained by the fact that this cohort is from a national referral centre for AE in South Korea, where atypical, severe or refractory cases choose to be referred in. However, this trend provided a good environment for investigating seronegative AE. The frequency of diffusion restrictions at the initial brain MRI was high not only in ADEM but also in LE and ANPRA subtypes. The main involved areas of diffusion restriction were the cortex for the ANPRA subtype and the medial temporal cortex for the LE subtype, with subtle low apparent diffusion coefficient values. This might reflect the high frequency of prolonged intractable seizures, or status epilepticus in the referred patients, which provokes cytotoxic oedema by neuronal energy failure (Supplementary Fig. 5 for illustrative images).53
The current study has several limitations. First, the different timing of administration among first-line immunotherapy, rituximab and tocilizumab might contribute to the relative underestimation of the effect of first-line immunotherapy. As IVIG and steroids are typically given first at the beginning of the illness, the decrement of CASE scores by IVIG or steroid might at the initial phases have been interpreted as the effect of time in the LMM analyses. Additionally, the delayed effect of IVIG and steroids might have been estimated as the effect of further immunotherapy regimens in patients who failed to improve in the initial phases. Although LMM is a method to partially overcome these issues by adjusting the effect of time and other clinical variables, the uncontrolled study is not sufficient to evaluate the effect of each immunotherapy. Therefore, the results should not be interpreted as that SI regimen is not effective whereas rituximab and tocilizumab are. Second, the effect of immunotherapy should be interpreted considering the possibility of selection bias, given that the treating physician decided the use and timing of each immunotherapy regimen based on the severity, clinical course, responsiveness to previous immunotherapy and adverse events. Third, external validation cohorts to confirm the effect of immunotherapy or the predictive value of RAPID scores on the outcomes are necessary. Given the practical challenges of performing a prospective randomized controlled study for combination immunotherapy in this rare disease, reproducing the findings of the current study with other large cohorts might be the best way to validate our findings.9 Additionally, more advanced immunotherapy regimens or specifically designed treatment strategies based on biomarkers, such as CSF biomarkers or quantitative MRI analysis in different brain segments, might be necessary to improve the outcomes of seronegative AE in the future.14,15
Funding
This project was supported by the Autoimmune Encephalitis Alliance grant (2021), and the National Research Foundation of Korea (NRF) grant funded by the Ministry of Science and ICT, Republic of Korea (2022R1A2B5B01001331).
Competing interests
S.-T.L. reports advisory roles for Roche/Genentech, UCB, Ono Pharmaceuticals, Biofire Diagnostics and Advanced Neural Technologies. All other authors report no competing interests.
Supplementary material
Supplementary material is available at Brain online.
References
Common Terminology Criteria for Adverse Events (CTCAE v5.0). Accessed 27 November 2017. http://evs.nci.nih.gov/ftp1/CTCAE/CTCAE_5.0/
Abbreviations
- ADEM
acute disseminated encephalomyelitis
- AE
autoimmune encephalitis
- ANPRA
antibody-negative probable autoimmune encephalitis
- CASE
Clinical Assessment Scale in Autoimmune Encephalitis
- DCA
diffuse cortical atrophy
- IVIG
intravenous immunoglobulin
- LE
autoimmune limbic encephalitis
- mRS
modified Rankin scale
- mTA
medial temporal atrophy
- RAPID
refractory status epilepticus age of onset ≥ 60 years, antibody-negative probable autoimmune encephalitis subtype, infratentorial involvement and delay of immunotherapy
- RSE
refractory status epilepticus

