


Abstract
The aggregation and prion-like propagation of α-synuclein are involved in the pathogenesis of Parkinson’s disease. However, the underlying mechanisms regulating the assembly and spreading of α-synuclein fibrils remain poorly understood. Tau co-deposits with α-synuclein in the brains of Parkinson’s disease patients, suggesting a pathological interplay between them.
Here we show that tau interacts with α-synuclein and accelerates its aggregation. Compared with pure α-synuclein fibrils, the tau-modified α-synuclein fibrils show enhanced seeding activity, inducing mitochondrial dysfunction, synaptic impairment and neurotoxicity in vitro. Injection of the tau-modified α-synuclein fibrils into the striatum of mice induces more severe α-synuclein pathology, motor dysfunction and cognitive impairment when compared with the mice injected with pure α-synuclein fibrils. Knockout of tau attenuates the propagation of α-synuclein pathology and Parkinson’s disease-like symptoms both in mice injected with α-syn fibrils and α-syn A53T transgenic mice.
In conclusion, tau facilitates α-synuclein aggregation and propagation in Parkinson’s disease.
Introduction
Parkinson’s disease is one of the most common neurodegenerative diseases, affecting more than 6 million people worldwide.1 Clinical symptoms of Parkinson’s disease manifest as motor symptoms (such as tremor, bradykinesia and rigidity) and nonmotor symptoms (such as constipation, depression and cognitive impairment).2,3 The pathological hallmarks of Parkinson’s disease are the progressive loss of dopaminergic neurons in the substantia nigra pars compacta (SNpc) and the formation of Lewy bodies (LBs) in remaining neurons.4 α-Synuclein (α-syn), the main proteinaceous component of Lewy bodies, is highly enriched in presynaptic terminals and soluble under physiological status.5 Mutation and multiplication of the gene coding α-syn (SNCA) and other pathological stimulations, such as exposure to pesticides and heavy metals, posttranslational modifications of α-syn and interaction of α-syn with polyamines trigger the conformational change of α-syn and promote its assembly.6,7 Aggregated α-syn species act as proteinaceous nuclei (‘seeds’) to amplify the formation of α-syn fibrils, which spread throughout the brain and induce the onset of Parkinson’s disease.8 However, the molecular mechanisms that regulate the aggregation and transmission of α-syn remain to be elucidated.
Synucleinopathies including multiple system atrophy, dementia with Lewy bodies and pure autonomic failure share similar pathological features of α-syn deposition.9 However, pathological α-syn aggregates are found in different cell types and brain regions in different synucleinopathies. Parkinson’s disease patients also demonstrate significant heterogeneity in pathological development, symptom severity and drug responsiveness.10 Insoluble α-syn fibrils extracted from different synucleinopathies have diverse pathogenicity. This phenomenon implies the presence of distinct ‘strains’ in synucleinopathies.11,12 Different strains of α-syn aggregates contribute to the pathological and clinical heterogeneity of synucleinopathies.13 However, the molecular mechanisms of the formation of different α-syn strains still hide in the mist.
The microtubule-associated protein tau is hyperphosphorylated and aggregates into neurofibrillary tangles in Alzheimer’s disease.14 Interestingly, tau pathology is also commonly observed in the Parkinson’s disease brains. The comorbidity of α-syn and tau pathology in Parkinson’s disease was first reported in 1988.15 Recently, accumulating evidence confirmed the overlapping of α-syn and tau pathologies in Parkinson’s disease patients.16,17 About 50% of Parkinson’s disease cases exhibit tau pathology.18 Genome-wide association studies identified MAPT, the gene that encodes tau, as one of the risk genes of Parkinson’s disease.19–22 Clinical evidence shows that the concentration of tau in the cerebrospinal fluid is associated with cognitive impairment of Parkinson’s disease.23–26In vitro studies show that α-syn and tau promote the aggregation of each other.27 Although current evidence strongly suggests a role of tau in Parkinson’s disease pathology, the effects of tau on α-syn aggregating, seeding and cell-to-cell transmission remain poorly understood.
In this work, we show that tau interacts with α-syn and induces the formation of a strain with enhanced seeding activity and neurotoxicity both in vitro and in vivo. Deletion of tau in Parkinson’s disease mouse models attenuates the progression of pathological α-syn. Hence, our results support that tau plays a pivotal role in the pathogenesis of Parkinson’s disease.
Materials and methods
Mice
The wild-type C57BL/6J mice, tau knockout (tau−/−) mice, transgenic A53T α-synuclein mutant mice line M83 and tau P301S mice were purchased from Jackson Laboratory (stock numbers: 000664, 007251, 004479 and 008169, respectively).28 M83 mice were bred with tau−/− mice in successive generations to generate offspring that express human α-syn A53T that either lack endogenous mouse tau (TgA53Ttau−/−) or not (TgA53T). PCR analysis of tail DNA was used to identify transgenic progenies as previously described.29 All the TgA53T and TgA53Ttau−/− mice used in this study were in A53T homozygous state. Both male and female mice were used in this study. The sample size was determined by Power and Precision software (GPower 3.1). As requested by the Institutional Animal Care and Use Committee, we minimized animal numbers when the experimental conditions were the same. Thus, data of wild-type mice injected with phosphate-buffered saline (PBS) or α-syn preformed fibrils (PFFs) are the same in Figs 6 and 7. All mice were kept under specific pathogen-free (SPF) conditions in a 14 h light/10 h dark cycle and had free access to food and water. Experimental procedures were approved by the Institutional Animal Care and Use Committee (IACUC) of Renmin Hospital of Wuhan University, with the IACUC issue number of WDRM animal (welfare) 20180703. The mice were randomized into different groups using a random number table. Investigators were blinded to the group allocation during the animal experiments. The protocol was reviewed and approved by the IACUC.
Human tissue samples
Post-mortem brain samples were dissected from the frozen brain samples of control cases and Parkinson’s disease cases from the Emory Alzheimer’s Disease Research Center. The study was approved by the biospecimen committee at Emory University. Parkinson’s disease cases were clinically diagnosed and neuropathologically confirmed. Informed consent was obtained from all subjects. The average age of the control and Parkinson’s disease patients were 71.8 (n = 6) and 71.2 (n = 6), respectively. The average age at onset was 65.0. The average disease duration was 6.8 years. Patients with concomitant dementia were excluded from the study. However, most of the Parkinson’s disease brain samples had Alzheimer’s disease copathology.
Co-immunoprecipitation
The samples were lysed in lysis buffer (50 mM Tris, pH 7.4, 40 mM NaCl, 1 mM EDTA, 0.5% Triton X-100, 1.5 mM Na3VO4, 50 mM NaF, 10 mM sodium pyrophosphate, 10 mM sodium) and centrifuged for 15 min at 16 000g. The supernatant was incubated with tau antibody or control IgG together with protein A/G agarose overnight at 4°C. After extensive washing, the bound proteins were eluted from the beads by boiling in sample buffer and subjected to western blot analysis.
GST pull-down and His pull-down assay
Plasmids encoding glutathione-S-transferase (GST)-vector or GST-tau were co-transfected with green fluorescent protein (GFP)-tagged full-length or fragmented α-syn into HEK293 cells. Meanwhile, GST-vector or GST-α-syn were co-transfected with haemagglutinin (HA)-tagged full-length or fragmented tau into HEK293 cells. The cells were harvested and lysed 48 h after transfection. The cell lysates were incubated with Glutathione agarose beads overnight at 4°C. For His pull-down assay, PBS, monomeric or aggregated his-tagged α-syn and monomeric or aggregated His-tagged tau were incubated with Ni-NTA agarose for 4 h at room temperature. After washing four times with PBS, the beads were incubated with lysates of HEK293 cells transfected with GST-tau or GFP-α-syn plasmids overnight at 4°C. The beads were washed three times in PBS with 0.1% Triton X-100 and boiled in sodium dodecyl sulphate (SDS) loading buffer for 10 min to elute the bound proteins.
Preparation of α-syn PFFs and mixed PFFs
Recombinant human α-syn, human tau (0N3R, amino acids 1–352) and human tau (1–197) proteins were purified as previously described.30 Briefly, α-syn monomer was centrifuged at 100 000 g at 4°C for 60 min with an ultracentrifuge (Beckman Coulter). The supernatant was diluted in PBS in a new 1.5 ml microcentrifuge to a final volume of 500 μl and a final concentration of 1 mg/ml. α-Syn PFFs were prepared by constantly agitating α-syn monomer in a thermomixer (1000 rpm at 37°C; Eppendorf). After 5 days of incubation, the solution in the tube appears turbid. The solution was stored at −80°C. Mixed PFFs were prepared by adding 1 mg/ml of tau (final concentration) into α-syn fibrillization reaction. Tau PFFs (1 mg/ml) were prepared by mixing equimolar tau with low molecular weight heparin and 2 mM DTT in 100 mM sodium acetate buffer (pH 7.0) and constantly agitated for 5 days (1000 rpm at 37°C).31 The fibrillization of α-syn and tau was monitored by thioflavin T (ThT) analysis. Incubation mixture (10 μl) was taken at various time points, diluted to 100 μl with 25 mM ThT in PBS, and incubated in the dark for 5 min at 37°C. The fluorescence was recorded at 450 nm excitation and 510 nm emission using Spectra Max plate reader (Molecular Devices). For further biochemical and animal experiments, prepared PFFs were sonicated for 30 s (0.5 s pulse on/off) at 10% amplitude before use (Branson Digital Sonifier). The protein concentrations of the preparations were adjusted before use. Equal amounts of α-syn PFFs and mixed PFFs were used in all the experiments. The size of sonicated fibril was measured by transmission electron microscopy (TEM) to ensure proper sonication.
Transmission electron microscopy and immuno-electron microscopy
Twenty microlitres of fibril samples were dropped onto the copper grid with carbon film and incubated for 3–5 min. The copper grid was stained with 2% phosphotungstic acid for 2 min, dried at room temperature and observed under TEM. For immuno-electron microscopy (immune-EM), the samples were dropped onto the copper grids and washed three times with 50 mM Gly/PBS. The copper grids were blocked in 5% bovine serum albumin (BSA)/PBS solution for 10 min at room temperature. Then the copper grids were incubated with primary antibodies diluted in 1% BSA/PBS solution for 1 h at 4°C and washed three times with 0.1% BSA/PBS. The grids were then incubated with secondary antibodies (1:50 anti-mouse and 1:50 anti-rabbit) conjugated to 4 and 10 nm colloidal gold, respectively, for 1 h at room temperature. After sequential washing four times with 0.5% BSA/PBS, four times with PBS and three times with ultra-pure water, fibrils were negatively stained with 2% phosphotungstic acid for 2 min. The copper grids were air-dried at room temperature and photographed under TEM (Hitachi). Antibodies used: α-syn (1:50, # 180215, ThermoFisher), tau (1:50, # 10274-1-AP, Proteintech).
Proteinase K digestion of α-syn PFFs and mixed PFFs
Protein kinase (PK) digestion was performed as previously described.32 Ten micrograms of α-syn PFFs, tau PFFs and mixed PFFs were mixed with 2.5 μg/ml of PK in PBS and incubated at 37°C for 30 min. The reaction was stopped by adding 1 mM phenylmethylsulfonyl fluoride (PMSF). The samples were boiled in the loading buffer for 10 min. The bands of the PK digestion were detected by Coomassie blue staining.
Cell culture and transduction
HEK293 cells, α-syn-HEK293 cells and SH-SY5Y cells were cultured in Dulbecco’s modified Eagle medium (DMEM) containing 10% foetal bovine serum and penicillin/streptomycin at 37°C under 5% CO2. For transduction, different PFFs (5 μg) were combined with OptiMEM (Gibco) to a final volume of 100 μl. Ninety-six microlitres of OptiMEM and 4 μl of lipofectamine-2000 (Invitrogen) were mixed in another tube and then added to the PFFs tube to a final volume of 200 μl. After incubation for 20 min, the mixture was added to the culture medium. To observe α-syn aggregates, cell cultures were fixed with 4% paraformaldehyde for 15 min at room temperature. Soluble proteins were permeabilized by adding 1% Triton X-100 during fixation. Nuclei were stained with 4′,6-diamidino-2-phenylindole (DAPI; 0.1 µg/ml, # EZ3412B205, Biofroxx).
Cell viability assay
SH-SY5Y cells were seeded into 96-well plates (5000 cells/well), incubated overnight and then treated with PBS or different PFFs for 48 h. Ten microlitres of cell counting kit-8 (CCK-8) reagent (# CK04, Solarbio) were added to each well. The plates were incubated for 4 h at 37 °C in accordance with the CCK-8 kit protocol. Optical density (OD 450 nm) values were measured using a Spectra Max plate reader.
Sedimentation analysis
Sedimentation analysis was conducted as previously described.32 Briefly, the cells were lysed by triturating in PBS containing 0.05% Triton X-100 and protease inhibitor cocktail (# P9599, Sigma) and clarified by 5 min sequential centrifugations at 500g and 1000g. Ten per cent of the lysate was set aside as the total fraction, the rest was centrifuged at 100 000g for 1 h at 4°C. The supernatant was placed aside and the pellet was washed with 1 ml PBS prior to ultracentrifugation at 100 000g for 30 min at 4°C. The supernatant was aspirated and the pellet was resuspended by boiling in RIPA buffer with 4% SDS and 100 mM dithiothreitol (DTT). Pierce BCA Protein Assay Kit (ThermoFisher) was used to normalize the protein concentrations. Samples were run on SDS–polyacrylamide gel electrophoresis (PAGE) gels. The supernatant was loaded at a 3:1 ratio relative to pellet and total fractions. Proteins were transferred onto a nitrocellulose membrane and probed with an anti-α-syn antibody (1:1000, # AHB0261, Invitrogen).
Sequential extraction
Tris-buffered saline (TBS) and SDS-soluble proteins were sequentially extracted from different PFFs-treated α-syn-HEK293 cells as previously described.30 Briefly, cells were mechanically homogenized in 1 ml TBS homogenization buffer (50 mM Tris, 125 mM NaCl, pH 7.4, 5 mM EDTA, 0.02% sodium azide) containing protease inhibitor cocktail, followed by centrifugation at 100 000g for 2 h at 4°C. The supernatant was collected as the TBS-soluble fraction. The pellet was resuspended in TBS homogenization buffer followed by centrifugation at 100 000g for 1 h at 4°C. The supernatant was discarded. The pellet was resuspended in SDS solubilization buffer (TBS homogenization buffer containing 5% SDS), sonicated (2 × 10 s bursts) and centrifuged at 100 000g for 30 min at 25°C. The supernatant was collected as the SDS-soluble fraction. Pierce BCA Protein Assay Kit (Thermo) was used to normalize the protein concentrations. The proteins were detected by western blot using the following antibodies: pS129 (1:1000, # 23706, Cell Signaling Technology), α-syn (1:1000, # AHB0261, Invitrogen) and horse radish peroxidase (HRP)-conjugated glyceraldehyde 3-phosphate dehydrogenase (GAPDH) antibody (1:10 000, # HRP-60004, Proteintech).
Primary neuronal culture
Primary cortical neurons were dissected and cultured as described previously.33 Briefly, cortical neurons were prepared from E18 embryo and cultured in neurobasal media supplemented with B-27, 0.5 mM L-glutamine, penicillin and streptomycin at 37°C in 5% CO2/95% air. α-Syn PFFs and mixed PFFs were added at 7 days in vitro and further incubated for 14 days followed by biochemical experiments.
DiI staining
DiI (1,1'-dioctadecyl-3,3,3',3'-tetramethylindocarbocyanine perchlorate) staining was used to illustrate the dendritic density of neurons. The neurons treated with PFFs were fixed with 4% paraformaldehyde for 15 min and rinsed with PBS. DiI powder (# D-282, Invitrogen) was sprinkled evenly on the slices and let stand for 15 min. Then the DiI was washed away using PBS. Sidles were observed under a confocal laser microscope (Leica).
Sholl analysis
Neuronal dendritic complexity was analysed using Sholl analysis as previously described.34 Images of neurons immunostained with MAP2 antibody (1:500, # 17490-1-AP, Proteintech) were imported into Fiji and traced using the semi-automated plugin Simple Neurite Tracer.35 The nonextended tracing was used to produce a z-projected 8-bit trace image. The estimated geometric centre was marked using the point tool in Fiji and the image was analysed with the Fiji plugins Bitmap Sholl Analysis (http://fiji.sc/Sholl Analysis, version 3.1).
Mitochondrial isolation and complex I enzyme activity assay
Mitochondria were isolated from SH-SY5Y cells using cell mitochondria isolation kit (# C3601, Beyotime). Briefly, the cells were resuspended in the ice-cold isolation buffer containing protease inhibitor cocktail and incubated on ice for 10–15 min. The cell suspension was homogenized and centrifuged at 11 000g for 10 min at 4°C. The resultant supernatant was then centrifuged at 11 000g for 10 min at 4°C. The final pellets were resuspended in 200 μl mitochondria stock solution. Total protein concentration of isolated mitochondria fraction was determined by BCA assay (ThermoFisher). Equivalent mitochondria were incubated with PBS, α-syn PFFs and mixed PFFs for 4 h at 4°C. Mitochondrial respiration complex activity was measured using the complex I enzyme activity microplate assay kit (# ab109721, Abcam). The detergent extract of samples was loaded onto 96-well plates and incubated for 3 h at room temperature. The wells were washed three times with washing buffer. After adding 200 μl of assay solution into each well, the OD (450 nm) was observed in kinetic mode at room temperature for up to 30 min.
Mitochondrial morphologic analysis
SH-SY5Y cells were transfected with Mito-dendra2 plasmid to label the mitochondria. The cells were then transduced with PBS, α-syn PFFs and tau–α-syn mixed PFFs, respectively. Morphologic analysis was conducted 48 h after transduction using a Leica TCS SP8 confocal microscopy. The images were randomized and the prevailing mitochondrial morphology in each cell was classified as tubular, fragmented or intermediate by investigators who are blinded to the group allocation. Cells were classified as having tubular mitochondria when it contains almost entirely mitochondria with length/width (axis) ratios >10, as having fragmented mitochondria when it contains mitochondria with length/width (axis) ratios <3 and as having intermediate mitochondria when it contains both tubular and fragmented mitochondria.
Stereotactic injection
Two-month-old mice were anaesthetized with isoflurane. PBS (5 μl), α-syn PFFs (5 μg) or mixed PFFs (5 μg) was unilaterally injected into the right striatum at a speed of 0.25 μl/min with the following coordinates: anteroposterior (AP) = +0.2 mm, mediolateral (ML) = +2.0 mm, dorsoventral (DV) = +2.8 mm from bregma. After the injection, the needle was maintained for an additional 5 min for complete absorption of the solution. After surgery, animals were monitored and postsurgical care was provided.
Preparation of sarkosyl-insoluble fraction from PFFs-injected mice
Preparation of sarkosyl-insoluble fraction was performed as previously described.36 In brief, the right striatum tissue was homogenized in four volumes of high-salt (HS) buffer (50 mM Tris–HCl pH 7.4, 750 mM NaCl, 10 mM NaF, 5 mM EDTA) with protease and protein phosphatase inhibitors, incubated on ice for 20 min and centrifuged at 100 000g for 30 min. The supernates were discarded. The pellets were re-extracted with four volumes of HS buffer and centrifuged at 100 000 g for 30 min. The pellets were then sequentially extracted with nine volumes of HS buffer 1% Triton X-100-containing HS buffer and 1% Triton X-100-containing HS buffer with 30% sucrose. The pellets were then resuspended and homogenized in nine volumes of HS buffer 1% sarkosyl-containing HS buffer, rotated at 4°C overnight followed by centrifuged at 100 000g for 30 min. The pellets were washed once with nine volumes of HS buffer PBS and resuspended in 0.2 volumes of HS buffer PBS by sonication (Branson Digital Sonifier). The protein concentrations were determined by Bradford assay (Bio-Rad). Ten micrograms of sarkosyl-insoluble fraction from PFFs-injected mice were transduced into α-syn-HEK293 cells seeded in a 12-well plate.
Immunohistochemistry and immunofluorescence
Mice were deeply anaesthetized and sequentially perfused with saline and 4% paraformaldehyde for immunohistochemistry staining. Brain tissues were removed, infiltrated with paraffin and cut into serial 4 µm sections. Sections were deparaffinized in xylene, hydrated through descending ethanol. After being steeped in antigen retrieval solution (80 mM citric acid, 20 mM sodium citrate, pH 6.0) at 94°C for 20 min, the sections were incubated in 3% hydrogen peroxide for 10 min to eliminate endogenous peroxidase activity. Sections were blocked in 3% BSA at room temperature for 30 min. Then the slices were incubated with primary antibodies overnight at 4°C and then rinsed three times in PBS. Signals were developed using the DAB staining kit (# abs957, Absin). For double immunofluorescence staining, a mixture of Alexa Fluor 488- and 594-coupled secondary antibodies (1:500, # W11261, # W11262, ThermoFisher) was applied. After staining in DAPI solution, images were captured using an Olympus DP80 microscope equipped with TH4-200 and U-HGLGPS light sources. The following primary antibodies were used: pS129 (1:500, # MMS-5091, BioLegend), TH (1:1000, # AB152, Millipore), AT8 (1:1000, # MN1020, ThermoFisher), AT100 (1:1000, # MN1060, ThermoFisher), p-tau Ser202 (1:1000, # ab108387, Abcam), MAP2 (1:500, # 17490-1-AP, Proteintech), VAMP2 (1:500, # 10135-1-AP, Proteintech).
Dopaminergic neuron counting
Cell counting was performed using the Olympus DP80 microscope and its matched software cellSens. Each group contains four mice and the entire substantia nigra of each mouse was continuously sliced into 4-μm thick paraffin sections (100–150 sections for each mouse). Every sixth section was involved in the counting procedure (about 20–25 sections for each mouse). Because every six sections determined a volume with a thickness of 24 μm, which is close to the mean diameter of the cell body of dopaminergic neurons, the sum of all involved sections’ cell numbers was considered as the dopaminergic neuronal number of a certain mouse.
Optical densitometry analysis
Striatal TH+ fibre density was measured following the procedure in literature.37 The optical densitometry of the whole striatum was measured using the ImageJ software (version 2.1.0/1.53c). The staining signal was calibrated by subtracting the baseline signal of the cortex.
Behavioural test
The motor function of the mice was monitored by tail suspension test, Rotarod test and pole test. The short-term memory was monitored by Y-maze test. In the tail suspension test, mice were suspended by hanging tails in front of a white background and monitored for at most 2 min. Pictures were taken when they were immobile.38 In the Rotarod test, the mice were trained on the Rotarod apparatus (MED-Associates) for 2 min at a speed of 4 rpm. After the initial training, mice performed four trials for a maximum of 3 min with increasing speed starting from 4 rpm to 25 rpm. The fall-off time was recorded. In the pole test, a metal rod (75 cm long with a 9 mm diameter) wrapped with bandage gauze was used as the pole. The mice were trained for two consecutive days and each training session consisted of three test trials. Mice were placed on the top of the pole. The time to turn and total time to reach the base of the pole was recorded. The end of the test was defined by the placement of all four paws on the base. The maximum cut-off time to stop the test and recording was 60 s. In the Y-maze test, mice were tested for spontaneous alternation behaviour (SPA) in a Y-shaped maze. SPA during a 10-min test period was calculated as the proportion of alternations (an arm choice differing from the previous two choices) to the total number of alternation opportunities (total arm entries).
Statistical analysis
All data were expressed as means ± SEM from three or more independent experiments and illustrated with GraphPad Prism (version 8.0). One-way ANOVA was applied to confirm the significant main effects and differences among three or more groups followed by Tukey’s or least significant difference (LSD) multiple comparisons for post hoc tests. For the time-course studies, the level of significance was determined using the two-way ANOVA and Bonferroni’s multiple comparisons. Kruskal–Wallis and Dunn’s multiple comparisons were used to analyse the ratios among groups. P-values of <0.05 were considered to be statistically significant. The complete statistical values are provided in Supplementary Table 1.
Data availability
No datasets were generated or analysed during the current study. The data that support the findings of this study are available from the corresponding author upon request.
Results
Tau interacts with α-syn in Parkinson’s disease
To investigate the potential interaction between α-syn and tau, we performed immunofluorescent staining of brain slides from the substantia nigra (SN) and cortex of Parkinson’s disease patients. We found that phosphorylated α-syn at serine-129 (pS129) co-localized with phosphorylated tau (AT8; Fig. 1A). Moreover, phosphorylated α-syn co-localized with tau in TgA53T mice, a transgenic mouse model of Parkinson’s disease carrying human A53T α-syn mutation (Fig. 1B). The subcellular co-localization of phosphorylated α-syn and tau was confirmed in Z-stacks using confocal microscopy (Fig. 1C). The level of phosphorylated tau was increased in the brain lysates of Parkinson’s disease patients. Co-immunoprecipitation (Co-IP) revealed that endogenous tau interacts with α-syn (Fig. 1D). The interaction between tau and α-syn was further confirmed by GST pull-down assay (Fig. 1E). A truncation assay revealed that the repeat domain of tau mediates tau–α-syn interaction, while the C-terminal of α-syn is required for the interaction (Fig. 1F and G). The specificity of the GST pull-down assay was confirmed using GST vector (Supplementary Fig. 1A–C). Because α-syn aggregates into fibrils in the Parkinson’s disease brain,8 we investigated whether the aggregation of α-syn affects its interaction with tau. GST-tau was incubated with α-syn monomer and PFFs, respectively. Interestingly, α-syn PFFs were more potent to interact with tau than α-syn monomer (Fig. 1H). Similarly, fibrillar repeat domain of tau recruited more α-syn than its monomeric form (Fig. 1I), indicating the aggregation of tau and α-syn enhance the interaction between them.
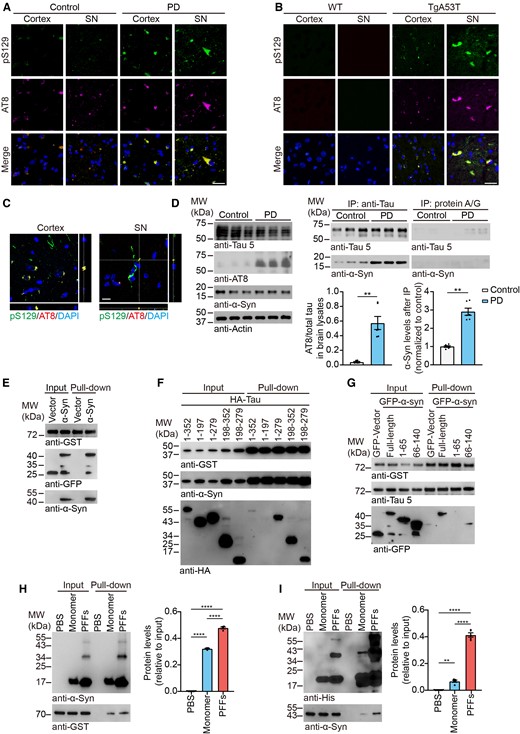
Tau interacts with α-syn. (A and B) Co-localization of pS129 (green) and AT8 (magenta) in the cortex and SN sections of Parkinson’s disease patients (A) and TgA53T mice (B). Scale bar = 20 μm. (C) Representative confocal microscopy images show the co-localization of pS129 (green) and AT8 (magenta) in the cortex and SN sections of TgA53T mice. Scale bar = 10 μm. (D) Co-immunoprecipitation shows the interaction between α-syn and tau in brain samples of Parkinson’s disease patients and control subjects. Right: Quantitation of phosphorylated tau levels in the brain lysates and α-syn levels after immunoprecipitation. (E) GST pull-down assay shows the interaction between tau and α-syn in HEK293 cells co-transfected with GST-tau and GFP-α-syn. (F and G) GST pull-down assay mapped the interaction domain of tau and α-syn. The amino acid number of tau is based on the shortest tau isoform (0N3R, amino acids 1–352). (H) Ni-beads pull-down assay shows that fibrillary His-α-syn binds more GST-tau than monomeric His-α-syn. Right: Quantitation of GST levels after pull-down. (I) Ni-beads pull-down assay shows that fibrillary His-tagged repeat domain of tau binds more GFP-α-syn than monomeric form. Right: Quantitation of α-syn levels after pull-down. Data are presented as mean ± SEM. P-values were determined by Mann–Whitney test (D) or one-way ANOVA followed by Tukey’s multiple comparisons (H and I). *P < 0.05, **P < 0.01, ***P < 0.001, ****P < 0.0001.
Tau promotes α-syn fibrillization into fibrils with distinct properties
To explore the effect of tau on the aggregation of α-syn, we incubated monomeric α-syn in the presence or absence of recombinant tau and monitored the aggregation kinetics using ThT assay. Tau itself did not aggregate under this condition, but strongly accelerated the aggregation of α-syn. However, the tau (1–197) fragment that does not interact with α-syn failed to accelerate the aggregation of α-syn (Fig. 2A). More α-syn oligomers and fibrils were formed within 24 h in the presence of tau as indicated by western blots (Fig. 2B). TEM analysis found that the tau–α-syn mixed fibrils exhibited distinct ultrastructure morphologies when compared with pure α-syn fibrils. Both α-syn fibrils and mixed fibrils appeared as ribbon-like fibrils, but the mixed fibrils tended to twist more compactly. The average length of the mixed fibrils was longer than the pure α-syn fibrils (Fig. 2C). We further immunolabelled the PFFs formed by α-syn and tau with antibodies specific to tau and α-syn. Immuno-EM showed that mixed PFFs contain both tau and α-syn (Fig. 2D). These results suggest that tau induces the conformational change of α-syn fibrils. In the PK digestion analysis, the α-syn PFFs and mixed PFFs showed distinct band patterns. Mixed PFFs were cleaved into two bands, whereas the α-syn PFFs were degraded into smaller fragments (Fig. 2E). Quantification suggested that mixed PFFs were more resistant to PK digestion. Overall, these results indicate that tau promotes the aggregation of α-syn and generates mixed PFFs with distinct biophysical properties.
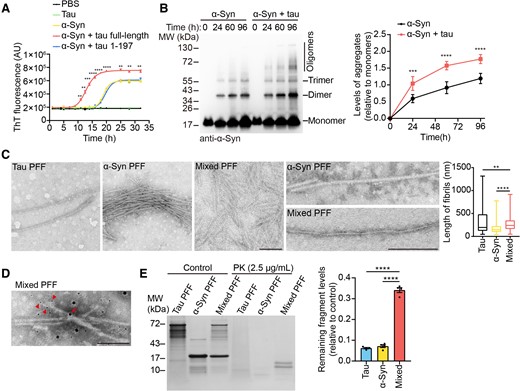
Tau promotes α-syn aggregation to form a new strain. (A) Kinetics of α-syn fibrillization in the presence or absence of 1 mg/ml full-length tau or tau (1–197) fragment in a real-time ThT fluorescence assay. The solution was vibrated at 1000 rpm (n = 5 biologically independent reactions). AU = arbitrary unit. (B) Western blots showed the aggregation kinetics of α-syn. Right: Quantitation of the levels of aggregated α-syn relative to monomeric α-syn. (C) The ultrastructure of tau PFFs, α-syn PFFs and mixed PFFs. Scale bar = 200 nm. Right: Quantitation of the lengths of the fibrils. (D) Immuno-EM of mixed PFFs. Mouse LB509 (4 nm gold) and rabbit tau (10 nm gold) antibodies were used. Arrowheads and arrows indicate the 4- and 10 nm colloidal gold particles, respectively. Scale bar = 100 nm. (E) PK digestion patterns of tau PFFs, α-syn PFFs and mixed PFFs. Right: Quantitation of the levels of remaining protein fragments relative to total proteins. Data are presented as mean ± SEM (A, B and E) or box plot (centre line, median; box limits, upper and lower quartiles; whiskers, min to max) (C). P-values were determined by two-way ANOVA followed by Bonferroni’s multiple comparisons (A and B), Kruskal–Wallis test followed by Dunn’s multiple comparisons (C) or one-way ANOVA followed by Turkey’s multiple comparisons (E). *P < 0.05, **P < 0.01, ***P < 0.001, ****P < 0.0001.
Tau–α-syn mixed PFFs show increased seeding activity than pure α-syn PFFs
To identify the seeding capability of different fibril strains, we added 1/50 (v/v) of sonicated PFFs (1 mg/ml) into 1 mg/ml α-syn monomer and incubated at 37°C with agitation. As the size of sonicated PFFs has been shown to determine the propagation properties, we observed morphologies of sonicated PFFs using TEM. The size of the sonicated α-syn PFFs and tau–α-syn mixed PFFs were similar (Supplementary Fig. 2). ThT assay found that tau–α-syn mixed PFFs were much more efficient than pure α-syn PFFs to seed the aggregation of α-syn (Fig. 3A). However, the seeding activity of α-syn PFFs formed in the presence of tau (1–197) showed no difference compared with pure α-syn PFFs (Fig. 3A). We next transduced the α-syn PFFs or tau–α-syn mixed PFFs into HEK293 cells stably expressing GFP-tagged α-syn (α-syn-HEK293 cells). Forty-eight hours after transduction, more aggregates were formed in cells treated with mixed PFFs compared with the α-syn PFFs-treated group (Fig. 3B). Morphologically, the α-syn PFFs induced the formation of large inclusions, while inclusions induced by mixed PFFs were small granules and uniformly distributed in the cytoplasm (Fig. 3C). Next, we performed sedimentation analysis of the cell lysates to compare the aggregation of α-syn induced by different PFFs. α-Syn could only be detected in the supernatant in the control group and tau PFFs-treated group, while a small proportion of α-syn was found in the pellet fraction in the α-syn PFFs-induced group. Conversely, mixed PFFs induced a large amount of α-syn aggregation in the pellet fraction (Fig. 3D). To further illustrate the solubility of α-syn induced by different strains, we sequentially extracted the cell lysates with 1% Triton X-100 and 2% SDS. Much more Triton X-100-insoluble α-syn with higher molecular weights was observed in the mixed PFFs-treated group than the α-syn PFFs-treated group (Fig. 3E). We further tested the seeding activity of different PFFs in primary cortical neurons cultured from TgA53T mice. Consistent with what we observed in α-syn-HEK293 cells, mixed PFFs were more potent to induce α-syn pathology in primary neurons (Fig. 3F). Collectively, tau enhances the seeding activity of α-syn PFFs in vitro.
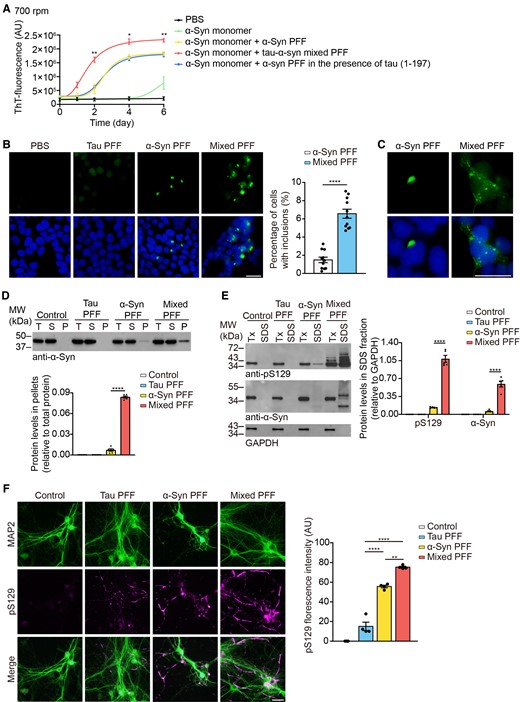
The seeding activity of α-syn PFFs and tau–α-syn mixed PFFs. (A) The kinetics of α-syn fibrillization in the presence of different seeds. The solution was vibrated at 700 rpm (n = 4 biologically independent reactions). AU = arbitrary unit. (B) α-Syn-HEK293 cells were transduced with tau PFFs, α-syn PFFs or tau–α-syn mixed PFFs. Scale bar = 20 μm. Right: Quantitation of the percentage of cells with α-syn inclusions. (C) Magnified pictures show different morphology of the α-syn aggregates. Scale bar = 20 μm. (D) Sedimentation analysis of α-syn-HEK293 cells treated with different PFFs. Pellet (P) was isolated from the supernatant (S) by ultracentrifugation. Below: Quantitation of α-syn levels in the pellet fraction, relative to total protein. (E) α-Syn-HEK293 cells transduced with different PFFs were sequentially extracted with 1% Triton X-100 lysis buffer (Tx) followed by 2% SDS lysis buffer (SDS). Cell lysates from each fraction were immunoblotted with anti-pS129 and α-syn antibodies. Right: Quantitation of the levels of pS129 and total α-syn in the SDS-soluble fraction. (F) Double-labelling immunofluorescence of MAP2 (green) and pS129 (magenta) was conducted on primary cortical neurons exposed to different PFFs. Scale bar = 20 μm. Right: Quantitation of pS129 fluorescence intensity. Data are presented as mean ± SEM. P-values were determined by two-way ANOVA followed by Bonferroni’s multiple comparisons (A), Mann–Whitney test (B) or one-way ANOVA followed by Tukey’s multiple comparisons (D–F). *P < 0.05, **P < 0.01, ***P < 0.001, ****P < 0.0001.
Tau–α-syn mixed PFFs leads to mitochondrial dysfunction and synaptic degeneration
Mitochondria dysfunction plays a central role in the pathogenesis of Parkinson’s disease.39,40 We further tested the effect of mixed PFFs on the function of mitochondria. Immunofluorescence staining found that mixed PFFs induced the decrease of the mitochondrial marker Cox IV compared with α-syn PFFs in α-syn-HEK293 cells (Fig. 4A). This result was confirmed by western blot analysis (Fig. 4B). In addition, the cells exposed to mixed PFFs exhibited a significant decrease in the level of Bcl-2 and an increase in the level of Bax compared to the control and α-syn PFFs-treated groups (Fig. 4B). We then assessed the enzymatic activity of mitochondrial complex I in SH-SY5Y cells treated with different PFFs. Both PFFs decreased the activity of complex I, but the detrimental effect of the mixed PFFs was much stronger than the α-syn PFFs (Fig. 4C). Morphological analysis found that most of the mitochondria in SH-SY5Y cells appeared to be tubular in the control group, while 29.2% and 78.6% of the mitochondria were fragmented after exposure to α-syn PFFs and mixed PFFs, respectively (Fig. 4D). These results indicate that mixed PFFs induce more severe mitochondrial dysfunction.
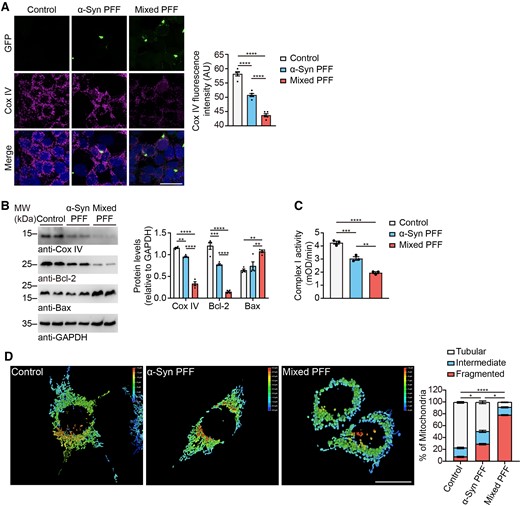
Mixed PFFs induce mitochondrial dysfunction. (A) Representative confocal microscopy images show immunostaining of Cox IV (magenta) and α-syn aggregates (green) in α-syn-HEK293 cells treated with different PFFs. Scale bar = 20 μm. Right: Quantitation of Cox IV fluorescence intensity. (B) Representative western blots immunostained for Cox IV, Bcl-2 and Bax of α-syn-HEK293 cell lysates treated with different PFFs. Right: Quantitation of Cox IV, Bcl-2 and Bax. Values are normalized to GAPDH. (C) Complex I enzyme activity of PFFs-treated mitochondria from SH-SY5Y cells. (D) Representative confocal microscopy images showing the morphology of mitochondria in SH-SY5Y cells treated with different PFFs. Right: Quantification of mitochondrial morphologies. The percentage of cells with different mitochondria was quantified. Data are presented as mean ± SEM. P-values were determined by one-way ANOVA followed by Tukey’s multiple comparisons (A–C) and Kruskal–Wallis test followed by Dunn’s multiple comparisons (D). *P < 0.05, **P < 0.01, ***P < 0.001, ****P < 0.0001.
Synaptic dysfunction is observed at the early stages of Parkinson’s disease.41 We further tested the effect of tau–α-syn mixed PFFs and pure α-syn PFFs on synapses after adding them to primary neuronal cultures from wild-type mice. Immunofluorescence analysis found that mixed PFFs dramatically reduced the levels of vesicle-associated membrane protein 2 (VAMP2), a protein involved in vesicle fusion,42 and synapsin I, which regulates neurotransmitter release43 (Fig. 5A–C). The decrease of VAMP2 and synapsin I induced by mixed PFFs was confirmed by western blot (Fig. 5D). We further assessed the density of dendritic spines along individual dendrites of cortical neurons using DiI staining. The density of dendritic spines was decreased in mixed PFFs-treated neurons (Fig. 5E). Sholl analysis revealed that mixed PFFs reduced dendritic complexity in neurons when compared to vehicle- and α-syn PFFs-treated groups (Fig. 5F). Furthermore, we tested the neurotoxic effects of different fibrils. Neuronal apoptosis was tested by terminal-deoxynucleoitidyl transferase-mediated nick end labelling (TUNEL) staining. Both α-syn PFFs and mixed PFFs induced neuronal apoptosis, while the mixed PFFs showed much stronger neurotoxicity (Fig. 5G). Similar results were confirmed in SH-SY5Y cells (Fig. 5H). These results indicate that tau-modified α-syn PFFs are more toxic to mitochondria and synapses compared with pure α-syn PFFs.
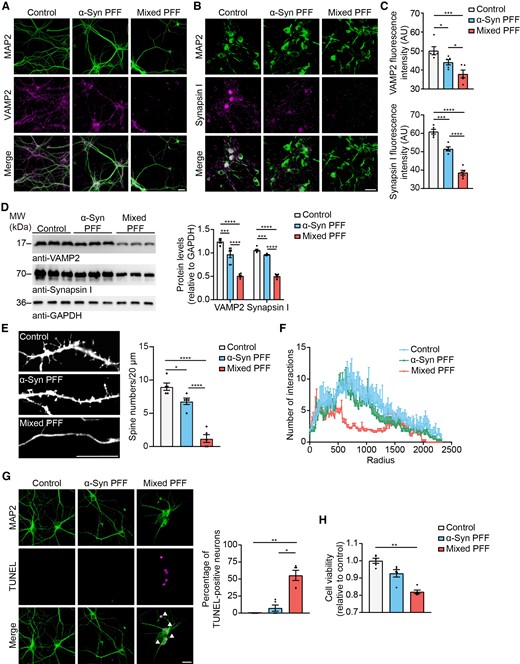
Mixed PFFs cause synaptic dysfunction. (A) Double-labelling immunofluorescence of MAP2 (green) and VAMP2 (magenta) in wild-type (WT) primary cortical neurons treated with different PFFs. Scale bar = 20 μm. (B) Double-labelling immunofluorescence of MAP2 (green) and synapsin I (magenta) in wild-type primary cortical neurons treated with different PFFs. Scale bar = 20 μm. (C) Quantitation of VAMP2 fluorescence intensity and synapsin I fluorescence intensity. (D) Representative western blots immunostained for VAMP2 and synapsin I. Right: Quantitation of VAMP2 and synapsin I. Values are normalized to GAPDH control. (E) Representative DiI staining shows decreased spine density in wild-type neurons treated with mixed PFFs. Scale bar = 10 μm. Right: Quantitation of the density of spines (n = 5). (F) Sholl analysis showing the length and branching of apical and basal dendrites in wild-type neurons treated with different PFFs (n = 4–5). (G) Double-labelling immunofluorescence of MAP2 (green) and TUNEL (magenta) in wild-type primary cortical neurons treated with different PFFs. Scale bar = 50 μm. Right: Quantitation of the percentage of TUNEL-positive neurons. (H) CCK8 assay showing the cell viability of SH-SY5Y cells exposed to different PFFs. Data are presented as mean ± SEM. P-values were determined by one-way ANOVA followed by LSD multiple comparisons (C–F) and Kruskal–Wallis test followed by Dunn’s multiple comparisons (G and H). *P < 0.05, **P < 0.01, ***P < 0.001, ****P < 0.0001.
Tau–α-syn mixed PFFs show enhanced seeding activity and neurotoxicity in vivo
To determine whether the tau–α-syn mixed PFFs exhibit enhanced neurotoxicity in vivo, we injected α-syn PFFs and tau–α-syn mixed PFFs, respectively, into the striatum of wild-type mice. Consistent with the previous report,44 injection of α-syn PFFs induced the aggregation of endogenous α-syn in a time-dependent manner. α-Syn pathology was more severe in mixed PFFs-treated mice than that in mice injected with pure α-syn PFFs at 3 and 6 months postinjection (mpi; Fig. 6A). The heatmap of α-syn pathology at 1, 3 and 6 mpi shows that the mixed PFFs induced more rapid propagation of α-syn pathology compared with the α-syn PFFs (Fig. 6B). At 3 mpi, α-syn pathology spread to the contralateral striatum, amygdala and corpus callosum (CC) in mixed PFFs-inoculated mice but not in α-syn PFFs-injected mice (Supplementary Fig. 3A). These findings suggest that mixed PFFs are more prone to seed the endogenous α-syn in vivo.
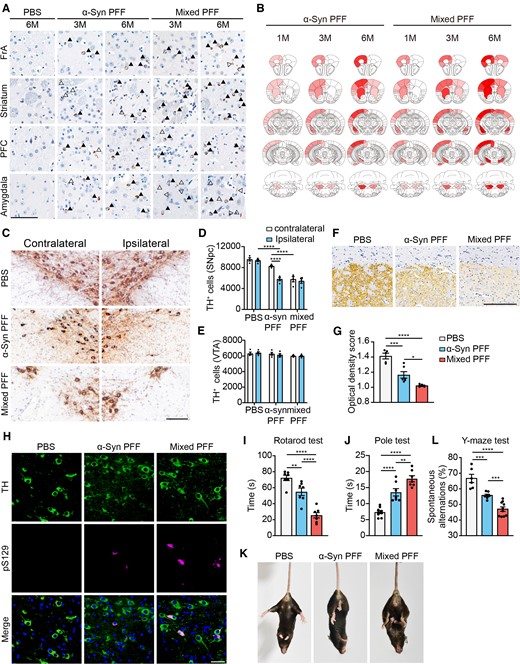
Tau–α-syn mixed PFFs show enhanced seeding activity in vivo. (A) Representative images of α-syn pathology in mice injected with either α-syn PFFs or mixed PFFs at 3 and 6 mpi. Arrowheads indicate Lewy bodies and open arrowheads indicate Lewy neuritis revealed by immunostaining with anti-pS129 antibody. Scale bar = 20 μm. (B) Heat maps of semiquantitative pS129-pathological scores across regions in mice injected with α-syn PFFs and mixed PFFs. The increase in α-syn pathology is reflected by the colour change from white to red (n = 7–10 mice per group). (C) Representative TH staining of SN dopaminergic neurons in wild-type mice injected with different PFFs at 6 mpi. Scale bar = 20 μm. (D and E) Dopaminergic neuron counting in contralateral and ipsilateral SNpc (D) and ventral tegmental area (VTA) (E). (F) Representative immunostaining of TH in the ipsilateral striatum. Scale bar = 200 μm. (G) Quantitation of the average optical densities of dopaminergic terminals. (H) Double-labelling immunofluorescence of TH (green) and pS129 (magenta) of SN dopaminergic neurons in brain slices of mice injected with different PFFs at 6 mpi. Scale bar = 20 μm. (I and J) Rotarod test results (I) and pole test (J) were performed 6 mpi in mice injected with different PFFs. (K) Representative images of tail suspension test presenting clasping arms and legs of the mice injected with different PFFs. (L) Y-maze test showing impaired short-term memory in mice injected with mixed PFFs. Data are presented as mean ± SEM. P-values were determined by two-way ANOVA followed by LSD multiple comparisons (D and E) and one-way ANOVA followed by LSD multiple comparisons (G, I, J and L). *P < 0.05, **P < 0.01, ***P < 0.001, ****P < 0.0001.
α-Syn PFFs inoculation into the striatum leads to the loss of dopaminergic neurons in the SNpc.44 We thus investigated the effect of different PFFs on the degeneration of the nigrostriatal dopaminergic pathway. Mixed PFFs induced significant loss of tyrosine hydroxylase (TH)-positive dopaminergic neurons not only in the ipsilateral but also the contralateral SNpc at 6 mpi (Fig. 6C and D). Besides, the dopaminergic neurons in the ventral tegmental area (VTA) remain largely intact (Fig. 6E). Similarly, mixed PFFs induced obvious loss of striatal dopaminergic terminals. However, the detrimental effect of pure α-syn PFFs was not as severe as mixed PFFs (Fig. 6F and G). More abundant α-syn deposits in TH-positive dopaminergic neurons were observed in mixed PFFs-inoculated mice than in α-syn PFFs-inoculated mice at 6 mpi (Fig. 6H). To investigate the effect of mixed PFFs on motor function, we performed Rotarod test, pole test and tail suspension test. Mixed PFFs lead to worse performance in both the Rotarod test and the pole test at 6 mpi when compared with the pure α-syn PFFs (Fig. 6I and J). In the tail suspension test, mice injected with mixed PFFs showed clasping legs rather than spreading out to both sides of their bodies (Fig. 6K). Cognitive impairment is one of the nonmotor symptoms in Parkinson’s disease.45,46 To determine the effects of mixed PFFs on cognitive performance, we conducted Y-maze test and calculated SPA, an indicator of working memory.47 Mice injected with mixed PFFs showed less SPA than the control mice and the α-syn PFFs-injected mice (Fig. 6L). The total distance and mean speed in the Y-maze test showed no significant difference among different groups (Supplementary Fig. 3B). This is accompanied by the presence of hyperphosphorylated tau, as labelled by AT100, in the cortex of mixed PFFs-inoculated mice (Supplementary Fig. 3C). To investigate whether the pathological α-syn aggregates maintain their seeding activity in the brain, we extracted the sarkosyl-insoluble fractions from mouse brains injected with α-syn PFFs and mixed PFFs, respectively, and examined their seeding activity in α-syn-HEK293 cells. Interestingly, insoluble α-syn species from mixed PFF-injected brains showed enhanced seeding activity than that from α-syn PFF-injected brains (Supplementary Fig. 3D). These results suggest that mixed PFFs are more potent to seed the endogenous α-syn and induce more severe motor symptoms and cognitive impairment compared with pure α-syn PFFs.
Knockout of tau alleviates the spreading of α-syn pathology in vivo
Because tau facilitates α-syn aggregation and enhances its seeding activity, we further investigated whether knockout of tau alleviates α-syn pathology. α-Syn PFFs were transduced into primary neurons separated from wild-type mice, tau knockout (−/−) mice and tau P301S mice, respectively. We found that deletion of tau alleviated α-syn phosphorylation induced by exogenous α-syn PFFs. Conversely, overexpression of tau increased α-syn phosphorylation when compared with wild-type neurons (Supplementary Fig. 4). To confirm the role of tau in the spreading of α-syn pathology in vivo, we injected α-syn PFFs into the striatum of wild-type and tau−/− mice, respectively. α-Syn pathology was observed in the ipsilateral frontal association cortex (FrA), striatum, and prefrontal cortex (PFC) in wild-type mice as early as 1 mpi. While rare, α-syn pS129-positive cells were observed in the age-matched tau−/− mice. By 3 and 6 mpi, α-syn pathology was observed in striatum-projected brain regions in wild-type mice, including PFC, FrA and amygdala. The intensity of α-syn pS129 signals of all assessed areas was attenuated in the tau−/− mouse brains compared with wild-type mouse brains (Fig. 7A). Age-matched PBS-injected tau−/− mice and wild-type mice showed no α-syn pS129 signals in the striatum, FrA, PFC and amygdala, supporting the specificity of the toxic effect of α-syn PFFs (Supplementary Fig. 5).
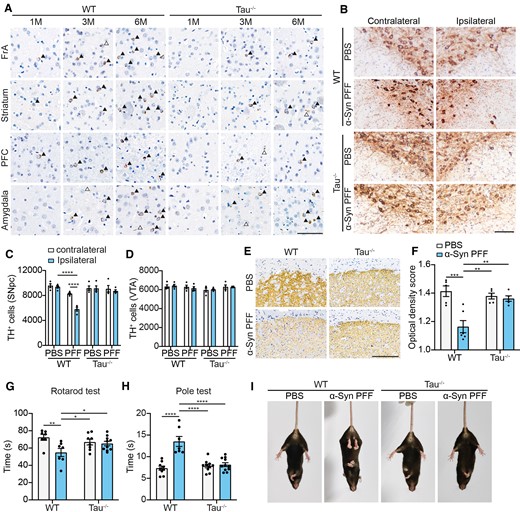
Deletion of tau attenuates the propagation of α-syn pathology in vivo. (A) Representative images of α-syn pathology in wild-type (WT) and tau−/− mice injected with α-syn PFFs at 1, 3 and 6 mpi. Arrowheads indicate Lewy bodies and open arrowheads indicate Lewy neuritis revealed by immunostaining with pS129 antibody. Scale bar = 20 μm (n = 5–10 mice per group). (B) Representative TH staining of SN dopaminergic neurons in wild-type and Tau−/− mice 6 mpi. Scale bar = 20 μm. (C and D) Dopaminergic neuron counting in contralateral and ipsilateral SNpc (C) and VTA (D). (E) Representative TH staining of the ipsilateral striatum. Scale bar = 200 μm. (F) Quantitation of the average optical densities of dopaminergic terminals. (G and H) Rotarod test (G) and pole test (H) were performed 6 mpi in wild-type mice and tau−/− mice. (I) Representative images of tail suspension test presenting clasping arms and legs of wild-type mice and tau−/− mice 6 mpi. Data are presented as mean ± SEM. P-values were determined by two-way ANOVA followed by LSD multiple comparisons. *P < 0.05, **P < 0.01, ***P 0.001, ****P < 0.0001.
Inoculation of α-syn PFFs induced loss of dopaminergic neurons in the SNpc 6 mpi in wild-type mice. Ablation of tau alleviated the detrimental effects of α-syn PFFs (Fig. 7B–D). The density of dopaminergic terminals in the striatum was remarkably decreased in wild-type mice compared with tau−/− mice at 6 mpi (Fig. 7E and F). The Rotarod test and pole test found that α-syn PFFs induced significant motor dysfunction in wild-type mice, but not in the tau−/− mice (Fig. 7G and H). In the tail suspension test, wild-type mice injected with α-syn PFFs showed clasping legs. However, α-syn PFFs failed to induce clasping legs in tau−/− mice (Fig. 7I). Thus, the deletion of tau mitigates the propagation of α-syn pathology both in vitro and in vivo.
Knockout of tau ameliorates the pathologies in TgA53T mice
To further confirm the role of tau in Parkinson’s disease pathology, we deleted endogenous tau in TgA53T mice (TgA53TTau−/−) by crossing the TgA53T mice with tau−/− mice. Immunohistochemistry and western blot confirmed the deletion of tau in TgA53TTau−/− mice (Fig. 8A and B). We quantify the extent of α-syn pathology in TgA53TTau+/+ and TgA53TTau−/− mice at 10 months of age by staining the brain sections with the anti-pS129 antibody. We found reduced α-syn pathology in the olfactory bulb (OB), hippocampus (Hippo), PFC, amygdala, locus coeruleus (LC) and SN regions of TgA53TTau−/− mice, when compared with the TgA53TTau+/+ mice (Fig. 8C). Reduced α-syn phosphorylation in TgA53TTau−/− mice was also confirmed by western blot using whole-brain lysate (Fig. 8D and E). The number of dopaminergic neurons in the SNpc was decreased in TgA53TTau+/+ mice compared with TgA53TTau−/− mice (Fig. 8F–H). The striatal dopaminergic terminals were also decreased in the TgA53TTau+/+ mice compared with the TgA53TTau−/− mice (Fig. 8I and J). Western blot analysis of the expression of TH and dopamine transporter (DAT) in the striatum from TgA53TTau+/+ and TgA53TTau−/− mice showed consistent results (Fig. 8K). In the behavioural test, the TgA53TTau−/− mice showed better performance in the Rotarod test, pole test and tail suspension test when compared with the TgA53TTau+/+ mice (Fig. 8L and M). These results indicate that deletion of endogenous tau alleviates Parkinson’s disease-like pathology and motor symptoms of TgA53T mice.
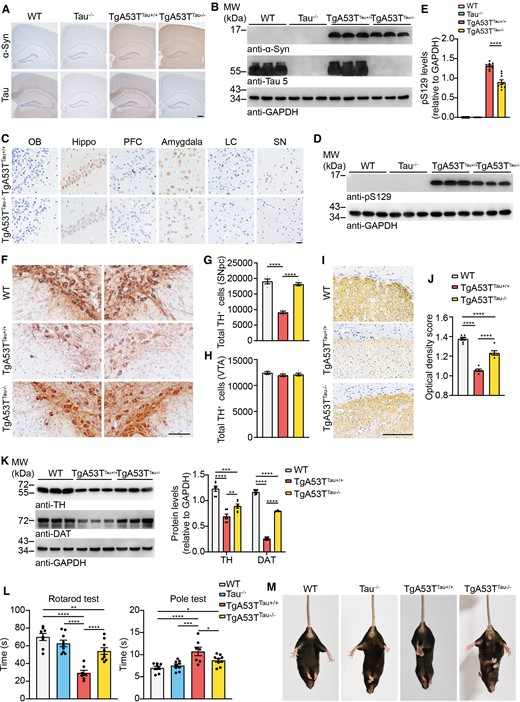
Deletion of tau ameliorates α-syn pathology in TgA53T mouse. (A) Representative immunohistochemistry images showing the expression of α-syn and tau in TgA53TTau+/+ and TgA53TTau−/− mice. Scale bar = 200 μm (n = 5–9 mice per group). (B) Western blot showing the level of α-syn and tau in wild-type (WT), tau−/−, TgA53TTau+/+ and TgA53TTau−/− mice. (C) Immunohistochemistry showing α-syn pathology in TgA53TTau+/+ and TgA53TTau−/− mice by using anti-pS129 antibody. Scale bar = 20 μm. (D) Western blot showing the levels of pS129 in TgA53TTau−/− mice and TgA53TTau+/+ littermates. (E) Quantitation of the levels of pS129. (F) Representative TH staining of SN dopaminergic neurons in wild-type, TgA53TTau+/+ and TgA53TTau−/− mice. (G and H) Dopaminergic neuron counting of total TH+ cells in SNpc (G) and VTA (H). Scale bar = 20 μm. (I) TH immunostaining of the striatum. Scale bar = 200 μm. (J) Quantitation of the optical density of dopaminergic terminals in the striatum. (K) Western blots showing the levels of TH and DAT in the striatum of TgA53TTau+/+ and TgA53TTau−/− mice. Right: Quantitation of the protein levels of TH and DAT. (L) Rotarod test and pole test were performed in wild-type, Tau−/−, TgA53TTau+/+ and TgA53TTau−/− mice. (M) Representative images of tail suspension test showing clasping arms and legs of wild-type, Tau−/−, TgA53TTau+/+ and TgA53TTau−/− mice. Data are presented as mean ± SEM. P-values were determined by one-way ANOVA followed by LSD multiple comparisons. *P < 0.05, **P < 0.01, ***P < 0.001, ****P < 0.0001.
Discussion
In the present study, we demonstrated that tau interacts with α-syn and promotes its aggregation. The tau–α-syn mixed PFFs show unique pathological properties such as enhanced seeding activity and neurotoxicity. These findings fit with the epidemiological evidence that mutation of the MAPT gene is a risk factor for Parkinson’s disease.19–22,48 Notably, we found that tau–α-syn mixed PFFs induced pathological and behavioural impairments when injected into the mouse brain. Knockout of tau attenuated α-syn spreading and propagation both in mice injected with α-syn PFFs and in TgA53T mice. Considering that tau co-aggregates with α-syn in the brain of Parkinson’s disease patients, tau may act as a stimulating factor of α-syn pathology in Parkinson’s disease.
Parkinson’s disease is characterized by the deposition and stereotyped propagation of α-syn pathology in the central nervous system.8,49 Tau pathology is commonly found in the brain of Parkinson’s disease patients,50–52 suggesting that the cross-seeding between tau and α-syn might disrupt the protein homeostasis and promote the progression of Parkinson’s disease. In our study, deletion of tau alleviated the pathology initiated by α-syn PFFs both in vitro and in vivo. Our results are consistent with the previous reports that tau contributes to α-syn pathology,53,54 while some other studies found that α-syn pathology was not significantly affected when tau was knocked out.55–58 Several factors may contribute to the discrepancy between our study and the others. First, we used the M83 transgenic mice and wild-type mice that received striatal injection of α-syn PFFs as models of parkinsonism, while some studies injected neurotoxins such as 1-methyl-4-phenyl-1,2,3,6-tetrahydropyridine (MPTP) and 6-hydroxydopamine (6-OHDA).55,57 Second, we used an established tau knockout mice strain, while Stoyka et al.56 used tauflox/flox mice containing loxP sites flanking exon1 to knockout endogenous tau. Other factors such as different α-syn fibrils, processing duration and injection sites may also contribute to the discrepancies.55,58 It is worth noting that we found more severe degeneration of dopaminergic neurons in the TgA53T mice than in the previous reports.59–61 As described above, we crossed the M83 mice on a C3 background with tau knockout mice on a 129X1 background to delete endogenous tau from the M83 mice. The different background of mice in our study may contribute to the difference in the degree of dopaminergic degeneration. Under physiological conditions, tau and α-syn have distinct subcellular distribution. Tau is a cellular skeleton-associated protein, while α-syn is mainly located at the presynaptic endings.5,62 It has been reported that impaired protein degradation induces tau missorting in the dendrites.63 The pathological interaction between tau and α-syn may facilitate aberrant dislocation of each other and disturb their physiological functions.
Increasing evidence indicates that Parkinson’s disease is a heterogeneous neurodegenerative disorder that can be classified into several subtypes based on their different clinical and pathological progression patterns.24 However, the molecular mechanisms underlying the heterogeneity of Parkinson’s disease remain unclear. It has been reported that the presence of co-pathology of tau and α-syn in Parkinson’s disease brains is accompanied by overlapping clinical symptoms and indicates a worse prognosis.64,65 This is in agreement with our observation that the tau–α-syn mixed PFFs were more prone to seed soluble α-syn and propagate through the brain. Some previous studies have shown that tau and α-syn can bind to each other and promote mutual aggregation, which is consistent with our data.27,53 Thus, the interaction between tau and α-syn may contribute to the pathological and clinical heterogeneity of Parkinson’s disease patients. Several studies reported distinct α-syn strains in Parkinson’s disease, dementia with Lewy bodies and multiple system atrophy.11–13,36,66–71 Thus, we hypothesize that the interaction between tau and α-syn promotes the formation of a strain with distinct biochemical and pathological properties. In our study, we found that mixed PFFs formed by tau and α-syn have a distinct conformation as revealed by electron microscopy and PK digestion. This conclusion is in agreement with the previous report that tau monomers promote the formation of α-syn fibril with a distinct morphology.72 Furthermore, α-syn oligomers can induce the formation of a unique tau strain. These results support the hypothesis that cross-seeding of tau and α-syn forms new strains.73 Williams et al.74 reported that tau–α-syn copolymer fibrils displayed enhanced seeding properties in tauopathies but not in synucleinopathies. They used the repeat domain of tau (K18) instead of full-length tau to generate the mixed fibrils, which may be different from our mixed fibrils. In our study, mixed PFFs are more potent to seed endogenous α-syn and cause mitochondrial dysfunction and synaptic impairment. Furthermore, the mixed PFFs decreased the levels of Bcl-2, which inhibits mitophagy by blocking the translocation of Parkin to depolarized mitochondria, and increased the levels of Bax, which destabilizes the mitochondrial membrane and increases mitophagy.75,76 The imbalance between Bcl-2 and Bax may contribute to mitochondrial dysfunction and neurodegeneration induced by mixed PFFs. Notably, the insoluble α-syn species from mouse brains injected with tau–α-syn mixed PFFs maintained higher seeding activity upon passage back into α-syn-HEK293 cells.
Another common nonmotor symptom of Parkinson’s disease is cognitive impairment, affecting more than 30% of Parkinson’s disease patients.77 It has been reported that limbic and neocortical α-syn pathology had the strongest association with dementia, while the PFC was more affected by tau pathology.17 In this study, mixed PFFs-inoculated mice were suffered from cognitive impairment. To identify the pathological basics of cognitive impairment, we assessed tau and α-syn pathologies in the brain, and found that cognition-associated brain regions, such as the amygdala, a part of the limbic system, and PFC were affected by α-syn and tau pathologies, respectively. This is in agreement with the most recent report that tau contributes to memory deficits in a transgenic mouse model of synucleinopathy.78 It is worth noting that only the AT100 antibody, which recognizes tau phosphorylated at Thr212 and Ser214, shows positive signals. The AT8 (Ser202 and Thr205) and p-tau Ser202 antibodies failed to detect positive signals in mixed PFFs-inoculated mice. These results are in agreement with the previous report that AT8 signal was not detected in wild-type mice injected with tau fibrils.79 Interestingly, AT100-positive pathology is one of the early signs of tau pathology in Alzheimer’s disease, while AT8 pathology appears later during the progression of the disease.80 Thus, our results suggest that the tau–α-syn mixed fibrils induce subtle tau pathology that does not spread in the wild-type mice brain. Furthermore, mixed PFFs induced more severe synaptic degeneration in cultured neurons compared with pure α-syn PFFs, which may also contribute to cognitive impairment. Therefore, the mixed PFFs promote Parkinson’s disease-like pathological development via multiple mechanisms.
In the current study, we used human α-syn PFFs to induce the aggregation of α-syn in vivo. Some studies found that human α-syn PFFs were not as potent as mouse α-syn PFFs to induce α-syn pathology in wild-type mouse brain.81 We chose to use human α-syn and tau because our in vitro data showed that human tau interacts with human α-syn and promotes its aggregation. Our results are consistent with the previous reports that human α-syn PFFs induce α-syn pathology in wild-type mice.81–83 Conceivably, injection of PFFs generated from mouse α-syn and tau will provide more information to compare α-syn pathology caused by different PFFs in vivo.
In conclusion, we found that tau binds α-syn to form a new strain, which is more potent to induce the prion-like spreading of endogenous α-syn, causing mitochondrial dysfunction, synaptic impairment and the progression of Parkinson’s disease. Given that deletion of tau attenuates the spreading of α-syn pathology, strategies aimed at disrupting the interaction between tau and α-syn hold promise as a disease-modifying therapy to halt the progression of Parkinson’s disease.
Funding
This work was supported by grants from the National Key Research and Development Program of China (2019YFE0115900) to Z.Z, and the National Natural Science Foundation of China (No. 81771382 and 81822016 to Z. Z., No. 81901090 to L.M. and No. 81901291 to M.H.) and the Medical Science Advancement Program of Wuhan University (No. TFLC2018001).
Competing interests
The authors report no competing interests.
Supplementary material
Supplementary material is available at Brain online.
References
Abbreviations
- α-syn
α-synuclein
- GST
glutathione-S-transferase
- PFC
prefrontal cortex
- PFFs
preformed fibrils
- PK
protein kinase
- SN=
substantia nigra
- SNpc
substantia nigra pars compacta
Author notes
Lina Pan and Chunrui Li contributed equally to this work.

