


Abstract
The subthalamic nucleus and internal pallidum are main target sites for deep brain stimulation in Parkinson’s disease. Multiple trials that investigated subthalamic versus pallidal stimulation were unable to settle on a definitive optimal target between the two. One reason could be that the effect is mediated via a common functional network.
To test this hypothesis, we calculated connectivity profiles seeding from deep brain stimulation electrodes in 94 patients that underwent subthalamic and 28 patients with pallidal treatment based on a normative connectome atlas calculated from 1000 healthy subjects. In each cohort, we calculated connectivity profiles that were associated with optimal clinical improvements.
The two maps showed striking similarity and were able to cross-predict outcomes in the respective other cohort (R = 0.37 at P < 0.001; R = 0.34 at P = 0.032). Next, we calculated an agreement map, which retained regions common to both target sites. Crucially, this map was able to explain an additional amount of variance in clinical improvements of either cohort when compared to the maps calculated on each cohort alone. Finally, we tested profiles and predictive utility of connectivity maps calculated from different motor symptom subscores with a specific focus on bradykinesia and rigidity.
While our study is based on retrospective data and indirect connectivity metrics, it may deliver empirical data to support the hypothesis of a largely overlapping network associated with effective deep brain stimulation in Parkinson’s disease irrespective of the specific target.
Introduction
Deep brain stimulation (DBS) is an effective treatment option in patients suffering from Parkinson’s disease and two surgical target structures have been established to be most effective.1,2 The subthalamic nucleus (STN) and the internal pallidum (GPi) have been reported to result in comparable improvements of motor symptoms in prospective double-blinded trials.3,4
A recent study has investigated optimal connectivity profiles for treatment of Parkinson’s disease based on STN-DBS.5 The study investigated network profiles of active stimulation sites and their relationships to clinical improvements as measured by the motor part of the Unified Parkinson’s Disease Rating Scale (UPDRS-III). Applying normative connectome data to brain stimulation sites in 95 patients from two centres, the study concluded that effective STN-DBS electrodes would modulate a region within the STN that was functionally connected to large portions of the prefrontal cortex, including supplementary motor area (SMA) and inferior frontal cortex and functionally anticorrelated with primary motor cortex (M1). Similar studies accumulated evidence that neuromodulation of a specific network may result in clinical responses specific to a certain symptom (for a review see Horn and Fox6). Following this concept of ‘circuitopathies’—networks with impact on specific symptoms or behaviours—it might be possible to modulate the same network at different stimulation sites to reach similar changes in clinical or behavioural outcomes.7,8 As mentioned above, since the 2000s, attempts including large randomized clinical trials have been carried out with the aim of establishing a gold standard—either targeting STN or GPi to treat Parkinson’s disease. However, most clinical studies reached the conclusion that neither of the two can be disregarded as a potential target.3,4,9,10 This does not imply that modulating either target would lead to identical effects. For instance, while STN-DBS has led to greater amounts of L-DOPA reduction, GPi-DBS was associated with a lower rate of neuropsychiatric side effects.11 Still, a natural hypothesis could be that both STN- and GPi-DBS might modulate an ‘overlapping’ functional network in patients with Parkinson’s disease. Needless to say, in part, we already know this is the case for the STN and GPi. Both nuclei are crucial integrator hubs in the subcortex and direct interactions between the well-studied indirect and hyperdirect pathways have been established.12 We have known at least since the seminal work of Oskar and Cecile Vogt in the 1920s that GPi and STN are tightly interlinked, forming part of what they referred to as the ‘striatal system’.13 Both nuclei play crucial parts to integrate information within the motor control and action-selection system supported by the basal ganglia.14 However, it remains unclear whether effective STN and GPi-DBS would engage with a shared functional whole-brain network in order to maximize effects. For instance, both STN and GPi receive (direct and/or indirect) input from most areas within the frontal cortex. Via the thalamus, they project back to large cortical regions, as well. Exactly which of these many connections would be associated with maximal DBS effects on motor symptoms, and whether the networks involved with the two basal ganglia nuclei are shared or segregated, remains unknown.
Here, we use the aforementioned network calculated from a multi-centre cohort of 95 STN-DBS patients to cross-predict clinical improvements in a cohort of 28 patients that underwent GPi-DBS.3,5 In a next step, we calculate an optimal treatment network from the GPi-DBS cohort and use it to cross-predict outcomes in the original STN-DBS cohort. We compare optimal network profiles of both cohorts and describe commonalities and differences of both maps. Specifically, this is done by ways of a novel method to identify the agreement network between both cohorts. In this way, we are able to identify regions that are predictive for positive clinical outcome in both cohorts.
Materials and methods
Patients and cohorts
In this study, patients with Parkinson’s disease who underwent DBS were retrospectively enrolled. In addition to data from a previously published study (95 STN patients stimulated in two German centres5; Berlin and Würzburg), a second cohort of 28 patients that underwent GPi-DBS surgery (subcohort of patients operated at the Amsterdam Medical Center enrolled in a prior clinical study) was included.3 For one of the 95 STN patients, subscore improvement scores were not available, the patient was excluded. Hence, this study is based on (i) published results (STN target)5 that were used to plan cross-predictions in a (ii) second cohort operated with a different target (GPi target). We based our apriori calculation on the published results, which included an average out-of-sample correlation of network models of R ∼ 0.4 (medium effect size corresponding to Cohen’s d of 0.873). Underlying a desired power of 70%, we aimed for an n of ≥28 in the GPi cohort, which was available within the NSTAPS trial cohort. As is standard in most centres, no patients were enrolled that had significant neuropsychiatric, affective or cognitive side effects at baseline (preoperatively).
All patients received brain imaging before and after surgery in the form of preoperative MRI and postoperative CT or MRI scans (see Table 1 for imaging choice and basic patient demographics). Both target groups where clinically evaluated before (preoperative medication OFF scores) and >12 months after surgery, under active stimulation, using the motor features of the UPDRS-III (motor UPDRS), after withdrawal from dopaminergic treatment for >12 h (med OFF). The original UPDRS-III scores were used in the Berlin and Amsterdam cohorts while the MDS version was used to assess the Würzburg cohort.
Patient demographics
| Cohort | ||
|---|---|---|
| GPi Odekerken et al.3 | STN Horn et al.5 | |
| Age, years | 60 (±6) | 60 (±8) |
| n (female) | 28 (10) | 94 (29) |
| UPDRS-III baseline OFF | 43 (±14) | 43 (±14) |
| UPDRS-III ON | 34 (±13) | 22 (±10) |
| Improvement, % | 13 (±43) | 47 (±23) |
| Improvement absolute | 9 (±17) | 21 (±13) |
| LEDD baseline | 1325 | 1241 |
| LEDD ON | 1091 | 522 |
| LEDD reduction % | 15 (±23) | 57 (±34) |
| Postoperative imaging MR/CT | 0/28 | 45/49 |
LEDD = levodopa equivalent daily dose.
As a secondary outcome, we calculated improvements for rigidity (item 22), bradykinesia (items 23–26) and tremor (items 20–21) subscores. Total improvements as well as bradykinesia and rigidity improvements were calculated as % improvements from baseline. For tremor, the absolute difference was calculated due to a lower baseline in items 20–21. Patients who did not present tremor at baseline were excluded from this subanalysis. Demographic features are displayed in Table 1 and detailed information on the two cohorts have been published elsewhere.3,5
Deep brain stimulation electrode localization and calculation of electric fields
Electrodes in both cohorts were localized using Lead-DBS software (www.lead-dbs.org15) following the updated pipeline of the second version.16 Briefly, preoperative MRI and postoperative CT or MRI scans where linearly co-registered using advanced normalization tools (Advanced Normalization Tools; ANTs, http://stnava.github.io/ANTs/). To minimize bias introduced by a non-linear deformation of the brain due to pneumocephalus, the brain shift correction step in Lead-DBS was carried out.16 Multi-spectral preoperative volumes were then used to compute a spatial normalization warp field into ICBM 2009b Non-linear asymmetric (‘MNI’) space using the SyN Diffeomorphic Mapping approach implemented in ANTs.17 As shown in a recent study, the precision of this normalization protocol may lead to results comparable with manual expert segmentations of the STN and GPi and the method was top-performer in two comparative studies for normalizations of the subcortex.18,19 Subsequently, DBS electrodes were localized using the PaCER algorithm for CT volumes or the TRAC/CORE method for MRI volumes.15,20 Results were carefully inspected and manually refined, if necessary, using Lead-DBS. Anatomical segmentations of subcortical structures shown in the present manuscript were defined by the DISTAL atlas using the Lead Group analysis tool.21,22 Electric fields (E-fields) were calculated applying a finite element method-based model in each patient.16
Statistical analysis
Deep brain stimulation network mapping
Seeding from voxels contained in the E-Field model, a functional connectivity profile was calculated using data from 1000 healthy subjects acquired within the Brain Genomics Superstruct Project.23,24 Values in E-fields served as weights to generate the connectivity profile using the Lead Connectome Mapper tool included within Lead-DBS. This led to connectivity ‘fingerprints’ for each patient describing (average) positive and negative functional connectivity between the pair of E-fields and other voxels of the brain (Fig. 1A).
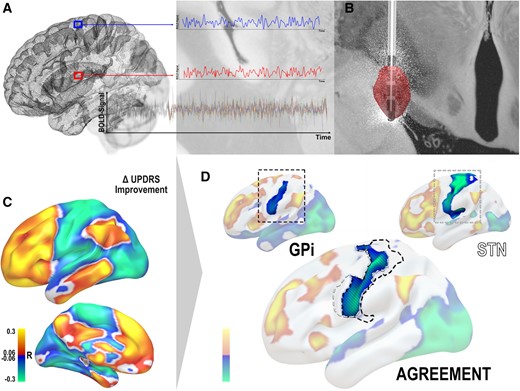
Methods overview. (A) The connectivity profile of each patient’s electric field was determined by using a normative functional connectome to estimate functional connectivity seeding from the electric field (B) to other areas of the brain. (C) This led to connectivity fingerprints for each patient based on which voxel-wise correlation maps with % improvement scores along the UPDRS were calculated (R-maps). Here, areas to which connectivity was associated with symptom relief are shown in warm colours and those associated with poor improvements are in cool colours. (D) Based on two R-maps, an agreement map was calculated by retaining areas that had the same sign on both maps (and multiplying their absolute values) and discarding areas in which signs on the two maps were conflicting. This is illustrated in a single example focusing on negative associations with the primary motor cortex.
Clinical improvements were then correlated with connectivity fingerprints in a voxel-wise fashion across the two cohorts following the approach reported previously.5 This resulted in R-map models of ‘optimal’ connectivity (Fig. 1C). These R-maps denote positive (Pearson’s correlation) coefficients for regions that were positively connected predominantly to electrodes of top responders and negative coefficients for the ones predominantly connected to electrodes in poor responding patients.
The R-map model was then used to estimate clinical improvements in out-of-sample patients. To do so, the connectivity fingerprints (seeding from E-fields in a specific patient) were spatially compared to the R-map model using the per cent bend correlation metric across voxels. The more similar each patient’s fingerprint would be to the R-map, the higher our prediction about their clinical improvements. Here, similarity was calculated by means of spatial correlation across grey matter voxels in the cortex and cerebellum (subcortical voxels were not compared to exclude confounding local effects introduced by electrode placement). Crucially, this step was carried out in out-of-sample data to avoid circularity of our model. For instance, the R-map model was calculated on STN-DBS patients to predict outcomes in the GPi sample, and vice versa.
Towards an agreement model across deep brain stimulation targets
Our aim was to show differences and similarities of optimal network profiles in STN- and GPi-DBS. To calculate the set of regions predictive for clinical outcomes regardless of target choice, a novel type of map was calculated that we termed ‘agreement map’. To do so, the R-maps of the two cohorts were superimposed and areas that were either positive or negative in both maps were retained (other areas were discarded). To preserve weighting, the remaining values were multiplied across maps while preserving the sign. For instance, if a voxel had values of R = 0.3 and R = 0.2 in the two (STN and GPi) maps, the resulting value in the agreement map would be 0.06. A combination of −0.3 and −0.2 would lead to −0.06 while one of −0.3 and 0.2 would lead to exclusion of the voxel. We hypothesized that regions retained in the agreement map could be more specific for clinical outcomes in both cohorts than a model that had seen all data without segregation into the two targets—or a model that was informed by either cohort alone. Hence, we calculated a ‘conventional’ R-map across all data-points (patients from both the STN and GPi cohort) and for each cohort alone and compared its predictive utility with the agreement map.
Data availability
The DBS MRI datasets analysed in the present study are not publicly available due to privacy regulations of patient health information but are available from the corresponding author upon reasonable request. All code used to analyse the dataset and resulting optimal connectivity profiles are openly available within Lead-DBS/-Connectome software (https://github.com/leaddbs/leaddbs).
Results
The STN cohort included 94 patients of two independent datasets (29 female, mean age = 60 ± 8 years, with a UPDRS baseline of 43 ± 14 and UPDRS improvement after DBS of 47 ± 23%). The GPi cohort included 28 patients (10 female, mean age = 60 ± 6 years, with a UPDRS baseline of 43 ± 14 and UPDRS improvement after DBS of 13 ± 42%). Consistent with prior reports, while baseline levodopa equivalent daily dose (LEDD) medication were comparable, reductions in LEDD before and after surgery were significantly stronger in STN versus GPi cohorts (57 versus 15%; t = 5.8 at P < 10−7). Based on available medical records, no patient had significant neuropsychiatric, affective or cognitive side effects at time of follow-up. See Table 1 for further demographic and imaging data. Electrode locations showed DBS electrodes of all patients placed within the respective target regions (Fig. 2). However, in the GPi cohort, a total of nine patients were placed outside of the GPi [in the external globus pallidus (GPe)/lamina medullaris externa region]. All main analyses were repeated after leaving out these patients.
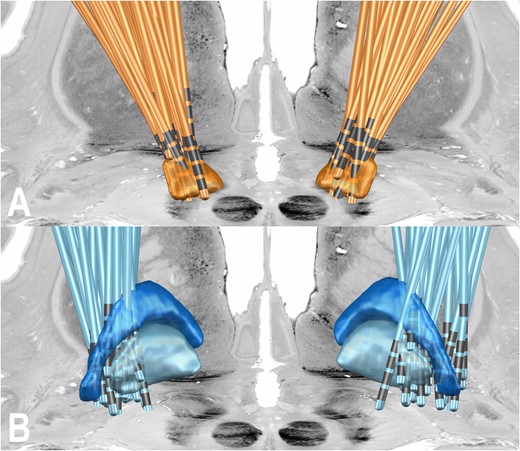
Electrode localizations of the two cohorts shown from posterior. (A) STN cohort described by Horn et al.5 (B) GPi cohort described by Odekerken et al.3 STN = orange; GPi = light blue; GPe = dark blue. The colours of the two cohorts match the colours in subsequent figures. In the background, transversal and coronal slices from the BigBrain atlas are shown.25
The first R-map model was calculated exclusively on data from the 94 STN-DBS patients (Fig. 3, top left). Similarity estimates between this map and each whole-brain connectivity fingerprint (seeding from the two DBS electrodes) of the GPi-DBS cohort were calculated and correlated with clinical improvement values in this cohort (Fig. 3 top right; R = 0.34 at P = 0.032). When repeated vice versa (calculating the R-map model in the GPi sample; Fig. 3 bottom right; to cross-predict outcomes in the STN sample; bottom left), the correlation was of the same magnitude (R = 0.37 at P < 0.001). Since this latter correlation looked slightly skewed, results were recomputed after z-transforming connectivity similarity metrics to a Gaussian distribution following the approach defined by van Albada.26 Results remained significant (Supplementary Fig. 1). In both R-maps, functional connectivity to regions in the frontal lobe, in particular SMA and adjacent cingulate, middle and inferior temporal gyri, inferior parietal gyri and motor cerebellum were associated with optimal clinical response (Table 2). Repeating the analysis after omitting GPi cases with electrodes outside of the GPi led to equally significant cross-validations (STN to GPi: R = 51 at P = 0.010; GPi to STN: R = 36 at P < 0.001; Supplementary Fig. 2).
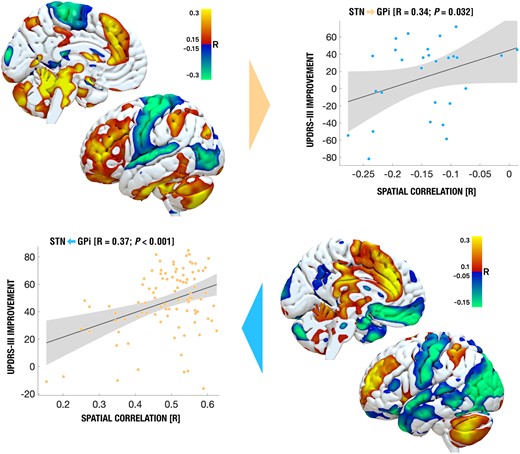
Cross-predicting DBS outcomes across cohorts and targets. R-maps for both STN-DBS (top left) and GPi-DBS (bottom right) were used to cross-predict clinical outcomes in the other cohort, respectively (top right shows predictions of outcomes in the GPi-DBS cohort based on the STN-DBS R-map model, bottom left shows the opposite).
Overlap between spatial correlations and significant connectivity measures
| Region | Hemisphere | STN R-map | GPi R-map | Agreement map |
|---|---|---|---|---|
| Positive peak coordinates x/y/z (R-value) | ||||
| SMA (BA 6) | Right | 6/16/62 (0.31) | 8/14/62 (0.43) | 6/18/62 (0.13) |
| Left | −16/8/62 (0.44) | −10/12/62 (0.36) | −4/16/60 (0.09) | |
| SFG (BA 9, 11) | Right | 30/62/30 (0.34) | 26/60/26 (0.41) | 26/62/28 (0.12) |
| Left | −44/50/30 (0.35) | −26/60/22 (0.56) | −34/60/26 (0.13) | |
| ACC (BA 24, 32) | Right | 1/36/12 (0.30) | 14/32/26 (0.55) | 12/34/28 (0.15) |
| Left | −4/36/28 (0.30) | −4/34/16 (0.51) | −4/36/28 (0.15) | |
| IPL (BA 7, 39) | Right | 36/−58/44 (0.28) | 42/−62/44 (0.14) | 36/−58/44 (0.03) |
| Left | −36/−56/50 (0.30) | −38/−62/50 (0.20) | −38/−60/48 (0.04) | |
| CBM | Right | 60/−60/−22 (0.53) | 38/−58/−44 (0.37) | 24/−34/−30 (0.13) |
| Left | −2/−52/−22 (0.49) | −50/−62/−38 (0.43) | −58/−62/−42 (0.14) | |
| Negative peak coordinates x/y/z (R-value) | ||||
| PCG (BA 4) | Right | 26/−22/54 (−0.28) | 42/−20/66 (−0.21) | 40/−18/68 (−0.06) |
| Left | −26/−22/54 (−0.30) | −66/−6/26 (−0.19) | −68/−4/28 (−0.06) | |
| MTG (BA 19, 39) | Right | 40/−56/18 (−0.30) | 50/−62/16 (−0.43) | 36/−80/28 (−0.01) |
| Left | −50/−68/16 (−0.30) | −48/−70/16 (−0.50) | −54/−76/24 (−0.02) | |
| MOL (BA 19) | Right | 54/−78/4 (−0.40) | 64/−68/−8 (−0.40) | 54/−78/0 (−0.08) |
| Left | −58/−80/8 (−0.41) | −44/−88/20 (−0.50) | −52/−70/14 (−0.12) | |
Peak coordinates of STN, GPi and their agreement map. ACC = anterior cingulate cortex; BA = Brodmann area; CBM = cerebellum; IPL = inferior parietal lobule; MTG = middle temporal gyrus; MOL = middle occipital lobe; PCG = precentral gyrus; SFG = superior frontal gyrus; SMA = supplementary motor area.
In a next step, we aimed at creating a model that would be maximally predictive of clinical outcomes regardless of DBS target (STN versus GPi). A first attempt was to calculate an R-map across the whole group of patients, i.e. simply by correlating clinical outcomes across all 122 patient’s connectivity fingerprints. Not surprisingly, this map (not shown) was again highly similar to those shown in Fig. 3. When using it to explain variance in clinical outcomes, it was mildly predictive in the STN cohort (R = 0.24 at P = 0.014) but estimates did not significantly correlate with clinical outcomes of the GPi cohort (R = 0.28 at P = 0.073). A subsequent, more deliberate approach was to create an ‘agreement map’ from the two R-maps that were obtained in each cohort, separately (STN R-map and GPi R-map) by discarding regions that did not agree in sign between the two maps (see the ‘Materials and methods’ section). This type of map is novel in the present context and could intuitively be perceived as a ‘common denominator’ network across the two targets. It was able to significantly explain variance in clinical outcomes in both cohorts (R = 0.34 at P < 0.001 for the STN cohort and R = 0.39 at P = 0.022 for the GPi cohort). Repeating the analysis while leaving out electrodes that were placed outside of the GPi led to highly similar correlations (R = 0.33 at P < 0.001 for the STN cohort and R = 0.30 at P = 0.043 for the GPi cohort; Supplementary Fig. 3). Crucially, the amount of variance explained by the agreement map was even larger than the one explained by each of the target specific maps (STN and GPi R-map; Fig. 4). Hence, by refining the model from data in a second target (albeit with an independent cohort), the amount of explained variance could be increased. Of note, these values are meant for direct head-to-head comparisons and should be interpreted with care since the analysis setup is circular. However, by integrating these results with leave-one-out predictions (Fig. 3) and the regions within the agreement map (Fig. 4), the agreement map could inform a hypothesis of a common treatment network for Parkinson’s disease that will be made openly available to empower further validation in subsequent studies.
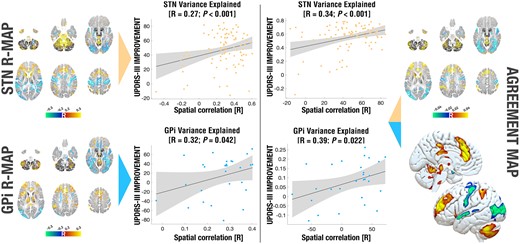
Variance in clinical outcomes explained by different models. Predictive utility of the R-map calculated in each target (left) and an agreement map, in which only regions predictive for both targets were retained (right). Using the the R-map calculated on either target alone, a significant portion of variance in outcomes in both cohorts could be explained (R = 0.27 at P < 0.001 for STN; R = 0.32 at P = 0.042 for GPi). The agreement map was able to explain additional variance in each of the two cohorts (R = 0.34 at P < 0.001 for STN; R = 0.39 at P = 0.022). Single target maps on the left correspond to renderings in Fig. 3 and are shown as volumetric cuts at z = −50, −30, −10, 10, 30 and 50 mm. The agreement map is shown both in volumetric and surface fashion. The BigBrain atlas served as the backdrop for volumetric representations.25
As a final analysis, we calculated symptom-specific improvements (bradykinesia, rigidity and tremor; Fig. 5). R-maps calculated for rigidity and bradykinesia independently were highly similar to each other (not shown), hence they were combined to form a bradykinesia-rigidity improvement that was contrasted with tremor improvements. This goes in line with prior reports.27 While the R-map model for bradykinetic-rigid symptoms was similar and cross-predictive across cohorts (R = 0.53 at P < 0.001 when calculating the R-map based on STN patients to predict outcomes in the GPi cohort; R = 0.33 at P = 0.01 vice versa), they were not for tremor (STN to GPi: R = −0.19 at P = 0.192; GPi to STN: R = −0.02 at P = 0.452). While these results could give first hints, due to the small sample size in the GPi cohort and further exclusion of 27 (STN) and five (GPi) patients with no tremor at baseline, these results should not be over-interpreted and are likely underpowered.
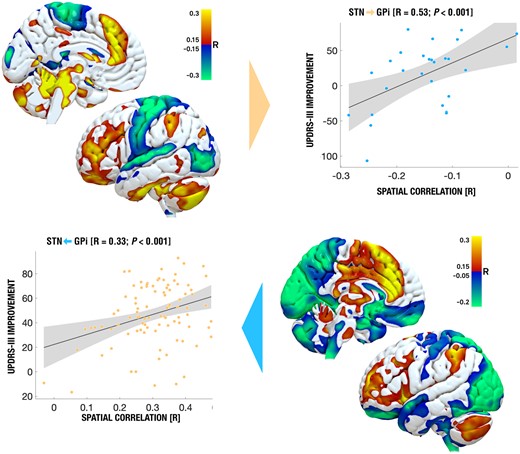
Connectivity maps associated with outcomes in bradykinesia and rigidity. Rigidity and bradykinesia were summarized due to high similarity when analysed independently. Only this map and pattern led to significant cross-predictions across STN and GPi targets. Instead, effects on tremor (not shown) were associated with a different connectivity pattern—also across targets and the cross-prediction did not yield significant effects.
One difference we did note across cohorts was that in the GPi cohort, especially the bradykinetic symptoms of some patients got worse under DBS. The induction of bradykinetic symptoms by GPi-DBS has been reported even in cohorts without Parkinson’s disease (such as dystonia), before.28,29 Hence, as an opportunity to study this relationship further, we localized average electric field localizations and contrasted functional connectivity profiles calculated from the six GPi patients in which bradykinesia improved most strongly (by 67.9 ± 11.6%) with the six in which bradykinesia worsened most strongly (by −58.4 ± 19.7%). This revealed significant differences in local stimulation volume (within the GPi region) as well as connectivity profiles (Fig. 6). Namely, stimulation sites in worsening patients were situated more postero-laterally and close to the border of the GPe. They were less connected to left superior, middle and inferior frontal gyrus and more strongly connected to bilateral cerebellar and occipital regions as well as to the parieto-occipital sulcus.
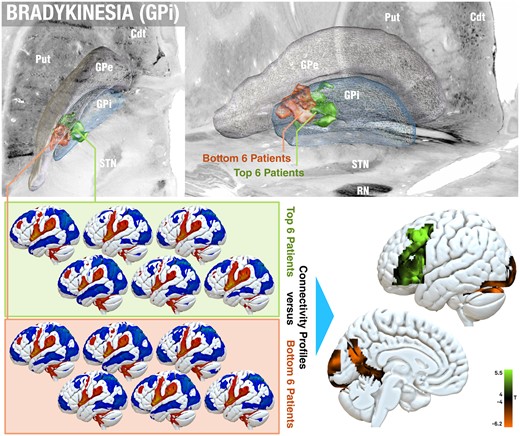
Effects of GPi-DBS on bradykinesia. Within the GPi cohort, it was noted that in some patients, bradykinetic symptoms worsened under DBS—as stated by previous reports.28,29 On a local level (top; showing a top and oblique view), the average electric fields of the top six improving and bottom six worsening patients were placed markedly differently, the latter in a more posterolateral location and closer to the GPe border. A paired t-test contrast between connectivity fingerprints of the same patients (bottom) revealed a positive association with left middle and inferior frontal gyrus (bradykinesia improvement) and negative association (worsening) with bilateral cerebellar and occipital regions, as well as the parieto-occipital sulcus (family-wise estimate corrected on cluster level at P < 0.05). Cdt = caudate nucleus; Put = putamen; RN = red nucleus.
Discussion
Three main conclusions may be drawn from this study. First, based on our results, optimal whole-brain connectivity profiles of DBS to the STN and GPi for effective treatment of Parkinson’s disease are highly similar. For both targets, a functional connectivity profile with anticorrelations to sensorimotor cortices and positive connectivity to specific regions in the frontal cortex and motor cerebellum (among other regions) were associated with optimal clinical outcomes. This finding was quantified by cross-predicting clinical outcomes across DBS targets. In other words, a model of optimal connectivity was calculated based on one target and used to cross-predict variance in outcomes of patients operated at the second target, and vice versa. This finding suggests that regardless of STN or GPi stimulation, a shared functional network could be responsible for motor symptom improvements in Parkinson’s disease. Second, we introduced a novel method to combine models of optimal network response across DBS targets (in the form of an agreement map) and showed that it was able to explain variance in outcomes regardless of DBS target choice. Finally, third, our data suggest that while connectivity profiles of electrodes that were associated with maximal improvements of bradykinetic-rigid symptoms were similar across targets, those for tremor seemed to differ. Moreover, some stimulation sites in the GPi cohort led to worsening of bradykinesia. These sites were situated more postero-laterally within the GPi and less strongly connected to inferior frontal regions.
While our results suggest that optimal networks between STN and GPi targets largely overlap, we would like to stress that they should not be considered identical. Multiple factors go into this, including (i) that STN receives direct cortical input from the whole frontal cortex and GPi does not (or to a much lesser degree); (ii) STN is a glutamatergic and GPi a GABAergic nucleus; and (iii) the functional MRI measure used here includes a large amount of spurious and indirect connections.30 The latter point is the reason why we believe the agreement map concept is of value. Namely, while an optimal target (e.g. in the STN) may be connected to multiple brain regions, not all of those will play a causal role in mediating treatment. The same applies to other optimal targets (e.g. the GPi). The relative probability that a region does play a causal role may increase if it is predictive in both targets, alone. And, in reverse, if a cortical region is only predictive in one of the optimal targets, it could more likely represent a spurious correlation without causal implications.
The fact that both targets seem to modulate similar networks stands in conflict with clinical differences observed between them—such as differences in their effects on medication and dyskinesias. It is possible that part of the answer to this conflict may be seen in surrounding brain regions. For instance, co-modulation of GPe is possible in the GPi but not in the STN region. The striato-pallido-fugal system condenses cortical information via successive dimensionality reduction steps from striatum to GPe to external GPi and internal GPi.31 At each stage, the spread of pallidal neurons is of similar size but as a consequence has increasingly larger receptive fields (funnel effect of the basal ganglia32). Hence, misplacement in the pallidal target could likely lead to non-linear effects on a somato-topical domain—whereas such effects are less expected in the STN region. Similarly, in the STN, fibres of passage (such as the pallido-thalamic bundles or the comb system, direct connections from and to pedunculopontine nucleus) as well as proximity to zona incerta and red nucleus, may exert effects that are not yet well understood.
As mentioned, one particularly widely discussed difference between the STN and GPi targets is that the former receives hyperdirect input from the cortex while the latter does not (or to a much lesser degree). Hence, in the STN, antidromic activation of the hyperdirect pathway has been suggested as one (of many) mechanisms of action of DBS.33 We believe that when seen at this level of granularity (the level of neurons and axons), DBS impact on STN versus GPi is highly different. For instance, recent in vitro work has suggested that repetitive DBS-like subthalamic high-frequency stimulation may selectively evoke synaptic depression of glutamatergic but not GABAergic afferents.34 Crucially, however, on a higher abstraction level of networks (the broad-lens level of whole-brain systems neuroscience), effects of depletion or lesioning (no firing) versus high frequency nonsensical firing (e.g. entrainment to harmonics of the 130 Hz DBS pulse) could lead to the same effect, namely the one of disrupting the flow of pathological information.
On this level, explanations of the pathophysiology of basal ganglia disorders such as Parkinson’s disease have been dominated by the Albin-DeLong model and its subsequent modifications.35,36 This model describes a fronto-basal-ganglia-thalamo-cortical feedback loop, and one general concept is that inhibition of either STN or GPi due to DBS may lead to a net shift of balance leading to disinhibition of the thalamus and a propagation of motor output. In this way, effects of DBS on hypokinetic symptoms such as bradykinesia and rigidity have been explained. While the model has proven valid and powerful on many occasions, the so-called paradox of functional neurosurgery consists of the fact that both STN-DBS and GPi-DBS have equally been effective targets for hyperkinetic movement disorders, such as dystonia.37-40
Hence, the working mechanism of the functional network targeted by DBS is thought to be more complex. A popular concept is that DBS reduces a noisy feedback signal that may be present across the whole basal ganglia cortical loop.37,41–43 Namely, pathologically synchronized activity can be recorded from several sites of the basal ganglia in the beta frequency range (13–30 Hz) and is found to be supressed by both DBS or dopaminergic medication and to relate to bradykinetic-rigid symptoms (but not tremor).44–48 In this framework, the main mechanism of action of DBS seems to be to disrupt (pathological) information flow—likely in a specific frequency domain—throughout the motor loop.38 In turn, physiological information flow could be restored by re-opening the necessary bandwidth. This could explain why both lesions and DBS to both STN and GPi are highly effective (and for both Parkinson’s disease and dystonia): a pathological noise carrier signal needs to be present for DBS to have a profound effect in that it disrupts largely monotonic and synchronized oscillating brain network activity (in the case of dystonia, a similar noise signal has been described in the form of pathologically synchronized theta activity).49
The method we applied here (resting-state functional MRI) is several orders of magnitude too crude to resolve aforementioned temporal dynamics. However, the present study may still contribute to this framework in the form of a better spatial characterization of exactly which connections seem to matter most. Which are the underlying anatomical regions that seem to play the most crucial part in this oscillating noise loop.
Not only are the optimal network maps calculated from the two DBS targets highly similar (Fig. 4), but there are even specific brain regions that are quantifiably predictive of clinical outcomes when modulating either one of the two targets (described as the agreement map). The agreement map included connections that (i) existed in both the STN and the GPi cohort; and (ii) were associated with optimal clinical outcome in both. It hence constitutes a model of areas to which the DBS electrode should be connected to maximize its treatment capability—regardless of DBS target. When seen from the angle of a noisy feedback model described above, we could speculate that this circuitry might be exactly where the noisy signal should be most predominantly expressed. A gap that makes it near impossible to directly relate connectivity information derived from resting-state functional MRI and electrophysiological recordings in the beta range, however, is time, i.e. temporal resolution. Still, some indirect hints show that the networks identified by the two methods (electrophysiology and functional MRI) could indeed converge. First, we know that optimal stimulation in the STN is reached within its sensorimotor functional zone, which is where beta power and STN-cortical beta coherence at rest is strongest.16,27,50–55 Second, regions with maximal expression of beta power were most strongly connected to prefrontal regions in a diffusion MRI-based tractography study that compared connectivity profiles seeding from contacts with higher beta activity than others.56
Accumulating evidence suggests that while the effective network responses for maximal treatment of bradykinesia and rigidity overlap, those for tremor are distinct.27,50 Here, some studies attribute the effect on tremor to structures outside the STN, such as the dentatothalamic tract.57,58 In contrast, the main effect on bradykinetic-rigid symptoms has been located to a highly similar region within the dorsolateral STN proper by multiple groups, worldwide.16,50,59–61 In line with this segregation of symptoms, elevated beta power in the STN was found to correlate with severity of bradykinetic-rigid symptoms, but not tremor.62
The divergence in responsive connectivity that we observed in the current data is consistent with the existence of akinetic/rigid and tremor-dominant subtypes of Parkinson’s disease. While the pathogenesis of the first type can be described using the conventional theory of an amplified balance in favour of the indirect pathway (at cost of the direct pathway), tremor is attributed a compensatory cause downward of the stream, involving a cerebello-thalamic network.63–65 Our current set of data-points is unable to characterize good evidence on a tremor network in Parkinson’s disease. What we note is that networks calculated for bradykinesia seem similar across targets (and can be used to cross-predict outcomes) while those for tremor are not. Augmenting such an analysis with additional cohorts could lead to a personalized DBS targeting the network tailored to the leading symptom in each patient.6
Finally, previous studies have reported for GPi-DBS in dystonia to induce bradykinetic symptoms.28,29 In direct comparison with the two cohorts shown here, we noted that bradykinetic symptoms became worse in a larger fraction of patients in the GPi-DBS cohort. When contrasting DBS connectivity profiles in the six patients in whom bradykinetic symptoms worsened most with those in whom it improved most, connectivity to cerebellar, occipital and parieto-occipital regions was associated with symptom worsening. The parieto-occipital sulcus specifically has been reported to be involved in finger-tapping tasks in patients suffering with Parkinson’s disease, especially when contrasting externally versus self-paced movements.66 Similar to findings relating to subscores, these explorative findings should not be over-interpreted since the study was not designed to exactly address this question. Instead, both could be helpful to form hypotheses that could motivate future work.
Above and beyond the motor domain, STN and GPi have been implicated with differential effects in the neuropsychiatric symptom spectrum. In general, neuropsychiatric side effects, such as increases in impulsivity, have been predominantly associated with the STN-DBS target.67 It has been reported that occurrence of impulsivity following STN-DBS relates to specific stimulation sites and their brain connectivity to fronto-striatal networks.68,69 Unfortunately, data about postoperative impulsivity were not available in the cohorts studied in the present manuscript.
Several limitations apply to this study. First and foremost, the two cohorts were not balanced in size. Since the results of the STN cohort were used from a larger prior publication that the present paper builds upon, this could not easily be accounted for. Despite the predominant agreement of the R-maps, there are regions that remain incongruent. In particular, connectivity to medial frontal gyrus and paracentral lobule differed fundamentally between the two targets. This might be explained by brain areas that are not part of a causal network, but that were spuriously connected to DBS electrodes that led to high rates of response. Since the spontaneous activity of all voxels is recorded during a resting-state functional MRI, all regions of the brain will either be functionally correlated or anticorrelated with the electrodes to some degree. Resting-state functional MRI itself constitutes an indirect measure of slow-dynamic brain connectivity. Hence, relationships to causal effects of DBS should not be assumed carelessly (and if not supported by additional means of data, see discussion above). Along the same lines, we applied normative connectome atlases to estimate functional connectivity. These datasets do not account for individual variations of connectivity but rather ask the question: which connectivity profile an electrode at a specific site would have in an average human brain. This is a crucial distinction that should not be forgotten and largely impacts the interpretation of our results. Still, use of normative connectomes in the context of DBS has led to models that were predictive in out-of-sample datasets.5,6,8,70–73 Finally, electrode models themselves have inaccuracies that are based on factors such as (i) resolution constraints of underlying data; (ii) complexity of and small size of subcortical targets; and (iii) registration errors when aggregating data across patients to make them comparable.16 To minimize impact of these constraints, we used a specialized DBS imaging pipeline that is based on multispectral normalizations evaluated for both STN and GPi, phantom-validated electrode localizations and careful manual inspection of results in each processing step.18,19,74 The electric field model around the electrode has limitations, especially when modelling bipolar stimulation settings which were applied in 6 of 122 patients in the current dataset.75 Subsequent studies should aim at confirming results when applying more advanced electrode modelling concepts, such as path activation or driving force models.76–78 Potential effects of imprecision in electrode localizations are further aggravated by the use of both postoperative MRI and CT in the STN cohort. However, both postoperative MRI and CT are considered valid choices in the field with phantom-validated and direct comparison studies that showed largely comparable reconstructions using either method.15,79–81
Conclusions
In summary, our results illustrate a candidate network that could be responsible for, or at least associated with, optimal clinical improvements in DBS for Parkinson’s disease—regardless of target choice. By pinpointing the network associated with optimal outcomes from two different subcortical nuclei (STN and GPi), regions with higher probability of causal involvement could have been identified. As such, a joint (agreement) model informed by both DBS targets was able to explain larger amounts of variance in clinical outcomes in patients operated with either target. Upon further validation, this set of brain regions could potentially inform neuromodulation targets associated with clinical improvements in Parkinson’s disease above and beyond the field of DBS.
Acknowledgements
Data were provided (in part) by the Brain Genomics Superstruct Project of Harvard University and the Massachusetts General Hospital (Principal Investigators: Randy Buckner, Joshua Roffman, and Jordan Smoller), with support from the Center for Brain Science Neuroinformatics Research Group, the Athinoula A. Martinos Center for Biomedical Imaging, and the Center for Human Genetic Research. Twenty individual investigators at Harvard and MGH generously contributed data to GSP Open Access Data.
Funding
This work was supported by the German Research Foundation (Deutsche Forschungsgemeinschaft, Emmy Noether Stipend 410169619 to A.H. and SPP 0141 to A.A.K.). The study was further funded by the Deutsche Forschungsgemeinschaft (DFG, German Research Foundation) – Project-ID 424778381—TRR 295. The work was further supported by the EU Joint Programme—Neurodegenerative Disease Research (JPND), Deutsches Zentrum für Luft- und Raumfahrt, grant number JPND2020-568–008 and the Foundation for OCD Research (FFOR, seed grant to A.H.).
Competing interests
M.R., and J.V. have business relationships with Medtronic, Abbott, and Boston Scientific, which are makers of DBS devices, but none is related to the current work. A.A.K. reports personal fees and non-financial support from Medtronic, personal fees from Boston Scientific, grants and personal fees from Abbott outside the submitted work. A.H. reports lecture fees for Medtronic and Boston Scientific. All other authors report no competing interests.
Supplementary material
Supplementary material is available at Brain online.
References
Abbreviations
- DBS
deep brain stimulation
- GPi
internal globus pallidus
- STN
subthalamic nucleus; UPDRS = Unified Parkinson's Disease Rating Scale
Author notes
Leon Sobesky, Lukas Goede contributed equally to this work.

