


Abstract
Epilepsies of early childhood are frequently resistant to therapy and often associated with cognitive and behavioural comorbidity. Aetiology focused precision medicine, notably gene-based therapies, may prevent seizures and comorbidities. Epidemiological data utilizing modern diagnostic techniques including whole genome sequencing and neuroimaging can inform diagnostic strategies and therapeutic trials. We present a 3-year, multicentre prospective cohort study, involving all children under 3 years of age in Scotland presenting with epilepsies. We used two independent sources for case identification: clinical reporting and EEG record review. Capture-recapture methodology was then used to improve the accuracy of incidence estimates. Socio-demographic and clinical details were obtained at presentation, and 24 months later. Children were extensively investigated for aetiology. Whole genome sequencing was offered for all patients with drug-resistant epilepsy for whom no aetiology could yet be identified. Multivariate logistic regression modelling was used to determine associations between clinical features, aetiology, and outcome. Three hundred and ninety children were recruited over 3 years. The adjusted incidence of epilepsies presenting in the first 3 years of life was 239 per 100 000 live births [95% confidence interval (CI) 216–263]. There was a socio-economic gradient to incidence, with a significantly higher incidence in the most deprived quintile (301 per 100 000 live births, 95% CI 251–357) compared with the least deprived quintile (182 per 100 000 live births, 95% CI 139–233), χ2 odds ratio = 1.7 (95% CI 1.3–2.2). The relationship between deprivation and incidence was only observed in the group without identified aetiology, suggesting that populations living in higher deprivation areas have greater multifactorial risk for epilepsy. Aetiology was determined in 54% of children, and epilepsy syndrome was classified in 54%. Thirty-one per cent had an identified genetic cause for their epilepsy. We present novel data on the aetiological spectrum of the most commonly presenting epilepsies of early childhood. Twenty-four months after presentation, 36% of children had drug-resistant epilepsy (DRE), and 49% had global developmental delay (GDD). Identification of an aetiology was the strongest determinant of both DRE and GDD. Aetiology was determined in 82% of those with DRE, and 75% of those with GDD. In young children with epilepsy, genetic testing should be prioritized as it has the highest yield of any investigation and is most likely to inform precision therapy and prognosis. Epilepsies in early childhood are 30% more common than previously reported. Epilepsies of undetermined aetiology present more frequently in deprived communities. This likely reflects increased multifactorial risk within these populations.
Introduction
The epilepsies are a group of conditions defined by an ‘enduring predisposition of the brain to generate epileptic seizures’.1,2 Epilepsies result from diverse aetiologies, including structural brain lesions, as well as monogenic and polygenic variation. Recent advances in both neuroimaging and genetic testing have resulted in a significant increase in the proportion of epilepsies that can be aetiologically resolved, particularly among epilepsies that begin in early childhood.3 Precise clinical classification of epilepsy syndrome, and identification of a genetic aetiology, helps guide therapeutic strategy, exemplified by randomized controlled trials in Lennox-Gastaut syndrome,4,5 and Dravet syndrome.6,7 For the individually rare but severe epilepsies caused by large effect mutations in a single gene, gene-directed therapy is a realistic prospect.8
The epilepsies have a high incidence in early childhood. On a population level, the highest age-specific incidences of >60 per 100 000 are observed in children under 5 years of age and in adults over 65 years of age.9 A significant proportion (35%) of children presenting with epilepsies in the first 3 years of life develop drug-resistant seizures.10 These individuals are at high risk of cognitive and behavioural comorbidity11 and of early mortality.12 Whilst early age of onset, poor seizure control, and developmental comorbidity are undoubtedly interrelated,10 the causal nature of these relationships is not clear. Underlying aetiology is likely to play a significant role in determining outcomes but has not previously been investigated at population level in the context of modern neuroimaging and genetic technology. We have established a whole population cohort of children presenting with epilepsies before the age of 3 years in Scotland. The aims of this study are to describe the incidence and phenotypes of epilepsies in this age group for a national cohort; to comprehensively investigate for underlying causes; and to use this information to determine the relationships between socio-economic status, aetiology, seizure control and developmental outcome.
Materials and methods
Patients
This was a prospective cohort study involving the whole population of Scotland (n = 5 424 800 for year 2017).13
Inclusion criteria included presentation (i) with recurrent (two or more) unprovoked seizures; (ii) before child’s third birthday; (iii) between 8 May 2014 and 7 May 2017.
Exclusion criteria included: (i) all—or all but one—epileptic seizures were considered provoked. This includes febrile seizures and acute symptomatic seizures. Acute symptomatic seizures were defined as epileptic seizures attributed to an identified transient insult and resolving within 28 days of that insult. Examples of transient insults include CNS infection, CNS parainfectious syndromes such as acute disseminated encephalomyelitis (ADEM), electrolyte disturbance, CNS infarct or haemorrhage, or CNS hypoxic injury; and (ii) epilepsy diagnosis subsequently disproved.
Patient ascertainment
Two independent sources of case capture were used: (i) prospective recruitment via paediatricians, paediatric neurologists, and epilepsy specialist nurses; and (ii) independent review of the records of all children who had undergone EEG.
Prospective recruitment
Children were recruited from 20 regional paediatric departments and four tertiary children’s hospitals, representing all centres where children with seizures within the universal national healthcare system of Scotland are seen and assessed. Maximum case ascertainment was ensured by weekly e-mail reminders throughout the study period to a link clinician in each of the 24 centres and all 17 epilepsy specialist nurses in Scotland. Research nurses throughout Scotland reviewed admissions to all intensive care and high dependency units; and a national continuing education programme maintained the profile of the study.
EEG review
There are eight paediatric neurophysiology departments in Scotland. Details of all patients who undergo EEG is stored on electronic servers. The medical case records of all children who had EEG during between 1 January 2014 and 31 December 2017, and who were under 4 years of age at the time of EEG, were reviewed to determine if they satisfied the inclusion and exclusion criteria.
Clinical information
Clinicians were required to complete a structured proforma at the time of recruitment, giving clinical details in relation to the first epileptic seizures, including age of child, seizure type classification, cognitive and behavioural comorbidity, and any investigation findings. The same clinical details were gathered from the case records of patients ascertained through EEG record review.
Twenty-four months after initial presentation, the clinical records of each patient were reviewed to determine epileptic syndrome classification, aetiology classification, and whether a diagnosis of drug-resistant epilepsy (DRE) or global developmental disability (GDD) had been made. DRE was defined as ongoing epileptic seizures despite two adequately trialled and tolerated antiepileptic drug (AED) regimens, or the prescription of a third AED regimen due to lack of efficacy of two previous medications.14 GDD was defined as delay ≥2 standard deviations (SD) below the mean in two or more domains of development (gross motor, fine motor, speech and language, social), as perceived by the managing physician.15 Epilepsy was classified as per the 2017 International League Against Epilepsy (ILAE) position paper on classification of the epilepsies.16
Aetiological investigations
All children without an already established aetiology for their epilepsy were offered genetic testing on a 104-gene epilepsy panel.17 Patients who were negative on panel testing who had GDD were tested for genomic copy number variants (CNVs) using chromosomal microarray. Patients negative on panel testing who had DRE were offered trio whole genome sequencing (WGS). Neuroimaging and EEG investigations were performed at the clinical discretion of the managing physician.
Population data and deprivation scores
National Records of Scotland birth records13 were used to obtain denominator data for births over the study period. Incidence estimates were rounded to three significant figures and 95% confidence intervals (CIs) were calculated using the Poisson distribution. Participants were classified into five quintiles of the Scottish Index of Multiple Deprivation (SIMD)18 based on their resident postcode at the time of their second unprovoked seizure.
Statistical analysis
To produce adjusted incidence estimates using capture recapture methodology, assuming that our two ascertainment strategies were independent, we used the following formula: (N1 × N2) / N1+2, where N1 is the number of cases identified through prospective recruitment, N2 the number of cases identified through EEG review, and N1+2 the number of cases identified through both ascertainment strategies (the overlap).
Ninety-five per cent confidence intervals (CI) for incidence estimates for epilepsy syndromes and aetiologies were obtained using Poisson statistics. To investigate for associations between deprivation [Scottish Index of Multiple Deprivation (SIMD) quintile] and incidence of epilepsies, we used χ2 test of trend and χ2 test for differences between quintiles 1 and 5.
IBM® SPSS® Statistics Version 26 was used to determine associations between clinical categorical variables. Univariate modelling used Fisher's exact test. Multivariate modelling used binary logistic regression (Hosmer-Lemeshow test). Model construction was informed by the findings from the univariate analysis, and is described in detail where these data are presented in the ‘Results’ section.
Ethical approvals and consent
The study was approved by the West of Scotland NHS Research Ethics Committee (REC number 13/WS/0299, IRAS ID 135019) and the Scotland NHS National Research Ethics Committee (REC number 16/SS/0054, Protocol number GN15NE178, IRAS ID 170749). Signed parental consent for gene panel testing, WGS, and prospective follow-up, was obtained for participants.
Data availability
All individual case data used in the analysis is available in the Supplementary material.
Results
Incidence of epilepsies presenting in the first 3 years of life
Over the 3-year study period (May 2014 to May 2017), 390 patients with epilepsies presenting in the first 3 years of life were identified in Scotland. Two hundred and seventy-eight patients were recruited to the prospective study. Two thousand four hundred and two children under 4 years of age underwent EEG investigation between 1 January 2014 and 31 December 2017. After review of their case records, we identified 355 patients satisfying the inclusion criteria. Two hundred and forty-three patients were picked up through both methodologies. Using a capture-recapture estimate, the adjusted number of patients presenting with epilepsy in the first 3 years of life was 405.
The mean birth rate in Scotland between 2011 and 2016 inclusive was 56 490 per year and remained stable during this period (range 54 488–58 590). Therefore, a denominator value of 169 500 was used as the estimated number of births over a 3-year period 2014–17.
From these data, we determined that the crude incidence of epilepsies presenting in the first 3 years of life in this Scottish population was 230 per 100 000 live births (95% CI 208–254) or 1 per 435 live births. Using capture recapture methodology, the adjusted incidence was 239 per 100 000 live births (95% CI 216–263), or 1 per 418 live births. The highest age-specific incidence was in the 0–6 month age group, with incidence dropping in every subsequent 6-month group, before rising again in the 30–36-month bracket (Fig. 1 and Supplementary Table 1).
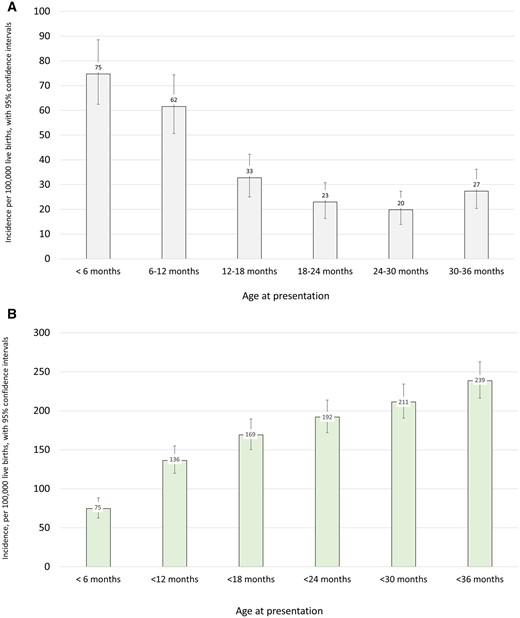
(A) Incidence of epilepsies by age of presentation, per 100 000 live births. (B) Cumulative incidence of epilepsies by age of presentation, per 100 000 live births.
Incidence and deprivation
We proceeded to investigate the relationship between epilepsy incidence and deprivation based on the SIMD. Significantly higher incidences were observed in the most deprived quintile of the population, based on household residence location, compared with the least deprived quintile. Incidence in the most deprived quintile was 301 per 100 000 live births (95% CI 251–357) and in the least deprived quintile was 182 per 100 000 live births (95% CI 139–233). This was a significant difference [χ2 odds ratio (OR) = 1.7 (95% CI 1.3–2.2)]. There was also a significant trend, with higher incidences observed with increasing deprivation (χ2 for trend, P = 0.01) (Fig. 2A and Supplementary Table 2). When only those with an identified aetiology were included in the same analysis there was no association with deprivation (χ2 for difference between quintile 1 and quintile 5, P = 0.26; χ2 for trend, P = 0.5) (Fig. 2B and Supplementary Table 2 ). The association with deprivation was maintained when only those without an identified aetiology were included. Here there was a significant difference in incidence between quintile 1 and quintile 5 [OR 2.3 (95% CI 1.4–2.8)] and a significant trend across the quintiles (P = 0.005) (Fig. 2C and Supplementary Table 2). There were no significant associations between SIMD quintile and any variables in relation to age or presentation, seizure type, development of DRE/GDD, or aetiology (Supplementary material). We investigated whether children in lower deprivation quintiles were more extensively investigated by MRI and genetic testing and this was not the case (Supplementary material).
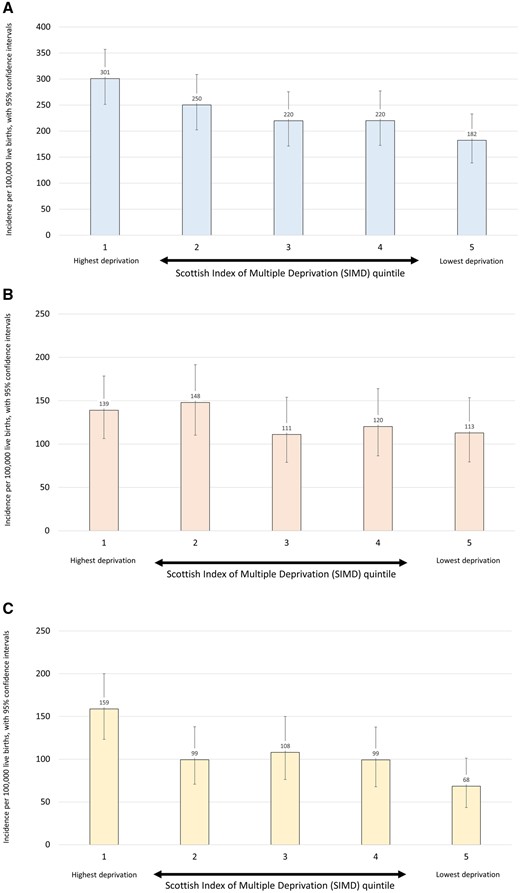
(A) Incidence of epilepsies by SIMD category, per 100 000 live births. (B) Incidence of epilepsies with aetiology by SIMD category, per 100 000 live births. (C) Incidence of epilepsies without aetiology by SIMD category, per 100 000 live births.
Classification
We next considered the clinical epilepsy classification. Two hundred and nine of 390 (54%) of identified epilepsies were classified clinically as either a developmental and epileptic encephalopathy (DEE), a self-limited epilepsy, or another specific epilepsy syndrome (Table 1). Infantile spasms syndrome was the most common syndrome, with an incidence of 30.7 per 100 000 live births (95% CI 22.9–40.2). As expected, there were higher frequencies of DRE, GDD and mortality among those with epilepsies classified as DEE compared with those classified as self-limited epilepsies. The incidences of a number of epilepsy syndromes that only present in the first 3 years of life are presented in Table 1. All 11 patients diagnosed with Dravet syndrome had a de novo pathogenic variant in the SCN1A gene.
Epilepsy syndrome classification 24 months after initial presentation, and genetic findings in each group
| Syndrome | n | Incidence per 100 000 live births (95% CI) | DRE | GDD | Death | Associated genetic causesa |
|---|---|---|---|---|---|---|
| Developmental and epileptic encephalopathies | 146 | 86.1 (72.7–101.3) | 120 (82%) | 134 (92%) | 11 (8%) | |
| Infantile spasms syndrome | 52 | 30.7 (22.9–40.2) | 27 (52%) | 42 (81%) | 1 (2%) | Trisomy 21 (6), CDKL5 (2), TSC1 (2), TSC2 (3), Trisomy 13, 16p13.11 deletion, 17p13.3 deletion (Miller-Dieker), IDIC15, ASAH1, CACNA1G, DEPDC5, PAFAH1B1, POLR1A. Total = 22 (42%) |
| Early infantile DEE (<3 months) | 17 | 10.0 (5.8–16.0) | 17 (100%) | 17 (100%) | 4 (24%) | CDKL5 (2), ALG3, CASK, CNTNAP1, COL4A1, FOXG1, KCNQ2, KCNT1, SCN2A, STXBP1, TUBA1A. Total = 12 (71%) |
| Dravet syndrome | 11 | 6.5 (3.2–10.0) | 11 (100%) | 9 (82%) | 0 (0%) | SCN1A (11). Total = 11 (100%) |
| Epilepsy with myoclonic atonic seizures | 9 | 5.3 (2.4–10.1) | 8 (89%) | 8 (89%) | 0 (0%) | 7q deletion, 16p11.2 deletion, NIPBL, SLC6A1, STX1B. Total = 5 (56%) |
| Alpers syndrome | 2 | 2 (100%) | 2 (100%) | 2 (100%) | POLG (2). Total = 2 (100%) | |
| Absences with eyelid myoclonia | 1 | 1 (100%) | 1 (100%) | 0 (0%) | CHD2. Total = 1 (100%) | |
| Other DEE | 54 | 31.9 (23.9–41.6) | 54 (100%) | 54 (100%) | 4 (7%) | 15q11-13 deletion (Angelman, 2), 16p11.2 deletion (2), PCDH19 (2), SLC6A1 (2), 1p36 deletion, 1q21.1–21.2 duplication, 17p13.3 deletion (Miller-Dieker), 17q12 deletion, marker chromosome 20, AMT (glycine encephalopathy), FOXG1, KCNQ2, SCN8A, TSC2, WT1. Total = 19 (35%) |
| Self-limited epilepsies | 37 | 21.8 (15.4–30.1) | 0 (0%) | 1 (3%) | 0 (0%) | |
| Self-limited neonatal epilepsy | 9 | 5.3 (2.4–10.1) | 0 (0%) | 0 (0%) | 0 (0%) | KCNQ2 (5), KCNQ3 (3). Total = 8 (89%) |
| Self-limited infantile epilepsy | 24 | 14.2 (9.1–21.1) | 0 (0%) | 1 (4%) | 0 (0%) | PRRT2 (17), KCNA2, KCNQ2. Total = 19 (79%) |
| Myoclonic epilepsy of infancy | 4 | 0 (0%) | 0 (0%) | 0 (0%) | ||
| Other specific syndromes | 25 | 14.7 (9.5–21.8) | 0 (0%) | 2 (8%) | 0 (0%) | |
| Early onset absence epilepsy | 9 | 5.3 (2.4–10.1) | 0 (0%) | 2 (22%) | 0 (0%) | |
| Epilepsy with myoclonic absences | 2 | 0 (0%) | 0 (0%) | 0 (0%) | ||
| Familial focal epilepsy | 1 | 0 (0%) | 0 (0%) | 0 (0%) | DEPDC5. Total = 1 (100%) | |
| Febrile seizures + | 10 | 5.9 (2.8–10.9) | 0 (0%) | 0 (0%) | 0 (0%) | SCN1A. Total = 1 (10%) |
| Panayioutopoulos syndrome | 3 | 0 (0%) | 0 (0%) | 0 (0%) | ||
| Unclassified epilepsies | 182 | 107.4 (92.3–124.2) | 19 (10%) | 56 (31%) | 2 (1%) | |
| Unclassified epilepsy | 58 | 34.2 (23.6–44.2) | 9 (19%) | 1 (2%) | 1 (2%) | SLC2A1 (3), SLC6A1 (4), 4p16.3-4p16.2 deletion, 16p11.2 deletion, CHD4, MAF1, PCDH19. Total = 12 (16%) |
| Unclassified focal and generalized epilepsy | 16 | 9.4 (5.4–15.3) | 3 (35%) | 2 (13%) | 0 (0%) | 7p deletion and 7q duplication, ATP7A, SLC2A1. Total = 3 (19%) |
| Unclassified focal epilepsy | 88 | 51.9 (41.6–64.0) | 12 (14%) | 29 (33%) | 1 (1%) | DEPDC5 (2), 16p11.2 duplication, Xp22.31 deletion, B3GALNT2 (Walker-Warburg), KCNQ2, MECP2, NEXMIF, PCDH19, SCN2A, SLC2A1. Total = 12 (14%) |
| Unclassified generalized epilepsy | 17 | 10.0 (5.8–16.0) | 3 (18%) | 5 (29%) | 0 (0%) | SCL2A1 (2), Xq12 deletion, CACNA1A. Total = 4 (24%) |
| Unclassified myoclonic epilepsy | 3 | 0 (0%) | 1 (33%) | 0 (0%) | SCL2A1. Total = 1 (33%) | |
| All drug-resistant epilepsiesb | 139 | 82.0 (59.4–96.8) | 116 (83%) | 10 (7%) |
DEE = developmental and epileptic encephalopathy; IDIC15 = isodicentric chromosome 15. aIf more than one patient, number is given in parentheses. bNote that ‘All drug-resistant epilepsies’ is not a syndrome.
Thirteen (3%) of children had died by 24-month follow-up. All of these had been diagnosed with GDD prior to death. Ten of those that died had been diagnosed with DRE. Mortality was 8% among children classified as having DEE.
Aetiology and investigations
We identified an underlying aetiology in 211/390 patients (54%), and in 143/225 (64%) of those who presented in the first year of life. For 79 patients the underlying aetiology was already established prior to presentation with seizures. Although a total of 71 patients (18%) had a structural aetiology identified through neuroimaging, for 53 (75%) of these this had been identified before the presentation with seizures, including four of the six patients in the cohort diagnosed with tuberous sclerosis.
For those who did not have an established aetiology prior to presentation with seizures, 270/311 (87%) had gene panel testing, 216/311 (69%) had chromosomal microarray, and 267/311 (86%) brain MRI. The diagnostic yields for investigations instigated after presentation with seizures were: 82/270 (30%) for gene panel testing; 18/216 (8%) for chromosomal microarray, and 18/267 (7%) for brain MRI. The overall contribution of each testing modality to diagnostic yield is shown in Fig. 3, in which we have indicated whether aetiological diagnosis was made before or after presentation with seizures.
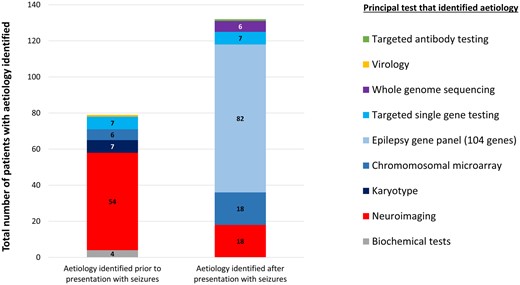
Diagnostic yield from investigations carried out before and after presentation with seizures. A 104 gene epilepsy panel provided the diagnosis for 39% of the total with aetiology, and for 63% of those whose investigations were initiated after presentation with seizures. Neuroimaging after presentation with seizures only provided an aetiological diagnosis in 9% of the total with aetiology.
Considering structural causes, the most common identified were: congenital brain malformation (n = 27 patients), white matter injury or intraventricular haemorrhage associated with preterm delivery (n = 10), hypoxic ischaemic perinatal injury (n = 10), perinatal stroke (n = 7), Sturge-Weber syndrome (n = 4), traumatic brain injury (n = 3), and brain tumour (n = 3).
The most common genetic causes were: PRRT2 (n = 17 patients), SCN1A (n = 12), KCNQ2 (n = 9), SLC2A1 (n = 8), tuberous sclerosis (TSC1 or TSC2) (n = 6), and trisomy 21 (n = 6).
Twenty-eight patients with no definitive aetiology after neuroimaging and gene panel testing underwent trio WGS.
Six patients had diagnostic results from WGS (Supplementary material). Diagnoses made through WGS were pathogenic SNVs in NEXMIF, CACNA1G, CHD4, POLR1A, NIPBL (all de novo), and CNTNAP1 (autosomal recessive). We analysed the WGS data for pathogenic CNVs and for rare intronic variants in established epilepsy genes, but did not find any. The aetiological spectrum of the more common epilepsy syndromes diagnosed in this cohort is presented in Fig. 4.
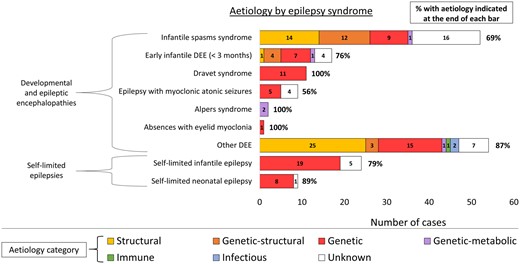
Aetiological spectrum of the more common epilepsy syndromes of early childhood, showing the total yield from aetiological investigations for each epilepsy syndrome. DEE = developmental and epileptic encephalopathy.
One hundred and thirty-three of 390 patients (34%) had an epilepsy with a defined genetic aetiology, including trisomies and pathogenic chromosomal microdeletions/duplications. The overall incidence of epilepsies with defined genetic aetiology was 178 per 100 000 live births (95% CI 66–93), or 1 per 952 live births.
Sixty-seven (66%) of all single gene diagnoses involved one of the nine most frequently implicated genes (PRRT2, SCN1A, KCNQ2, SLC2A1, TSC2, CDKL5, DEPDC5, PCHD19 and SLC6A1).
Univariate analysis of associations between clinical features, aetiology and outcome
We next considered the relationships between aetiology, clinical features at presentation, and outcome. In this study cohort, 24 months after initial presentation, we found that 139 children had DRE (36%) and 193 had GDD (49%). A further 26 children (7%) had behavioural problems, motor disorder, speech and language delay, or features of autism spectrum disorder but did not satisfy the criteria for a diagnosis of GDD. An aetiology was identified in 114/139 (82%) patients with DRE, and in 144/193 (75%) of patients with GDD.
On univariate analysis, using a P-value of <0.001 to correct for multiple testing, we determined that presentation with seizures <12 months and identification of genetic aetiology were both associated with DRE. Presentation with epileptic spasms and identification of structural aetiology were both associated with GDD (Table 2).
Univariate analysis of associations between presenting seizure, age at presenting seizure, deprivation, aetiology, and DRE, GDD and mortality
| Total | DRE | P-value; OR (95% CI) for DRE | GDD | P-value; OR (95% CI) for GDD | Death | |
|---|---|---|---|---|---|---|
| Sex | ||||||
| Male | 207 | 74 (36%) | n.s. | 104 (50%) | n.s. | 6 (3%) |
| Female | 183 | 65 (36%) | n.s. | 89 (49%) | n.s. | 7 (4%) |
| Presenting seizure classification | ||||||
| Generalized seizure | 140 | 35 (25%) | 0.0013; 0.47 (0.30–0.74)# | 47 (34%) | 0.000003; 0.36 (0.24–0.55)## | 3 (2%) |
| Generalized tonic-clonic seizure | 97 | 22 (23%) | 30 (31%) | 1 (1%) | ||
| Myoclonic seizure | 22 | 7 (32%) | 9 (41%) | 0 (0%) | ||
| Absence seizure | 10 | 2 (20%) | 3 (30%) | 0 (0%) | ||
| Tonic seizure | 8 | 2 (25%) | 3 (38%) | 2 (25%) | ||
| Atonic seizure | 3 | 2 (67%) | 2 (67%) | 0 (0%) | ||
| Focal seizure | 193 | 75 (39%) | n.s. | 100 (52%) | n.s. | 9 (5%) |
| Epileptic spasms | 52 | 27 (52%) | 0.012; 2.18 (1.20–3.93)* | 42 (81%) | 0.0000023; 4.92 (2.39–10.15)** | 1 (2%) |
| Unclassified seizure | 5 | 2 (40%) | n.s. | 4 (80%) | n.s. | 0 (0%) |
| Age at second unprovoked seizure | ||||||
| <12 months | 225 | 97 (43%) | 0.00040; 2.22 (1.43–3.44)** | 122 (54%) | 0.032; 1.57 (1.05–2.35)* | 10 (4%) |
| 12–24 months | 91 | 21 (23%) | 0.0057; 0.46 (0.27–0.79)# | 37 (41%) | n.s. | 2 (2%) |
| 24–36 months | 74 | 21 (28%) | n.s. | 34 (46%) | n.s. | 1 (1%) |
| SIMD quintile | ||||||
| 1 (highest deprivation) | 122 | 48 (39%) | n.s. | 61 (50%) | n.s. | 4 (3%) |
| 2 | 81 | 28 (34%) | n.s. | 40 (50%) | n.s. | 1 (1%) |
| 3 | 65 | 19 (30%) | n.s. | 30 (46%) | n.s. | 2 (3%) |
| 4 | 66 | 23 (35%) | n.s. | 28 (42%) | n.s. | 3 (5%) |
| 5 (lowest deprivation) | 56 | 21 (38%) | n.s. | 34 (61%) | n.s. | 3 (5%) |
| Aetiological classification | ||||||
| Genetic (only) | 100 | 54 (54%) | 0.000012; 2.83 (1.77–4.52)** | 59 (59%) | 0.028; 1.68 (1.06–2.66)* | 2 (2%) |
| Genetic-structural | 27 | 14 (52%) | n.s. | 24 (89%) | 0.000013; 9.18 (2.72–31.04)** | 3 (10%) |
| Genetic-metabolic | 4 | 3 (75%) | n.s. | 4 (100%) | n.s. | 4 (100%) |
| Genetic-metabolic-structural | 2 | 2 (100%) | n.s. | 1 (50%) | n.s. | 1 (50%) |
| Structural (only) | 71 | 37 (52%) | 0.0017; 2.32 (1.37–3.90)* | 53 (75%) | 0.0000030; 3.76 (2.11–6.71)** | 1 (1%) |
| Structural-metabolic | 3 | 1 (33%) | n.s. | 1 (33%) | n.s. | 0 (0%) |
| Structural-infectious | 2 | 2 (100%) | n.s. | 2 (100%) | n.s. | 0 (0%) |
| Metabolic only | 1 | 0 (0%) | n.s. | 0 (0%) | n.s. | 0 (0%) |
| Structural-immune | 1 | 1 (100%) | n.s. | 1 (100%) | n.s. | 0 (0%) |
| Unknown | 179 | 25 (14%) | 7.07 × 10⁻¹⁷; 0.14 (0.084–0.23)## | 48 (27%) | 7.96 × 10⁻¹⁷; 0.17 (0.11–0.26)## | 3 (2%) |
| Outcome by 24 months after presentation | ||||||
| DRE | 139 | 116 (83%) | 1.23 × 10⁻²⁴; 11.40 (6.76–19.20)** | 10 (7%) | ||
| GDD | 193 | 116 (60%) | 1.23 × 10⁻²⁴; 11.40 (6.76–19.20)** | 13 (7%) | ||
| Total | 390 | 139 (36%) | 193 (49%) | 13 (3%) | ||
Probabilities based on Fisher’s Exact probability test (two-tailed). n.s. = not significant.
Positive association, significant using a P-value < 0.05.
Positive association, significant using a P-value of <0.001 (corrected for multiple testing × 50).
#Negative association, significant using a P-value < 0.05.
##Negative association, significant using a P-value of <0.001 (corrected for multiple testing × 50).
The strongest association with good outcome was the failure to identify any aetiology, despite extensive investigation (Table 2). Of the 180 children with unknown aetiology 25 (14%) had DRE, and 49 (27%) had GDD, at 24-month follow-up.
A group of patients with particularly good outcomes was those who presented with generalized tonic-clonic seizures and who had no identifiable aetiology. Among 62 such patients, three (5%) had DRE and nine (15%) had GDD.
Even among children presenting with infantile spasms, a presentation with typically guarded prognosis, a significant association between aetiology and outcome was observed. Fifty-two children presented with infantile spasms, 38 (73%) of whom had an aetiology identified (15 structural, 13 structural-genetic, 10 genetic, one metabolic-genetic). Among those with aetiology, 33 (87%) had GDD and 23 (61%) had DRE. Among those without aetiology, 9/14 had GDD (64%) and 4/14 (29%) had DRE. The difference in frequency of DRE was statistically significant [Fisher’s exact test, P = 0.04, OR 3.8 (95% CI 1.0–14.5)] but the difference in frequency of GDD was not (Fisher’s exact test, P > 0.1). A more sensitive study with larger numbers would be required to determine the influence of aetiology on developmental outcomes in patients with infantile spasms.
There was a very strong association between DRE and GDD (OR 11.40, 95% CI 6.76–19.20). We therefore considered whether DRE was on the causal pathway between aetiology and GDD. Two possible explanations may explain this relationship. It may be that common factors, primarily underlying aetiology, strongly determine both these outcomes. Alternatively, it may be that frequent seizures in the DRE population directly lead to GDD. To exclude known aetiology as a confounder in this relationship we looked at the relationship between DRE and GDD in the group of children without aetiology identified (n = 179). In this group, 25 children had DRE, of whom 19 (76%) had GDD. Among the 154 children without DRE, 29 had GDD (19%). The association between DRE and GDD remained significant in this group (OR 16.4, 95% CI 5.6–47.5). These data confirm that known aetiology is not the only determinant of developmental outcome in young children with epilepsies, and suggest that frequent epileptic seizure activity may contribute to adverse developmental outcome.
Multivariate analysis
We constructed binomial regression models including as independent variables all the features that were found to be associated with either DRE or GDD in the univariate analysis. These were: age at presentation, seizure type at presentation, and whether any aetiology had been identified. Age in days was coded as a continuous variable. Seizure type was coded as a binary variable (‘generalized seizure’ versus ‘focal seizure or spasms’). Aetiology was coded as a binary variable (‘aetiology identified’ versus ‘no aetiology identified’). Both DRE and GDD were coded as binary variables (‘present’ versus ‘absent’). We then carried out sequential binomial multivariate regression analyses with seizure type, aetiology, DRE and GDD as dependent variables, respectively (Table 3). In Fig. 5, we have graphically represented the strength of associations between age at presentation, seizure type, aetiology, DRE and GDD. The width of each arrow is proportional to the Wald statistic in the regression model to represent the strength of association. The strongest association was between DRE and GDD. Neither presenting seizure type, nor age at presentation with seizures, was associated with either DRE or GDD at 24 months. Identification of aetiology was weakly associated with age at presentation and seizure type and was strongly associated with both DRE and GDD. These findings suggest that aetiology is the primary determinant of both DRE and GDD in epilepsy, and that the relationships between age at presentation and seizure type and DRE/GDD observed in the univariate analyses are most likely to be confounded by dependency of these variables on aetiology. In the multivariate analysis, the presence of known aetiology was associated with an OR for GDD of 3.4 (95% CI 2.1–5.7) and an OR for DRE of 3.9 (95% CI 2.2–7.0). The presence of DRE was associated with an OR of GDD of 7.2 (95% CI 4.2–12.5).
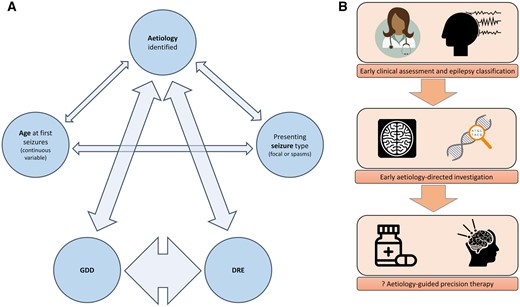
(A) Correlation network, demonstrating interrelationships between aetiology, age, seizure type, GDD and DRE. Thickness of arrow represents strength of relationship (Wald statistic on binomial regression model). Outcomes were strongly determined by aetiology. (B) Early identification of aetiology may allow prompt initiation of aetiology directed therapy and thereby improve outcomes.
Multivariate analysis of associations between presenting seizure type, age at presenting seizure, aetiology, DRE, and GDD
| Dependent variable | Covariates | Wald statistic | P-value | OR (95% CI) |
|---|---|---|---|---|
| GDD | Age at presentation, days | 0.18 | 0.668 | No significant association |
| Identification of aetiology | 22.6 | 0.000* | 3.4 (2.1–5.7) | |
| Focal seizures or spasms | 4.5 | 0.033 | No significant association | |
| DRE | 50.0 | 0.000* | 7.2 (4.2–12.5) | |
| DRE | Age at presentation, days | 3.3 | 0.069 | No significant association |
| Identification of aetiology | 22.5 | 0.000* | 4.0 (2.2–7.0) | |
| Focal seizures or spasms | 0.03 | 0.860 | No significant association | |
| GDD | 50.4 | 0.000* | 7.3 (4.2–12.7) | |
| Focal seizures or spasms | Age at presentation, days | 9.0 | 0.003* | 1.001 (1.000–1.002) |
| Identification of aetiology | 10.3 | 0.001* | 2.3 (1.4–3.7) | |
| DRE | 0.006 | 0.936 | No significant association | |
| GDD | 4.5 | 0.034 | No significant association | |
| Identification of aetiology | Age at presentation, days | 7.4 | 0.006* | 1.001 (1.000–1.002) |
| Focal seizures or spasms | 10.3 | 0.001* | 2.2 (1.4–3.7) | |
| DRE | 22.1 | 0.000* | 4.0 (2.4–7.1) | |
| GDD | 22.8 | 0.000* | 3.4 (2.2–5.7) |
Positive association, significant using a P-value of <0.0125 (corrected for multiple testing × 4)
Discussion
Through this prospective cohort study, involving the entire population of Scotland, we have been able to accurately describe the epidemiology of the early childhood epilepsies in an economically developed country with access to modern diagnostic technologies. There are low levels of consanguinity in this population, and access to universal healthcare is good. These data will be applicable to other countries with similar demography.
We used two sources to identify children with epilepsies, and employed capture-recapture methodology to improve the accuracy of our incidence estimates. Two-source capture-recapture methodology rests on the assumption that the two sources are fully independent. If there is a positive interaction between the two sources (being identified by one source is associated with an increased likelihood of being identified by the other source) then capture-recapture figures will underestimate. If there is a negative interaction between the two sources (being identified by one source is associated with a decreased likelihood of being identified by the other source) then the capture-recapture figures will overestimate. Negative interactions may occur in studies where multiple individuals are involved in notifying cases and these individuals have knowledge about which cases have already been reported. Positive interactions occur where one or more characteristics of a case increases the likelihood that multiple sources will identify them. Since our EEG case record review was done retrospectively and was not influenced by which cases had been prospectively recruited, we would not expect a negative interaction. We cannot exclude a positive interaction since it is conceivable that recruiting clinicians may have been more aware of patients who had undergone EEG. However, it is standard practice, and reflected in Scottish national standards of care, that all children diagnosed with epilepsy should have an EEG. In view of the possibility of a small positive interaction between the two sources, our incidence figures would best be considered minimum incidence figures.
In a previous paper published in Brain in 201917 we reported the genetic findings from a cohort that overlapped with that presented in this paper. In the 2019 study we used prospective population-based methodology to describe the incidence and phenotypic spectrum of the most common single gene epilepsies of early childhood, including PRRT2, SCN1A, KCNQ2 and SLC2A1. The key methodological differences between the 2019 cohort and the present one are as follows. First, in the present study we have only included children who presented with epilepsies (i.e. two or more unprovoked and afebrile seizures) during the period 8 May 2014 to 7 May 2017. Second, we included children who already had an identified aetiology at the time that they presented with seizures. Third, as well as using the prospective recruitment strategy via paediatricians and paediatric neurologists, we employed a second independent case ascertainment strategy by reviewing records of all children who had been investigated using EEG. Finally, we took genetic investigation further in the present study, by reporting the results of karyotype and chromosomal microarray, and by offering trio WGS to families of children with DRE of unknown aetiology (n = 28). We have extended the data capture in the present study. We include socio-demographic information using the SIMD, and report information on seizure control, developmental progress, and epilepsy classification 2 years after initial presentation for each participant. The present study therefore gives comprehensive incidence estimates for all epilepsies of early childhood, and references these figures to aetiology, epilepsy syndrome classification, and outcomes.
In common with other studies, we have shown that the epilepsies have a higher incidence in less economically advantaged groups of society,19,20 but have for the first time extended this finding to the early childhood-onset group. The fact that socio-economic status is associated with epilepsy incidence at such an early stage in life supports the conclusion that this trend is observed because low socio-economic status is a risk factor for epilepsies (social causation) rather than because epilepsies influence socio-economic prospects (social drift).19 Subgroup analysis of our cohort revealed that the association between deprivation and incidence was observed among those who had epilepsies without aetiology but not among those with aetiology. We therefore conclude that the increased incidence of epilepsies observed in the more disadvantaged populations is not explained by an increased burden of identifiable genetic causes, nor an increased burden of structural causes such as hypoxic ischaemic encephalopathy, leukomalacia from preterm delivery, or traumatic brain injury. This leaves us with a theory that these populations may have increased multifactorial risk for epilepsies. Potential components of such multifactorial risk could include early life stress,21,22 maternal smoking,23,24 and polygenic risk.25-27 Exploration of these risk factors, and their relationship to both epilepsies and socio-economic deprivation are important avenues for further research, and have implications for resource management within health systems.
In this study the incidence of epilepsies presenting in the first year of life was 136 per 100 000 live births (95% CI 120–155), and in the first 3 years of life was 239 per 100 000 live births (95% CI 216–263). Using two independent sources of case-capture, we were able to estimate the number of missing cases in this population, which was 15 (4%). Previous estimates for the incidence of epilepsies in the first year of life have all involved smaller denominator populations than the present study, and figures have ranged between 83 per 100 000 and 144 per 100 0009,28–32 In a 30-year retrospective review of a cohort within the Rochester Epidemiology study (1980–2009, n = 127) the incidence of epilepsies with onset in the first 3 years of life was estimated to be 163 per 100 000 live births.10 We are likely to have identified higher incidences of early life epilepsies than previous studies due to our prospective recruitment strategy. This resulted in greater inclusion of patients with self-limited epilepsies, as evidenced by the high rate of PRRT2-associated epilepsies in this cohort. Importantly, given advances in genetic and neuroimaging technology, none of the previously published cohorts provide data on the extent to which participants were investigated for aetiology, thereby limiting conclusions that can be drawn on the relationship between aetiology and outcome. In our cohort, a proactive approach to aetiological investigation was taken, allowing an aetiology to be determined in 54% of cases. If aetiology was not already known at the time of presentation with seizures, clinicians had access to a 104 gene epilepsy panel. Uptake of gene panel testing was 81%, and positive diagnostic yield from this investigation was 33%. The most commonly identified genetic aetiology in our cohort was PRRT2 (17 cases, 4% of the cohort). No other epilepsy cohort that has been subjected to systematic genetic testing has implicated PRRT2 in such a high proportion of cases. In a study based in the USA, Lindy et al.33 reported 59 cases of PRRT2-associated epilepsy among a cohort of 8565 patients (0.7%). Since PRRT2-associated epilepsy is associated with a good outcome in nearly all cases, there is little selection pressure on this gene, and in 71% of cases in our study the variant was inherited.17 It is possible that epilepsy-associated PRRT2 variants are more prevalent in the Scottish population than other populations. However, the recurrent variant that we found in >75% (13/17) of PRRT2 cases, c.649dup, p.Arg217Profs*8, has also been frequently reported in other populations.34,35 We think the more likely explanation for the high incidence of PRRT2 variants in our study is that we present an unselected cohort of children with early onset epilepsies, which includes those with mild phenotypes. Other cohorts investigating genetic testing may have been relatively depleted of patients with PRRT2-associated seizures, since nearly all these children have a self-limited epilepsy phenotype.
The most common epilepsy syndrome in this cohort was infantile spasms syndrome. Early recognition and treatment of infantile spasms is important since there is a significant positive correlation between treatment delay and adverse outcome.36
The strongest determinant of outcomes 24 months after presentation was the identification of an aetiology. The relationship between aetiology and outcome is in fact more nuanced than this, since certain genetic aetiologies, most notably PRRT2 gene variants, are associated with a very good prognosis.17 Where extensive diagnostic testing is performed, families of children for whom no aetiology can be identified can be reassured that the prognosis is generally good for both seizure control and development.
That outcome is principally determined by aetiology has important implications when considering therapy development for the epilepsies. The vast majority of those with either DRE or GDD in this cohort had an identifiable aetiology. Aetiology-directed therapy is already a reality in a number of childhood-onset genetic epilepsies,37,38 and there is emerging evidence that early initiation of appropriate therapy may improve not only seizure control, but also cognitive outcome.39 Dravet syndrome, associated with de novo pathogenic SCN1A variants, was the most common drug-resistant genetic epilepsy in this cohort. The evidence for efficacy of the recently repurposed drug fenfluramine is highly encouraging in this condition.7 For parents of children affected by severe epilepsies, cognitive and behavioural comorbidities may be stronger determinants of quality of life than seizure frequency.40–42 It is important that therapeutic trials look at more holistic outcomes than purely seizure control,37 as exemplified by the ICISS trial for children with infantile spasms syndrome.43 Gene-corrective therapies have already entered the clinical domain for a number of severe neurological disorders of early childhood44 and are rapidly being developed for the epilepsies. Appraisal of their efficacy will be dependent on good quality prospective epidemiological data.
Conclusions
One in 400 children will be diagnosed with an epilepsy before their third birthday. There is a clear social gradient to the incidence of early childhood epilepsies, meaning that greater epilepsy-related resources will be required in regions with high deprivation.
With modern neuroimaging and genetic techniques an aetiology can be identified in more than 50% of patients. Genetic epilepsies comprise the largest aetiological group. Identification of aetiology strongly correlates with outcomes, in terms of both seizure control and development.
Acknowledgements
The Royal Hospital for Children, Glasgow and the John Radcliffe Hospital, Oxford are centres for EpiCARE the European Reference Network for Complex and Rare Epilepsies.
Funding
This research was supported by grants from Dravet Syndrome UK, Epilepsy Research UK, Glasgow Children’s Hospital Charity, and UCB Pharma.
Competing interests
J.D.S. has received honoraria for presenting at educational events from Nutricia. M.A., M.P. and I.C. are employees of UCB Pharma. A.B. and A.M. have received honoraria for presenting at educational events, consultancy work and advisory boards by UCB, LivaNova and Eisai. M.O. Has received a travel grant from Clinigen and received honoraria from Nutricia for presenting at educational events. H.A. is a former employee of UCB, managing partner of SV Health Managers LLP and director of: Weatherden, Zarodex Therapeutics, Enara Therapeutics, Trex Bio, Karus Therapeutics, Alcamab, Catamaran Bio, Imbria Director, Cellinta, and Mestag. J.C.K. has received research grant funding from Janssen. S.M.Z. has received honoraria for presenting at educational events, advisory boards and consultancy work for GW Pharma, Zogenix, Biocodex, Encoded Therapeutics, Nutricia. All other authors report no competing interests.
Supplementary material
Supplementary material is available at Brain online.
References
National Records of Scotland. Accessed 11 March 2020. https://www.nrscotland.gov.uk/
Scottish Index of Multiple Deprivation. Accessed 11 March 2020. www2.gov.scot/Topics/Statistics/SIMD
- DRE
drug-resistant epilepsy
- GDD
global developmental disability
- SIMD
Scottish Index of Multiple Deprivation
Author notes
Joseph D Symonds and Katherine S Elliott authors contributed equally to this work.

