


Abstract
To examine the length of a hexanucleotide expansion in C9orf72, which represents the most frequent genetic cause of frontotemporal lobar degeneration and motor neuron disease, we employed a targeted amplification-free long-read sequencing technology: No-Amp sequencing. In our cross-sectional study, we assessed cerebellar tissue from 28 well-characterized C9orf72 expansion carriers. We obtained 3507 on-target circular consensus sequencing reads, of which 814 bridged the C9orf72 repeat expansion (23%). Importantly, we observed a significant correlation between expansion sizes obtained using No-Amp sequencing and Southern blotting (P = 5.0 × 10⁻⁴). Interestingly, we also detected a significant survival advantage for individuals with smaller expansions (P = 0.004). Additionally, we uncovered that smaller expansions were significantly associated with higher levels of C9orf72 transcripts containing intron 1b (P = 0.003), poly(GP) proteins (P = 1.3 × 10− 5), and poly(GA) proteins (P = 0.005). Thorough examination of the composition of the expansion revealed that its GC content was extremely high (median: 100%) and that it was mainly composed of GGGGCC repeats (median: 96%), suggesting that expanded C9orf72 repeats are quite pure. Taken together, our findings demonstrate that No-Amp sequencing is a powerful tool that enables the discovery of relevant clinicopathological associations, highlighting the important role played by the cerebellar size of the expanded repeat in C9orf72-linked diseases.
Introduction
We sought to elucidate whether the size of a C9orf72 repeat expansion associates with clinicopathological features of the diseases it causes, namely frontotemporal lobar degeneration (FTLD) and motor neuron disease (MND).1,2 The presence of an expanded C9orf72 repeat probably triggers these fatal neurodegenerative diseases due to three mutually inclusive mechanisms: (i) loss of C9orf72 expression; (ii) production of faulty RNA transcripts that form RNA foci; and (iii) aggregation of dipeptide repeat proteins translated from the expansion.1,3,4
To assess the length of the repeat in C9orf72, one could perform Southern blots. Southern blotting, however, is time-consuming and challenging.5 Consequently, other methods have been explored. One study, for instance, developed a software tool called ExpansionHunter to detect repeat expansions in short-read PCR-free whole-genome sequencing data.6 Although this tool correctly classified expansion carriers, it encountered difficulties reconstructing the expansion, possibly because of sequencing errors, misalignment, and/or GC bias. Because long-read sequencing has the ability to span the entire expansion, this approach could tackle some of these issues. Indeed, long-read whole-genome sequencing methods developed by Pacific Biosciences and Oxford Nanopore Technologies have been shown to capture the C9orf72 expansion.7,8 Nonetheless, the number of reads bridging this expansion is generally fairly low. Given our interest in the C9orf72 repeat expansion, we also investigated targeted amplification-free long-read sequencing technologies. One of these technologies, No-Amp sequencing (Pacific Biosciences), leverages CRISPR-Cas9 for target-specific enrichment. This technology has already been used to evaluate repeat expansions in several genes, such as HTT and TCF4.9,10 Moreover, in our proof-of-concept study, we demonstrated that No-Amp sequencing can cover the C9orf72 repeat expansion.7 Thus, we decided to use No-Amp sequencing to measure the repeat length in well-characterized C9orf72 expansion carriers, which did not only allow us to validate this technology, but also to discover relevant clinicopathological associations.
Materials and methods
Patient selection
In our cross-sectional study, we included 28 fully characterized C9orf72 expansion carriers for whom frozen tissue from the cerebellar vermis was available in the Mayo Clinic Florida Brain Bank (Table 1; IRB ID:15-009452) and for whom high-molecular-weight genomic DNA could be extracted. Patients received a primary pathological diagnosis of FTLD (n = 9), MND (n = 11), mixed pathology (FTLD/MND; n = 7), or Alzheimer’s disease (n = 1). Of these patients, 50% were female, the median age at onset was 63 years [interquartile range (IQR): 56–67], the median age at death was 68 years (IQR: 61–72), and the median survival after onset was 3 years (IQR: 2–6). Detailed information about C9orf72-mediated features was collected for these patients (Table 1).11,-14 Of note, all autopsies were obtained after consent by the legal next-of-kin or someone legally authorized to make this decision, and they were performed with the explicit assumption that tissue would be used for both diagnostic evaluation and research.
Characteristics of C9orf72 expansion carriers
| Variable | Expansion carriers (n = 28) |
|---|---|
| Sex, n (% female) | 14 (50.00) |
| Age at onset, median (IQR), y | 63.40 (56.48–66.50) |
| Age at death, median (IQR), y | 67.65 (60.98–72.43) |
| Survival after onset, median (IQR), y | 3.35 (2.18–5.60) |
| Expression, median (IQR), % | 56.65 (41.68–66.22) |
| Methylation, median (IQR), % | 1.50 (0.80–3.45) |
| Poly(GP), median (IQR), ng/mg | 2707 (1718–4279) |
| Poly(GA), median (IQR), ng/mg | 10830 (9258–12 202) |
| Sense RNA foci, median (IQR), % | 21.37 (14.86–27.85) |
| Antisense RNA foci, median (IQR), % | 1.10 (0.92–2.19) |
| Repeat length, median (IQR) | 1558 (1358–1833) |
Data are sample median (IQR) or n (%) unless otherwise stated. Information is available for all C9orf72 expansion carriers (n = 28), except for poly(GA) levels (n = 27), as well as sense and antisense RNA foci (n = 27). The expression levels of total C9orf72 transcripts are displayed in this table; they are presented as expression levels relative to the median of controls (100%). Methylation levels signify the percent DNA resistance to digestion as a measure of DNA methylation of the C9orf72 promoter. Total levels of poly(GP) and poly(GA) are shown, combining levels from RIPA-soluble and RIPA-insoluble fractions. The RNA foci burden specifies the percentage of cerebellar granule cells harbouring RNA foci. Repeat lengths are estimates of the most abundant expansion species based on Southern blotting.
Repeat length estimation
The presence of a C9orf72 repeat expansion was determined using a two-step protocol, including a fluorescent PCR fragment-length analysis and a repeat-primed PCR, as specified elsewhere.1,15 The size of the C9orf72 expansion was estimated using our previously described Southern blot protocol (Supplementary Fig. 1).5
No-Amp sequencing
We employed a targeted long-read sequencing strategy to assess a region containing the C9orf72 repeat expansion (Supplementary Fig. 2). High-molecular-weight genomic DNA was extracted from the cerebellum using the RecoverEase DNA Isolation Kit (Agilent Technologies), according to the manufacturer’s protocol. At Mayo Clinic’s Genome Analysis Core, DNA was enriched for C9orf72 repeat-containing SMRTbellTM templates using Pacific Biosciences’ No-Amp targeted sequencing method (v3); up to 10 µg of DNA was used for each sample. A SMRTbell library was prepared after treating DNA with recombinant shrimp alkaline phosphatase, Klenow, and dideoxynucleotides to prevent fragment ends from participating in downstream ligation steps. DNA was then digested using sense and antisense CRISPR RNA plus trans-activating CRISPR RNA along with the Cas9 enzyme to excise the area of interest. The digested DNA was subsequently ligated using blunt adapters and T4 DNA ligase at 16°C for 2 h to form SMRTbell templates. Products that were not ligated, or that were partially ligated, were reduced using a five-enzyme exonuclease digestion at 37°C for 2 h. Removal of the exonuclease enzymes was performed using a trypsin treatment at 37°C for 20 min, followed by two AMPure® PB bead purifications (Pacific Biosciences). The library then went through annealing of primer V4 at 20°C for 1 h and binding of Sequel® II DNA polymerase 2.0 at 30°C for 4 h. Each SMRTbell library was sequenced on a Pacific Biosciences Sequel II with Sequel II 2.0 chemistry. Importantly, a separate SMRT Cell (8M) was used for each sample. A 1-h extension, 4-h immobilization, and 30-h movie time were used.
Bioinformatic analysis
Data were analysed using Pacific Biosciences’ pipeline with modifications for long repeats (Supplementary material), following the command-line instructions. Briefly, to generate circular consensus sequencing reads with the pbccs package (v4.2.0), two strategies were used. For examination of the repeat length, reads were kept with at least one pass and a minimal predicted accuracy of 80%. A more stringent threshold was used to assess interruptions; for this purpose, only reads with seven or more passes and a minimal predicted accuracy of 99% were kept. Reads were subsequently aligned to the human reference genome (GRCh38) with an extension for the pbmm2 package (v1.2.1). The number of on-target zero-mode waveguides was then counted and coverage plots were generated. With K-means clustering of sequence kmer counts, reads in our region of interest (chr9:27,573,437–27,573,598) were divided into two clusters: one for the non-expanded allele and another for the expanded allele. Only reads containing 100 nucleotides flanking our region of interest (on both sides of the repeat) were included, thereby restricting our analysis to reads spanning the entire expansion. Next, waterfall plots were created and motifs counted to assess the presence of interruptions. A custom python script was used to investigate the length and purity of the C9orf72 expansion further, specifically evaluating expanded alleles from the first to the last occurrence of a GGGGCC repeat. Additional figures were obtained using the Integrative Genomics Viewer (v2.8.2) and a custom R Markdown script.
Statistical analysis
We summarized data with the median and IQR. As appropriate for a given variable, a Spearman’s test of correlation, a Kruskal-Wallis rank sum test, a Wilcoxon rank sum test, a paired Wilcoxon signed rank test, or a Cox proportional hazards regression model was used. For our survival after onset analysis, a dichotomous categorical variable with the median (50th percentile) as cut-off point was used, adjusting our model for disease subgroup (FTLD, FTLD/MND, or MND) and age at onset. Of note, when multiple reads were available for a given individual, the mean expansion size, GC content, percentage of GGGGCC repeats and other motifs were calculated for those reads; this strategy was also employed to estimate the expansion size when multiple Southern blots were available for an individual.5 When missing data were present for a particular variable (Table 1), individuals with missing data were excluded from analyses involving that specific variable. For each group of similar tests, P-values were adjusted for multiple testing using a false discovery rate procedure16; associations with a false discovery rate below 5% were considered statistically significant. All statistical tests were two-sided and performed using R Statistical Software (R Foundation for Statistical Computing; v3.6.3).
Data availability
The authors confirm that the data supporting the findings of this study are available within the article, in its Supplementary material, and/or from the corresponding author upon reasonable request.
Results
We performed No-Amp targeted sequencing on 28 C9orf72 expansion carriers. In total, we obtained 3507 circular consensus sequencing reads. Of those reads, 2693 covered the wild-type allele (77%) with a median number of wild-type reads of 73 per sample (IQR: 46–119). The wild-type allele ranged from 2 to 11 repeats. In all individuals, the number of repeats on the wild-type allele was identical to that measured by fluorescent PCR (100%). The expanded allele was detected in 814 reads (23%) with a median number of expanded reads of 22 per sample (IQR: 15–35). Our analysis demonstrated variability in the cerebellar size of the expansion, varying between 3.2 kb (∼500 repeats) and 21.5 kb (∼3500 repeats; Fig. 1A). The median expansion size in these subjects was 1261 repeats (IQR: 1087–1381).
![C9orf72 expansion size as determined by long-read sequencing. (A) A histogram is displayed showing the expansion size of all 814 expanded reads obtained using No-Amp sequencing for C9orf72 expansion carriers included in this study (n = 28). The number of repeats ranges from approximately 500 to 3500. The dashed grey line denotes the median (1261 repeats) of the expansion size estimates for each individual. (B) A significant correlation exists between the number of repeats as measured by No-Amp sequencing and Southern blotting. Each C9orf72 expansion carrier is symbolized by a filled circle; the colour is an indication of the number of reads for a given individual [from low (dark blue) to high (dark red)]. The solid grey line denotes the linear regression line. (C) The expansion size determined by No-Amp sequencing (light blue) is compared to that determined by Southern blotting (dark blue). (D) When using the median expansion size as a cut-off point, smaller expansions (light blue) appear to be associated with a higher number of reads as compared to longer expansions (dark blue). For each box plot, the median is represented by a solid black line, each box spans the interquartile range (IQR; 25th percentile to 75th percentile), and every individual is visualized as a filled circle.](https://oup.silverchair-cdn.com/oup/backfile/Content_public/Journal/brain/144/4/10.1093_brain_awab006/3/m_awab006f1.jpeg?Expires=1750669517&Signature=Nsihh5nA2YPwdhlzNkf~ldfwfzPkWaCd4wbheshIhpAtbUAhqOoHtv59rWLvh6z4i1-8Y-VeWrpKlWll~h4fRFrV7RRFXjQ4xxlzvQ9SCtjFaoyvkexSx4cecWXr0vOp6DNkFGKWcM-Sj~ORANsF~du7lqh9WNN6NYGeW4EaENtJ56ov14hFLn~73g-sXstjYBYe6vgeaK~ktya9JBTWEeKeCF5N3~k67pDrjCJzzgcLtoftSlCyGVre23zccerjBj1nMwl1rda~kSnGOY0eIaJAH1Pd5dUpMIvHhLXpuJ1bcEHUmL4ABWXBw~G8I8zeNCw4Md693BmWm1Fto9b9Lg__&Key-Pair-Id=APKAIE5G5CRDK6RD3PGA)
C9orf72 expansion size as determined by long-read sequencing. (A) A histogram is displayed showing the expansion size of all 814 expanded reads obtained using No-Amp sequencing for C9orf72 expansion carriers included in this study (n = 28). The number of repeats ranges from approximately 500 to 3500. The dashed grey line denotes the median (1261 repeats) of the expansion size estimates for each individual. (B) A significant correlation exists between the number of repeats as measured by No-Amp sequencing and Southern blotting. Each C9orf72 expansion carrier is symbolized by a filled circle; the colour is an indication of the number of reads for a given individual [from low (dark blue) to high (dark red)]. The solid grey line denotes the linear regression line. (C) The expansion size determined by No-Amp sequencing (light blue) is compared to that determined by Southern blotting (dark blue). (D) When using the median expansion size as a cut-off point, smaller expansions (light blue) appear to be associated with a higher number of reads as compared to longer expansions (dark blue). For each box plot, the median is represented by a solid black line, each box spans the interquartile range (IQR; 25th percentile to 75th percentile), and every individual is visualized as a filled circle.
Importantly, there was a significant correlation between estimates obtained using No-Amp sequencing and Southern blotting [P = 5.0 × 10⁻⁴, r: 0.61, 95% confidence interval (CI): 0.26 to 0.83; Fig. 1B]. The number of repeats as determined by No-Amp sequencing, however, was significantly lower than that determined by Southern blotting (P = 5.0 × 10⁻⁶; Fig. 1C), which demonstrated a median repeat length of 1558 (IQR: 1358–1833; Table 1). This seems to suggest that there might be a bias towards smaller expansions when using No-Amp sequencing. To investigate this hypothesis, we split our subjects into two groups based on the median of our No-Amp sequencing data. In individuals with less than 1261 repeats, the median number of reads was 32 (IQR: 20–56), whereas it was 17 (IQR: 13–29) in individuals with longer repeats, which resulted in a significant difference (P = 0.048; Fig. 1D).
Clinicopathological associations
Previously, in a Southern blot study, we described that patients with smaller C9orf72 repeat expansions in the cerebellum demonstrated prolonged survival after onset.5 Indeed, our repeat length estimates based on No-Amp sequencing were significantly associated with survival after onset (P = 0.004, hazard ratio: 3.7, 95% CI: 1.5 to 9.0; Table 2), when adjusting for disease subgroup and age at onset. Patients with a smaller expansion size (bottom 50%) demonstrated a median survival after onset of 4.9 years (IQR: 3.2–9.6) as compared to 1.8 years (IQR: 1.6–3.1) in patients with a longer repeat expansion (top 50%; Fig. 2A). Notably, a similar association was obtained without adjustment for potential confounders (P = 0.005, hazard ratio: 3.3, 95% CI: 1.4 to 7.8).
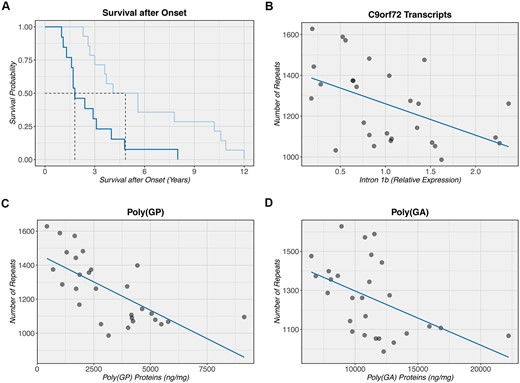
Clinicopathological associations with C9orf72 expansion size. (A) A Kaplan-Meier curve is shown when comparing the bottom 50% (light blue) to the top 50% (dark blue), depending on the size of the C9orf72 repeat expansion. Individuals with a smaller expansion seem to demonstrate an increased survival after onset (median: 4.9 years) as compared to individuals with a longer expansion (median: 1.8 years). The black dashed line denotes the median for each group. Of note, since only one individual received a primary diagnosis of Alzheimer’s disease, this individual was excluded from our survival analysis where we adjusted for disease subgroup as well as age at onset. (B–D) An inverse correlation is detected between the number of repeats as measured by No-Amp sequencing and C9orf72 transcripts containing intron 1b (downstream of the expansion), total poly(GP) protein levels, and total poly(GA) protein levels, respectively. Each C9orf72 expansion carrier is symbolized by a filled circle. The solid dark blue line denotes the linear regression line. Notably, a non-parametric Spearman’s test of correlation was used to assess these correlations, which is based on rank and less sensitive to outliers than parametric equivalents of this test.
Associations of C9orf72 expansion size with clinicopathological features
| Variable | P-value | Association | Confidence | FDR |
|---|---|---|---|---|
| P-value | HR | 95% CI | FDR | |
| Survival after onset | 0.004 | 3.69 | 1.51 to 9.04 | 0.02 |
| P-value | r | 95% CI | FDR | |
| Total transcripts | 0.03 | −0.41 | −0.69 to −0.03 | 0.09 |
| Variant 1 | 0.04 | −0.39 | −0.71 to 0.02 | 0.10 |
| Variant 2 | 0.84 | −0.04 | −0.45 to 0.37 | 0.88 |
| Variant 3 | 0.42 | −0.16 | −0.52 to 0.22 | 0.57 |
| Intron 1a | 0.18 | −0.26 | −0.58 to 0.11 | 0.38 |
| Intron 1b | 0.003 | −0.54 | −0.79 to −0.17 | 0.02 |
| Methylation | 0.53 | −0.12 | −0.51 to 0.31 | 0.66 |
| Poly(GP) | 1.3 × 10⁻⁵ | −0.73 | −0.86 to −0.48 | 1.9 × 10⁻⁴ |
| Poly(GA) | 0.005 | −0.52 | −0.72 to −0.21 | 0.02 |
| Sense RNA foci | 0.29 | 0.21 | −0.22 to 0.54 | 0.48 |
| Antisense RNA foci | 0.88 | 0.03 | −0.38 to 0.43 | 0.88 |
| Age at onset | 0.88 | −0.03 | −0.44 to 0.34 | 0.88 |
| P-value | FDR | |||
| Sex | 0.32 | − | − | 0.48 |
| Disease subgroup | 0.29 | − | − | 0.48 |
A Cox proportional hazards regression model (survival after onset), a Spearman’s test of correlation [C9orf72 transcripts (total, variant 1, variant 2, variant 3, intron 1a, and intron 1b), C9orf72 promoter methylation, total poly(GP), total poly(GA), sense RNA foci, antisense RNA foci, and age at onset], a Wilcoxon rank sum test (sex), and a Kruskal-Wallis rank sum test (disease subgroup) are used. Depending on the test performed, the hazard ratio (HR), Spearman’s correlation coefficient (r), and/or 95% CI are specified.
Additionally, our No-Amp sequencing data revealed that smaller repeat lengths were significantly associated with increased levels of C9orf72 transcripts containing intron 1b (P = 0.003, r: −0.54, 95% CI: −0.79 to −0.17; Fig. 2B), which is located downstream of the expansion. Furthermore, smaller expansions were significantly associated with a higher burden of dipeptide repeat proteins poly(GP) (P = 1.3 × 10⁻⁵, r: −0.73, 95% CI: −0.86 to −0.48; Fig. 2C) and poly(GA) (P = 0.005, r: −0.52, 95% CI: −0.72 to −0.21; Fig. 2D). In addition to these associations that remained significant after false discovery rate correction, we detected nominally significant associations with other clinicopathological features (Table 2).
Interruptions
We then restricted our analysis to 2566 high-quality circular consensus sequencing reads (Supplementary material) to examine the purity of the C9orf72 repeat. In total, we obtained 2304 reads for the non-expanded allele (90%), corresponding to a median of 66 wild-type reads per sample (IQR: 40–106). For the expanded allele, we acquired 262 reads (10%), with a median of 6 expanded reads per sample (IQR: 4–11). Interestingly, the median GC content of the expansion was 100.00% (IQR: 99.99–100.00); other nucleotides, therefore, were scarce. The GGGGCC repeat was most commonly encountered, demonstrating a median of 95.72% (IQR: 95.11–96.32). Other motifs, such as GGGCCC, GGGCC, GGGGC, GGCC, and GGGC, were occasionally observed. Together, all six motifs accounted for 99.92% (IQR: 99.85–99.94) of the expanded repeat. The motifs did not show an obvious pattern and appeared to occur at random positions, even when comparing different reads from the same individual (Supplementary Fig. 3).
Discussion
Herein, we have described the results of a study where targeted long-read sequencing was applied to measure the size of C9orf72 expansions and to discover clinicopathological associations.
Importantly, although we detected a significant correlation between expansion sizes determined by No-Amp sequencing and Southern blotting, there appeared to be a bias towards smaller expansions. Because we focused on the cerebellum—a region that harbours fairly small expansions5—we postulate that the number of reads covering full-length expansions will, most likely, be lower in other regions with longer expansions, which may reduce the accuracy of size estimates in those regions.
The significant association we detected between cerebellar repeat lengths and survival after onset agrees with one of our Southern blot studies that uncovered a survival advantage for patients with smaller C9orf72 expansions.5 Additionally, the significant association we observed with transcripts containing intron 1b, downstream of the expansion, aligns with a nominally significant association we reported previously.14 Based on these encouraging findings, one could postulate that intron 1b-containing transcripts that probably harbour the entire expansion (as opposed to abortive transcripts) are more likely to be generated during transcription when the expansion is relatively small. These pre-mRNAs could serve as templates for repeat-associated non-ATG translation, thereby increasing the production of dipeptide repeat proteins, such as poly(GP) and poly(GA). In fact, this is in agreement with our prior discovery of an association between cerebellar intron 1b-containing transcripts and dipeptide repeat proteins.14 While our data could thus suggest that increased levels of dipeptide repeat proteins are beneficial, this may not be the case. For instance, the dipeptide repeat proteins could also be higher in patients with longer survival simply because they have been accumulating in these patients over an extended period of time. Moreover, since we specifically examined the two most abundant dipeptide repeat proteins, we cannot exclude the possibility that different associations might be observed for other dipeptide repeat proteins like poly(GR), which has been shown to correlate with neurodegeneration.17,18
Our assessment of interruptions demonstrated that the expansion has a high GC content and that it mostly contains GGGGCC repeats. Other motifs were rare and appeared to be located at random positions that were not shared across multiple reads from the same individual. It seems plausible, therefore, that they embody infrequent sequencing errors, which is not surprising given the long, repetitive, and GC-rich nature of the expansion. If, however, some of these cerebellar interruptions are real, then a pentanucleotide (i.e. GGGCC) appears to be the most common alternative motif, as reported previously.7 One could speculate that interruptions are more prominent in other regions and/or that they are more abundant in a subset of patients, potentially acting as a disease modifier.
In conclusion, the fact that we detected an association between estimates obtained using No-Amp sequencing and Southern blotting, as well as relevant clinicopathological associations, proves that No-Amp sequencing is a powerful technology. Thus, our study stresses the importance of the cerebellar expansion size and sheds light on how it might modify C9orf72-related diseases.
Acknowledgements
The authors thank all individuals who donated their brains to research. Additionally, they are grateful for the support their Genome Analysis Core received from the Mayo Clinic Center for Individualized Medicine.
Funding
The research leading to these results has received funding by the Muscular Dystrophy Association (MDA), ALS Association, Florida Department of Health 9AZ08, and National Institutes of Health (NIH) grants R21 NS110994, R21 NS099631, R35 NS097261, R35 NS097273, P50 AG016574, P01 NS084974, U01 AG045390, U54 NS092089, and R01 AG037491.
Competing interests
M.D.-H. and R.R. hold a patent on methods to screen for the hexanucleotide repeat expansion in the C9orf72 gene. All other authors report no competing interests.
Supplementary material
Supplementary material is available at Brain online.
References
1
2
3
4
5
6
7
8
9
10
11
12
13
14
15
16
17
18

