


Abstract
Approximately 30% of older adults exhibit the neuropathological features of Alzheimer’s disease without signs of cognitive impairment. Yet, little is known about the genetic factors that allow these potentially resilient individuals to remain cognitively unimpaired in the face of substantial neuropathology. We performed a large, genome-wide association study (GWAS) of two previously validated metrics of cognitive resilience quantified using a latent variable modelling approach and representing better-than-predicted cognitive performance for a given level of neuropathology. Data were harmonized across 5108 participants from a clinical trial of Alzheimer’s disease and three longitudinal cohort studies of cognitive ageing. All analyses were run across all participants and repeated restricting the sample to individuals with unimpaired cognition to identify variants at the earliest stages of disease. As expected, all resilience metrics were genetically correlated with cognitive performance and education attainment traits (P-values < 2.5 × 10⁻²⁰), and we observed novel correlations with neuropsychiatric conditions (P-values < 7.9 × 10⁻⁴). Notably, neither resilience metric was genetically correlated with clinical Alzheimer’s disease (P-values > 0.42) nor associated with APOE (P-values > 0.13). In single variant analyses, we observed a genome-wide significant locus among participants with unimpaired cognition on chromosome 18 upstream of ATP8B1 (index single nucleotide polymorphism rs2571244, minor allele frequency = 0.08, P = 2.3 × 10⁻⁸). The top variant at this locus (rs2571244) was significantly associated with methylation in prefrontal cortex tissue at multiple CpG sites, including one just upstream of ATPB81 (cg19596477; P = 2 × 10⁻¹³). Overall, this comprehensive genetic analysis of resilience implicates a putative role of vascular risk, metabolism, and mental health in protection from the cognitive consequences of neuropathology, while also providing evidence for a novel resilience gene along the bile acid metabolism pathway. Furthermore, the genetic architecture of resilience appears to be distinct from that of clinical Alzheimer’s disease, suggesting that a shift in focus to molecular contributors to resilience may identify novel pathways for therapeutic targets.
Introduction
Alzheimer’s disease is characterized by the presence of neuritic plaques and neurofibrillary tangles in the brain at autopsy. Clinically, it presents with progressive cognitive impairment. Yet, due to the long prodromal period of Alzheimer’s disease and unknown biological factors, not everyone with Alzheimer’s disease neuropathology presents with cognitive impairment. In fact, among cognitively unimpaired volunteers agreeing to autopsy at the time of death, 70% have varying degrees of Alzheimer’s disease pathology (Sonnen et al., 2011), and 30% have sufficient neuropathology in their brain to meet neuropathological criteria for Alzheimer’s disease (i.e. ‘asymptomatic Alzheimer’s disease’) (Rahimi and Kovacs, 2014). Identifying the molecular factors that underlie the resilience observed in asymptomatic Alzheimer’s disease may provide novel therapeutic targets for clinical intervention and provide additional insight into the genetic architecture of Alzheimer’s disease.
While there has been some prior discovery work using genomic data (Mostafavi et al., 2018; Yu et al., 2018), previous work characterizing the genetic contributors to asymptomatic Alzheimer’s disease has primarily focused on candidate genes (Monsell et al., 2013, 2017; Franzmeier et al., 2019) due to the lack of sufficient sample size to complete full genome-wide analyses. A major barrier in moving analyses forward has been the categorical definitions of asymptomatic Alzheimer’s disease that drastically reduce the number of participants available for analysis. In the past decade, residual approaches to quantifying continuous metrics of ‘resilience’ have emerged as potential endophenotypes for genetic analyses (Yu et al., 2015; White et al., 2017; Boyle et al., 2019). The basic approach is to deconvolve cognitive scores into components that are explained and unexplained by proxy or direct measures of neuropathology (Reed et al., 2010). These residual approaches model better-than and worse-than predicted cognitive performance to represent higher versus lower resilience (Yu et al., 2015; Boyle et al., 2019). Recently, our group has extended these residual approaches to quantify and validate continuous metrics of ‘cognitive resilience’ (representing better-than-predicted cognitive performance given an individual’s burden of Alzheimer’s disease neuropathology) and ‘brain resilience’ (representing better-than-predicted brain volumes given an individual’s burden of Alzheimer’s disease neuropathology) (Hohman et al., 2016b). These continuous metrics are strong predictors of future cognitive decline and cognitive impairment (Hohman et al., 2016b). The goal of the present analysis was to evaluate genetic predictors of cognitive resilience across the genome.
A few genome-wide analyses have been completed that focus on resilience in asymptomatic Alzheimer’s disease, although with limited sample sizes (Hohman et al., 2014a, b, 2016a; White et al., 2017). Recently, ∼3000 samples with both whole-genome genetic data and in vivo brain measures of amyloid burden from the Anti-Amyloid Treatment in Asymptomatic Alzheimer’s Disease (A4) clinical trial were made publicly available, providing an unmatched resource for exploring the genetics of resilience to Alzheimer’s disease. We performed the largest (n = 5108) genome-wide association study (GWAS) of cognitive resilience in Alzheimer’s disease by leveraging harmonized resilience metrics across the cross-sectional A4 study and three longitudinal cohort studies of Alzheimer’s disease. Validation of identified genomic candidates was completed using gene expression data from post-mortem brain tissue and genotype data from large-scale case/control datasets of Alzheimer’s disease. Importantly, we also performed comprehensive genetic correlation and pathway analyses to provide critical information about the fundamental biological pathways that may protect the brain from the downstream consequences of Alzheimer’s disease neuropathology.
Materials and methods
Participants
Participant data was acquired from multiple cohort studies including screening data from the A4 Study, the Alzheimer’s Disease Neuroimaging Initiative (ADNI), the Religious Orders Study and Rush Memory and Aging Project (ROS/MAP), and the Adult Changes in Thought (ACT) Study. The A4 Study screening data were acquired as part of a clinical trial that began in 2014 (Sperling et al., 2014). All participants were recruited with unimpaired cognition, and amyloid PET imaging was performed at screening. Additionally, participants with a Delayed Logical Memory score <6 or >18 were excluded from PET scans and are not included in the present analysis. ADNI was launched in 2003 and over the four phases of the study now includes >1800 individuals aged 55–90 (www.adni-info.org). Recruitment was designed to mimic clinical trials and therefore included individuals with unimpaired cognition, mild cognitive impairment, and Alzheimer’s disease at baseline. Data from ADNI-1, ADNI-2, and ADNI-GO are included in the present analyses. ACT began in 1994 and recruited a random sample of nondemented older adults from the Seattle metropolitan area (Kukull et al., 2002). A subset of participants in ACT agreed to brain donation and are included in these analyses. ROS launched in 1994 and recruited Catholic nuns, priests, and brothers from across the USA, and MAP launched in 1997 and recruited cognitively unimpaired older adults from the Chicago metropolitan area (Bennett et al., 2018). Those who agreed to brain donation are included in the present analysis.
Amyloid PET acquisition
For ADNI and A4 participants, amyloid burden was quantified using amyloid PET. PET procedures in ADNI are described at the ADNI website (http://www.adni-info.org). A4 and ADNI are both largescale multisite studies for which PET amyloid acquisition was completed on multiple platforms, including GE, Philips, and Siemens. In all cases, PET data were acquired using a dynamic 3D scan with four 5-min frames acquired 50–70 min post injection. A subset of ADNI participant data were acquired using 11C-PiB, but the majority of ADNI and all of A4 was acquired using 18F-florbetapir. Standardized uptake value ratios (SUVR) were quantified relative to whole cerebellum, and a composite mean SUVR was quantified across cortical regions as a summary metric of amyloid burden.
Amyloid PET processing and harmonization
Harmonization of amyloid PET levels was performed using composite cortical values calculated within ADNI and A4 separately. We applied a Gaussian Mixture Model (GMM) within each dataset to place values on the same scale using a recently developed harmonization algorithm (Properzi et al., 2019). GMMs were estimated among cognitively unimpaired individuals using a two-component model fit and applied to the entire sample. Mean SUVRs were scaled and normalized using the mean and standard deviation estimated from the predicted amyloid-negative (amyloid−) Gaussian distribution. A more comprehensive assessment of this and alternative harmonization approaches was recently published by our group (Raghavan et al., 2020), but we used the present approach because it makes the fewest assumptions about the data and was more robust to outliers than alternative approaches. One alternative that we investigated previously is using the predicted amyloid− and amyloid-positive (amyloid+) distribution to give more sensitivity in the high end of the amyloid+ range (Raghavan et al., 2020). The current approach focusing on amyloid− does have limitations in the high end of amyloid+, so it is possible that we are underestimating the extent of amyloidosis in late stage disease. That said, our head to head comparison previously showed very small differences across harmonization approaches when amyloid is an outcome, and they would be further attenuated in the current context when amyloid levels are leveraged as a linear predictor (Raghavan et al., 2020). The final scaled score represents a z-score based on the predicted amyloid− distribution among cognitively unimpaired older adults.
Post-mortem assessment of neuropathology
For ACT and ROS/MAP participants, neuritic plaque burden was quantified with Consortium to Establish a Registry for Alzheimer’s Disease (CERAD) scores. A comprehensive neuropathological evaluation was completed at each site, including full CERAD staging as previously described (Mirra et al., 1991).
Neuropsychological composites
Harmonization of cognitive tests in ADNI and A4 was completed using the Preclinical Alzheimer Cognitive Composite (PACC), calculated in each dataset individually using item level data from Logical Memory Immediate and Delayed Recall, WAIS-R Digit Symbol Substitution Test, the Mini-Mental State Examination, and the Selective Reminding Test or the delayed word recall from the Alzheimer's Disease Assessment Scale-Cognitive Subscale (ADAS-Cog). In all four datasets, a previously published protocol to harmonize neuropsychological scores in the domains of memory and executive function was used (Crane et al., 2017). A memory composite was calculated in all four datasets, and an executive function composite was quantified in ACT, ADNI, and ROS/MAP (there was insufficient item level data in A4). The inclusion of three composite measures allowed each dataset to have multiple indicator variables, providing a robust anchoring of resilience metrics across datasets. A detailed description of the item level data and model that was included in these composite metrics is presented in the Supplementary material.
Quantification of resilience metrics
Resilience metrics were quantified using established procedures (Hohman et al., 2016b) and the model is presented in Fig. 1. Briefly, individual regression models estimated amyloid pathology associations with cognition covarying for age and sex. A robust weighted least squares estimator in a confirmatory factor analysis was quantified using Mplus (Muthén and Muthén, 1998: 2015) (version 7.31) to summarize residuals from the linear regression models into composite measures representing the degree to which an individual performed better or worse than predicted given their age, sex, and amyloid load (note that years of education was integrated into the second order latent trait). The outcomes of interest were residual cognitive resilience and combined resilience where residual cognitive resilience was quantified from residuals and combined resilience was summarized as the covariance of educational attainment with residual cognitive resilience. A detailed description of the methodology and quantified resilience metrics is presented in the Supplementary material.
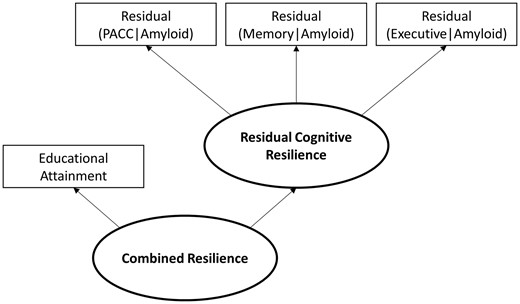
Quantification of resilience metrics. Residuals from linear regression models in which a cognitive score was regressed on age, sex, and amyloid levels were extracted and entered as indicator variables in a partial least squares path model using established procedures. Combined resilience was quantified as a second order latent trait in the model in which educational attainment was included as an additional indicator variable. PACC = Preclinical Alzheimer Cognitive Composite.
Genotype processing and quality control
Genotyping in all cohorts was performed using DNA extracted from whole blood or brain tissue on different genotyping arrays. For A4, the Illumina Global Screening Array was used for genotyping. ACT participants were genotyped on an Illumina Human660W-Quad. Three Illumina platforms were used in ADNI: Human610-Quad, HumanOmniExpress, and Omni 2.5M. ROS/MAP genotypes were also obtained on three platforms: Affymetrix Genechip 6.0, Illumina Human1M, and Illumina Global Screening Array. In ADNI and ROS/MAP, sample sets genotyped on different arrays were processed and imputed in parallel and merged after imputation. Quality control (QC) was performed using standard procedures, including removal of single nucleotide polymorphisms (SNPs) and samples with >5% genotype missingness, removal of SNPs with <1% minor allele frequency (MAF) or Hardy-Weinberg Equilibrium (HWE) P-values <10−6, and removal of samples with sex discrepancies, cryptic relatedness (pi-hat >0.25), or who were not non-Hispanic White by self-report or by population principal component analysis.
Genotypes were then imputed with Minimac3 on the Michigan Imputation Server (https://imputationserver.sph.umich.edu) using the HRC r1.1 2016 reference panel. Post-imputation QC steps included removal of SNPs with imputation quality score R2 < 0.90, call rate < 95%, MAF < 1%, or HWE P-value < 10−6. Imputed datasets were then merged for the two autopsy cohorts (ACT and ROS/MAP) and the two PET imaging cohorts (A4 and ADNI). Non-overlapping SNPs (i.e. those with missingness >95%) were excluded. A total of 4 840 740 SNPs remained and were included in the analysis.
Statistical analyses
Our analysis workflow is presented in Fig. 2. Following phenotype harmonization and calculation of resilience metrics (i.e. residual cognitive resilience and combined resilience) for each cohort, genome-wide association analyses were completed using linear regression in PLINK (version 1.9, https://www.cog-genomics.org/plink/1.9). GWAS was performed in the combined autopsy dataset and the combined PET dataset. For each dataset, two models were run. The first model estimated resilience among individuals across the spectrum of dementia, including individuals with unimpaired cognition, mild cognitive impairment, and Alzheimer’s disease. The second model restricted the sample to individuals with unimpaired cognition to focus on resilience during the preclinical phase of disease. In all models, covariates included age, sex, and the first three population principal components. The genome-wide threshold for statistical significance was set a priori at α = 5 × 10⁻⁸. Summary statistics at each marker across the autopsy dataset and the PET dataset were then combined in a fixed-effect meta-analysis using the GWAMA software program (Mägi and Morris, 2010).
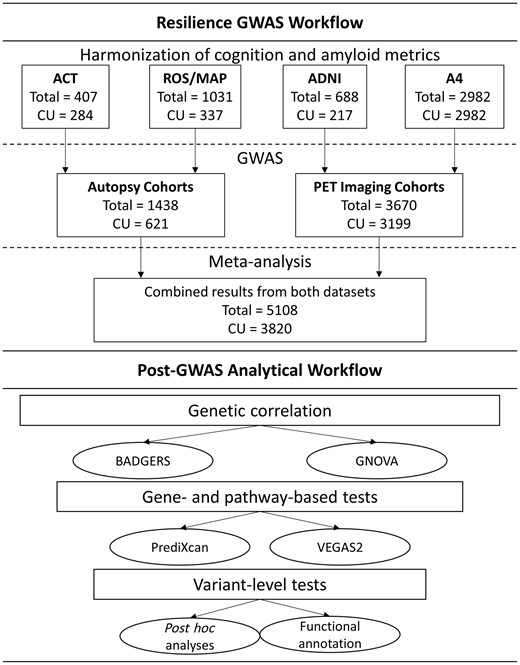
Workflow of analytical activities. CU = cognitively unimpaired.
We first summarized genetic signal across the genome using summary statistics from our resilience GWAS to estimate genetic correlations between resilience phenotypes and 67 complex traits with publicly accessible GWAS summary statistics using the Genetic Covariance Analyzer (GNOVA) program (Lu et al., 2017). Details about the source of summary statistics for each trait are presented in Supplementary Table 1. This provided a first level of validation that the genetic signal in our analysis was correlated with common phenotypes (e.g. cognitive performance and educational attainment) while also providing insight into novel resilience associations. Additionally, we replicated our top genomic correlation results leveraging the BADGERS program (Yan et al., 2018) and quantified correlation across 1738 traits in the UK Biobank (http://biobank.ndph.ox.ac.uk/showcase/). To aid in interpretation of genetic covariance results, we also quantified heritability estimates using the Genome-wide Complex Trait Analysis (GCTA) tool (Yang et al., 2011). Heritability of each resilience phenotype was quantified within the PET and Autopsy datasets separately, and within a combined dataset including all samples. Estimates were quantified across all participants and when restricting the sample to individuals with unimpaired cognition.
Participant characteristics
| Autopsy cohorts | PET cohorts | Combined | |||||||
|---|---|---|---|---|---|---|---|---|---|
| ACT | ROS/MAP | ADNI | A4 | ||||||
| CU | All | CU | All | CU | All | CU/All | CU | All | |
| Sample size | 284 | 407 | 337 | 1,031 | 217 | 688 | 2980 | 3818 | 5108 |
| Female, n (%) | 153 (54) | 232 (57) | 217 (64) | 672 (52) | 107 (49) | 296 (43) | 1779 (60) | 2258 (59) | 2983 (58) |
| Age | 87.11 ± 6.73 | 88.28 ± 6.75 | 86.99 ± 6.62 | 89.43 ± 6.51 | 76.46 ± 6.34 | 74.82 ± 7.58 | 71.36 ± 4.75 | 74.20 ± 7.78 | 76.82 ± 9.67 |
| Education | 14.92 ± 2.99 | 14.71 ± 3.04 | 16.56 ± 3.78 | 16.42 ± 3.61 | 16.38 ± 2.68 | 16.19 ± 2.71 | 16.76 ± 2.68 | 16.57 ± 2.86 | 16.44 ± 2.98 |
| Amyloid burden | |||||||||
| CERAD, n (%) | |||||||||
| None | 84 (29) | 106 (26) | 133 (39) | 253 (24) | – | – | – | – | 217 (35) |
| Sparse | 89 (31) | 107 (26) | 39 (12) | 97 (9) | – | – | – | – | 128 (21) |
| Moderate | 63 (22) | 94 (23) | 115 (34) | 374 (36) | – | – | – | – | 178 (29) |
| Severe | 47 (16) | 100 (25) | 50 (15) | 307 (30) | – | – | – | – | 97 (26) |
| Standardized PET amyloid | – | – | – | – | 1.39 ± 2.69 | 2.19 ± 3.05 | 1.41 ± 2.52 | 1.41 ± 2.52 | 1.41 ± 2.53 |
| Cognitive function | |||||||||
| Harmonized memory | 0.31 ± 0.57 | −0.09 ± 0.82 | 0.36 ± 0.47 | −0.60 ± 1.01 | 0.81 ± 0.48 | 0.30 ± 0.69 | 0.53 ± 0.22 | 0.53 ± 0.22 | 0.52 ± 0.33 |
| Harmonized executive function | 1.55 ± 0.89 | 1.13 ± 1.17 | 1.39 ± 0.82 | 0.58 ± 1.12 | 2.89 ± 0.88 | 2.36 ± 1.16 | – | – | 1.83 ± 1.07 |
| PACC | – | – | – | – | −0.31 ± 2.93 | −4.39 ± 5.33 | 0.20 ± 2.5 | 0.20 ± 2.5 | 0.17 ± 2.53 |
| Resilience phenotypes | |||||||||
| Residual cognitive resilience | −0.04 ± 0.89 | 0.24 ± 0.82 | 4.8 × 10⁻³ ± 0.80 | −0.17 ± 0.9 | 0.22 ± 1.37 | −0.54 ± 1.33 | 0.06 ± 1.06 | 0.25 ± 0.63 | 0.06 ± 1.05 |
| Combined resilience | −0.19 ± 0.47 | −0.13 ± 0.41 | 7.5× 10⁻⁴ ± 0.53 | −0.04 ± 0.46 | 0.05 ± 0.56 | −0.15 ± 0.46 | 0.04 ± 0.47 | 0.09 ± 0.34 | 0.02 ± 0.49 |
Age is age at death for autopsy cohorts and age at visit for PET cohorts. Values are mean ± standard deviation or number of samples (per cent of the group). CERAD = Consortium to Establish a Registry for Alzheimer's Disease; CU = cognitively unimpaired; PACC = Preclinical Alzheimer Cognitive Composite.
Next, we performed gene- and pathway-level analyses using VEGAS2 (Liu et al., 2010; Mishra and Macgregor, 2015, 2017) and PrediXcan (Gamazon et al., 2019). PrediXcan models were estimated for 44 tissues in the GTEx Portal and for additional disease relevant tissues, including prefrontal cortex from CommonMind and monocytes from the Multi-Ethnic Study of Atherosclerosis (MESA). Correction for multiple comparisons in gene-level analyses was quantified using the false discovery rate (FDR) procedure, which accounted for all 258 562 gene-tissue combinations. The a priori threshold for significance of the VEGAS pathway results was P < 1 × 10⁻⁵, which was based on a simulation-derived 95% empirical significance threshold taking into account the multiple testing of 6213 correlated pathways (Mishra and MacGregor, 2017).
Finally, single variant GWAS loci were mapped to genes and functionally annotated leveraging INFERNO (http://inferno.lisanwanglab.org/) (Amlie-Wolf et al., 2018) and the Brain xQTL Serve database (http://mostafavilab.stat.ubc.ca/xqtl/) (Ng et al., 2017). INFERNO integrates hundreds of publicly available functional genomics databases, including databases of transcription factor binding sites, expression quantitative trail loci (eQTL), and enhancer activity. The Brain xQTL Serve database includes additional eQTL, methylation-QTL (mQTL), and histone-QTL (hQTL) analyses.
Sensitivity analysis with educational attainment
Our primary model includes education as an indicator variable; thus, it does not allow for us to easily parse genetic effects due to education from those due to other resilience factors. For that reason, we recalculated the first-order latent trait residual cognitive resilience including years of education as a covariate and re-ran all genomic analyses. This metric for sensitivity analyses reflects variance in cognitive performance that is not due to age, sex, biomarker levels, or educational attainment.
Sensitivity analysis limited to Alzheimer’s disease cases
Resilience phenotypes were also quantified in the sample restricted to Alzheimer’s disease cases (n = 668) for comparison to the cognitively unimpaired results, with a particular focus on fit of the latent variable model and heritability of the resilience phenotypes.
Data availability
Data from the ADNI and A4 studies are shared through the LONI Image and Data Archive (https://ida.loni.usc.edu/). Data from ROS/MAP can be requested at www.radc.rush.edu. Data from ACT can be accessed through the Data Query Tool (http://act.kpwashingtonresearch.org/dqt/). GWAS summary statistics will be available through NIAGADS (https://www.niagads.org/datasets).
Results
Across the four cohorts, 5108 individuals (A4 n = 2982; ROS/MAP n = 1031; ADNI n = 688; ACT n = 407) had both genome-wide genotype and resilience phenotype data, 3820 (75%) of whom were cognitively unimpaired. Participant characteristics are presented in Table 1. In general, participants were mostly female (except for ADNI) and were well-educated. Individuals in the PET cohorts tended to be younger than individuals in the autopsy cohorts.
Genetic covariance results
Heritability estimates for each resilience phenotype are presented in Supplementary Table 2. Briefly, we observed larger heritability estimates when restricting the sample to individuals with unimpaired cognition (residual cognitive resilience h2 = 0.20–0.28, combined resilience h2 = 0.23–0.99) compared to the entire sample (residual cognitive resilience h2 = 0.00–0.08, combined resilience h2 = 0.19–0.67). We also quantified the phenotypic correlation between educational attainment and residual cognitive resilience, which was modest (Pearson’s r = 0.15, P < 0.001).
Methylation targets for rs2571244
| CpG site | CpG start position | Spearman’s ρ | P |
|---|---|---|---|
| cg19596477 | 18:55472454 | 0.33 | 2.24 × 10⁻¹³ |
| cg16310513 | 18:55471075 | 0.17 | 1.79 × 10⁻⁴ |
| cg16141316 | 18:55469758 | −0.12 | 8.14 × 10⁻³ |
| CpG site | CpG start position | Spearman’s ρ | P |
|---|---|---|---|
| cg19596477 | 18:55472454 | 0.33 | 2.24 × 10⁻¹³ |
| cg16310513 | 18:55471075 | 0.17 | 1.79 × 10⁻⁴ |
| cg16141316 | 18:55469758 | −0.12 | 8.14 × 10⁻³ |
The most significant methylation targets for rs2571244 (18:55473651) in dorsolateral prefrontal cortex are presented.
Using the summary statistics from the resilience GWAS, we performed genetic covariance analyses to gain insight into any shared genetic basis of relevant biological processes. Pair‐wise genetic covariances between combined resilience GWAS results in all participants and 67 health-related phenotypes are depicted in Fig. 3 and presented in Supplementary Table 3. Ten genetic correlation analyses survived correction for multiple testing. We observed strong and expected positive correlations with cognitive performance and educational attainment (P < 1.4 × 10⁻¹⁹), validating our metric and providing strong evidence of consistency in the observed polygenic signal across comparable measures from independent datasets.

Genome-wide genetic covariance results. Genetic covariances between combined resilience and 67 complex traits. Error bars represent 95% confidence intervals. FWE-P: corrected P-value based on the family-wise error rate. BMI = body mass index; HDL = high density lipoprotein; LDL = low density lipoprotein; pvRSA HF = peak-valley respiratory sinus arrhythmia, high frequency power; RMSSD = root mean square of successive differences; SDNN = standard deviation of the NN interval (NN interval is the interval between two heart beats).
Additionally, we observed multiple novel correlations, including two smoking behaviour phenotypes: age at smoking initiation (genetic correlation = 0.033; P = 2.0 × 10⁻⁷) and number of cigarettes per day (genetic correlation = −0.021; P = 8.0 × 10⁻⁴). Additional novel correlations included two neuropsychiatric conditions, whereby increased genetic risk of obsessive compulsive disorder (OCD) was correlated with higher levels of resilience (P = 7.9 × 10⁻⁴) while increased genetic risk of attention deficit hyperactivity disorder (ADHD) was associated with lower levels of resilience (P = 4.7 × 10⁻⁶). Interestingly, older age at first birth was associated with higher levels of resilience (P = 1.1 × 10⁻⁸). Genetic correlations with residual cognitive resilience were similar to those observed for combined resilience and were similar when restricting the sample to cognitively unimpaired individuals (Supplementary Tables 3 and 4).
As a second level of validation, we also quantified genetic correlations with phenotypes in the UK Biobank leveraging a recently published method to perform phenome-wide association analyses leveraging summary statistics (Yan et al., 2018). Consistent with GNOVA results, we observed strong correlations with numerous education and cognitive phenotypes (Supplementary Tables 5 and 6). We also verified correlations with age at first birth (P = 6.2 × 10⁻¹²) and observed some intriguing novel correlations.
Interestingly, there was no evidence for genetic correlation between resilience phenotypes and clinical Alzheimer’s disease (P = 0.45). Similarly, when evaluating the 40 previously identified Alzheimer’s disease risk variants from ∼25 loci (Lambert et al., 2013; Jansen et al., 2019; Kunkle et al., 2019), only three SNPs showed nominal evidence of association with either resilience phenotype (Supplementary Table 7). Similar results were also observed when fully analysing the APOE haplotype, whereby increasing numbers of APOE ε4 alleles or number of APOE ε2 alleles were not associated with either resilience phenotypes (P-values > 0.13). Together these results suggest the polygenic signal underlying the resilience phenotypes is distinct from clinical Alzheimer’s disease.
Gene-level and pathway results
Next, we continued to explore the genetic architecture of resilience on both a gene and pathway level. Gene-level results in individual tissues and cross-tissue, based on predicted gene expression associations with resilience, are reported in Supplementary Tables 8–11. Resilience metrics were not associated with predicted gene expression among individual tissues or across tissues after Bonferroni correction for multiple testing. The most significant gene in the cross-tissue analyses was ZNF451, which was associated with combined resilience in individuals with unimpaired cognition at P < 6.6 × 10⁻⁶ (Supplementary Table 9).
In pathway-level analyses using VEGAS2, no molecular pathways remained significant when correcting for multiple comparisons. However, when restricting to cognitively unimpaired participants in the combined resilience analysis, there was nominal evidence of enrichment in the amino acid metabolism pathway (P = 7.8 × 10⁻⁵, PANTHER database), the prolactin receptor signalling pathway (P = 8.2 × 10⁻⁵, Reactome database), and the dehydrogenase pathway (P = 1.4 × 10⁻⁴, PANTHER database).
Single-variant associations with resilience
Finally, we focused on single variant level analyses to identify novel genetic loci associated with resilience. Genome-wide significant results are presented in Fig. 4A, and detailed results for all models are presented in Supplementary Tables 12–15. When including all diagnoses in the GWAS, we did not observe any variants that reached statistical significance in either residual cognitive resilience or combined resilience analyses. When restricting analyses to individuals with unimpaired cognition, we identified a locus on chromosome 18 just upstream of the ATP8B1 gene that reached genome-wide significance in combined resilience analyses (Fig. 4B). More specifically, the minor allele of the index SNP at this locus (rs2571244; MAF = 0.08) was associated with lower levels of combined resilience (β = −0.11, P = 2.3 × 10⁻⁸), and the direction of association was consistent across the PET and Autopsy datasets (Fig. 4C). No genome-wide associations were observed in the residual cognitive resilience analyses among participants with unimpaired cognition.
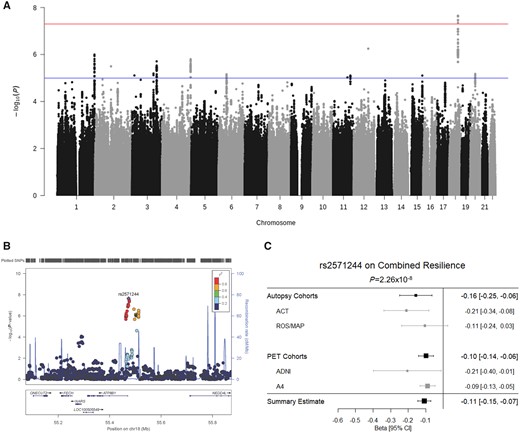
Variant-level resilience GWAS results. (A) Manhattan plot of results from the GWAS analysis of combined resilience. GWAS significance (5 × 10⁻⁸) is indicated by the red line, while suggestive significance (1 × 10⁻⁵) is indicated by the blue line. (B) LocusZoom plot of the GWAS-significant locus on chromosome 18. Colours denote linkage disequilibrium with the most statistically significant SNP. (C) Forest plot for the top SNP on chromosome 18 is presented demonstrating consistent direction and magnitude of effect across the autopsy and PET datasets and within the component cohorts. The summary estimate at the bottom indicates the meta-analysis of the autopsy and PET combined datasets. CI = confidence interval.
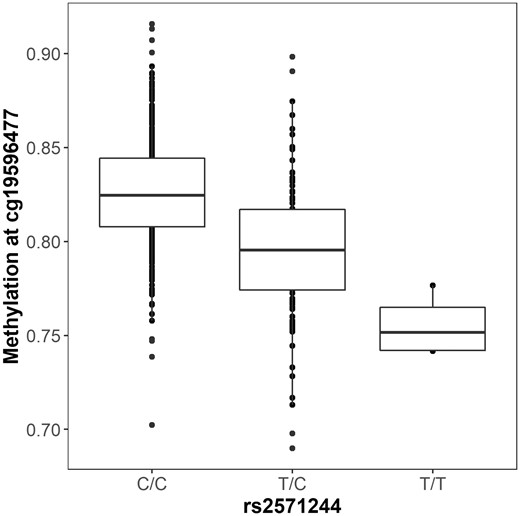
Functional annotation of resilience GWAS results. The minor allele of rs2571244 (T) is associated with decreased methylation at the CpG site cg19596477.
Single-variant gene mapping and functional annotation
To characterize the molecular mechanisms of the genome-wide associated loci identified above, we used hundreds of functional genomics datasets to test for tissue-specific regulatory activity of these novel variants. The index SNP at the chromosome 18 locus (rs2571244) was strongly associated with prefrontal cortex methylation at multiple sites (Table 2), with the strongest association observed at a CpG site just upstream of ATPB81 (cg19596477; P = 2 × 10⁻¹³; Fig. 5). SNPs in this region also showed statistically significant enrichment for enhancer sites in the Roadmap dataset in across multiple tissues, including brain and liver (adjusted P-values = 0.001). However, there was no evidence that rs2571244 functioned as an eQTL or hQTL in any of the databases.
Sensitivity analyses with educational attainment
We reanalysed all residual cognitive resilience results leveraging a metric calculated with residuals from linear regression models covarying for years of education. Genetic covariance results are presented in Supplementary Table 16. We observed only small changes in correlations with cognitive performance, psychiatric phenotypes, and smoking phenotypes. Interestingly though, when including individuals with clinical Alzheimer’s disease in our analyses we did observe robust genetic correlation with Alzheimer’s disease (P = 4 × 10⁻²⁷) and hippocampal volume (P = 1 × 10⁻⁷), suggesting that genetic architecture of residual cognitive resilience more closely resembles the genetic architecture of Alzheimer’s disease when including education as a covariate. In contrast to our primary results, we also observed an APOE ε4 association with the education adjusted resilience metric, but only when including clinical Alzheimer’s disease participants in the analysis, further highlighting a move towards the genetic architecture of Alzheimer’s disease. Single variant results were largely consistent across the two phenotypes, with no genome-wide significant variants identified and the top identified variants in the primary analysis showing similar effects (rs27986 original β = 0.112, original P = 5 × 10⁻⁷ compared to β = 0.105, P = 1 × 10⁻⁶). The variant identified in the combined resilience GWAS remained nominally significant in the education adjusted residual cognitive resilience analysis (rs2571244, P = 0.0006), suggesting that association is not driven entirely by educational attainment.
Sensitivity analyses limited to Alzheimer’s disease cases
Model fit was comparable in the latent variable model limited to Alzheimer’s disease cases (Supplementary material). However, we did not observe significant heritability in the autopsy (h2 < 0.001, P = 0.5) or PET (h2 < 0.001, P = 0.5) dataset for either resilience trait. When combining across datasets heritability remained non-significant (h2 = 0.11, P = 0.38) likely due to the limited sample size. In GWAS analysis, we did not observe any statistically significant loci, and the top variant identified in unimpaired participants was non-significant in Alzheimer’s disease cases (rs2571244, β = −0.01, P = 0.72).
Discussion
We completed a large genetic analysis of resilience to Alzheimer’s disease neuropathology and identified a number of variants, genes, and functional pathways that are associated with protection from the downstream consequences of neuropathology. Our results implicate genetic drivers of educational attainment, smoking behaviours, and neuropsychiatric phenotypes in Alzheimer’s disease resilience; highlight a novel resilience locus on chromosome 18; and implicate metabolism in the liver as a molecular contributor to resilience. Notably, the genetic architecture of resilience appears to be distinct from the genetic architecture of clinical Alzheimer’s disease, with no observed genetic correlation and nominal contributions of APOE on resilience, suggesting that a focus on the molecular contributors to resilience may highlight novel pathways for therapeutic development.
Resilience scores are genetically correlated with education, neuropsychiatric, and smoking phenotypes
Results from genetic correlation analyses provided validation of the genetic signals we observed in this analysis and highlighted a number of important biological processes in the aetiology of resilience. As expected, we observed strong genetic correlations with educational attainment, cognitive performance, and several education-related traits. It is also interesting that we observed some hormone and smoking related traits, although both may be confounded by educational attainment making interpretation challenging. In the case of the smoking traits, genetic risk for smoking and a younger age of initiating smoking was associated with lower levels of resilience, consistent with epidemiological associations between smoking and dementia (Tyas et al., 2003; Peters et al., 2008). In the case of hormone-related phenotypes, an older age of first birth, last birth, and menopause (nominal association in GNOVA and UK Biobank) was correlated with higher resilience scores. Similar associations at the phenotypic level have been reported previously, with an older age at menopause correlated with protection from cognitive decline (McLay et al., 2003; Ryan et al., 2009, 2014). Interestingly, we and others have published extensively on sex differences in the downstream consequences of neuropathology (Buckley et al., 2018; Deming et al., 2018; Hohman et al., 2018; Dumitrescu et al., 2019; Mahoney et al., 2019). The present results suggest that hormone changes in older adulthood may contribute to susceptibility to cognitive decline, but more work is needed to disentangle the potential contribution of educational attainment on these observed genetic correlations.
In addition, we observed notable genetic correlations with neuropsychiatric phenotypes including ADHD and OCD. Interestingly, genetic risk for OCD was associated with higher resilience scores, while genetic risk for ADHD was associated with lower resilience. Although there is some literature suggesting a potential link between ADHD and dementia, it is challenging because of the symptomatic overlap of the two conditions in adulthood (Callahan et al., 2017). Interestingly, the genetic correlation appears to be driven by a locus on chromosome 6 that shows suggestive association in both the combined resilience GWAS and ADHD GWAS (Supplementary Fig. 1). The top SNP in each GWAS at this locus (rs141547796 in ADHD and rs283562 in the resilience GWAS) are both eQTLs for the TFAP2B gene involved in neural crest cell differentiation, suggesting this transcription factor may play a role in both ADHD and resilience to Alzheimer’s disease. Less work has characterized the association between OCD and dementia, but the limited literature suggests OCD is a risk factor for dementia (Dondu et al., 2015). Thus, it is quite interesting that we observed a positive genetic correlation between OCD and resilience here, suggesting a potential protective role. When comparing the GWAS results, we were unable to determine an obvious overlapping locus driving this correlation (Supplementary Fig. 2). Past work has highlighted a strong negative genetic correlation between OCD and metabolic phenotypes including body mass index, hip circumference, smoking, triglycerides, and insulin levels (Dondu et al., 2015). OCD and ADHD also show a similar opposing genetic correlation with educational attainment, so it may be that the genetic correlation between these psychiatric conditions and resilience is secondary to metabolic or educational attainment phenotypes, but it is an area ripe for future investigation.
Heritability of resilience phenotypes
Our combined heritability analysis of resilience phenotypes suggested a range of 4–24% narrow-sense heritability with fairly stable estimates and reasonable standard errors. That said, we observed larger standard errors and larger swings in point estimates in cognitively impaired individuals, likely due to the known limitations of the mixed-effects approach at smaller sample sizes. Larger sample sizes will ultimately be needed to solidify heritability estimates across disease stages, measures of neuropathology, and cohort studies. The present results suggest a modest heritability consistent with many polygenic complex traits, with the most stable estimates observed across studies for the residual cognitive resilience phenotype among cognitively normal participants.
Variants near ATP8B1 are associated with resilience
Our top variant level association was observed on chromosome 18 in relation to the combined resilience score, which pools information from residual and proxy measures of reserve. The cluster of SNPs associated with combined resilience localized just upstream of ATP8B1, and the top SNP was robustly associated with methylation at a site also just upstream of ATP8B1. Interestingly, prefrontal cortex methylation at this site was strongly associated with combined resilience scores in the ROS/MAP dataset, particularly among rs2571244 minor allele carriers, further implicating methylation as a potential biological driver at this locus. ATP8B1 encodes the protein aminophospholipid translocase, which is critical for maintaining bile acid homeostasis in the liver (Bull et al., 1998). For that reason, we also performed post hoc analyses using recently quantified metabolomic measures of 15 bile acids from serum samples in ADNI and observed that the variant was nominally associated with five bile acids, including taurocholic acid (TCA), glycolithocholic acid (GLCA), glycocholic acid (GCA), taurodeoxycholic acid (TDCA), and taurochenodeoxycholic acid (TCDCA) (P < 0.05; Supplementary Table 17). Moreover, we observed significant associations between GLCA and TDCA on combined resilience, whereby higher levels of these bile acids were associated with lower levels of resilience (Supplementary Table 18). Bile acids have emerged as a potential biological contributor to Alzheimer’s disease, with recent work reporting differential abundance in Alzheimer’s disease cases compared to controls in both blood and brain (Nho et al., 2019), and other work reporting associations with biomarkers of Alzheimer’s disease neuropathology (Nho et al., 2019). Notably, both GLCA and TDCA were reported to have robust associations with hippocampal atrophy and glucose hypometabolism. The present findings therefore suggest genetic variation that predisposes some individuals towards a more detrimental bile acid state may also increase susceptibility to cognitive decline. The exact causal pathway of such bile acid effects is difficult to infer. Notably, the methylation QTL that we observed for rs2571244 was in prefrontal cortex, suggesting effects could be through brain, but there is a pressing need to better understand the gut-liver-brain axis and determine whether associations with cognitive ageing and dementia are driven by metabolic processes in liver, gut, brain, or all three tissues.
While we did not observe strong associations with Alzheimer’s disease-relevant loci, we did observe nominal associations with the SPI1 and NME8 loci in candidate analyses, both of which have been implicated in a number of Alzheimer’s disease endophenotypes (Rosenthal and Kamboh, 2014; HuaNg et al., 2017). SPI1 encodes a transcription factor that regulates many Alzheimer’s disease-relevant genes and pushes back age of onset (HuaNg et al., 2017). The function of NME8 is less well understood but may confer risk through oxidative stress pathways. Regardless, there remains only weak evidence that variants contributing to Alzheimer’s disease drive notable variation in cognitive performance after accounting for amyloid levels.
Pathway analyses highlight metabolism
While variant-level results implicate the metabolic processes in the liver, enrichment results highlight the related branched chain amino acid (BCAA) and dehydrogenase molecular pathways. Although the role of BCAAs in Alzheimer’s disease onset and progression is unclear, several studies have supported a connection. A previous GWAS study showed that SNPs associated with increased isoleucine plasma levels were also associated with Alzheimer’s disease (Larsson and Markus, 2017). However, metabolomic studies have shown that increased serum concentration of BCAAs are associated with decreased Alzheimer’s disease risk (Tynkkynen et al., 2018). Particularly, increased serum valine was associated with decreased rates of cerebral atrophy and cognitive decline (Toledo et al., 2017). Deficits in brain BCAA metabolism have been proposed to contribute to the onset and progression of Alzheimer’s disease in mice, and increased circulating BCAAs have been hypothesized to increase neuronal mTOR signalling, leading to hyperphosphorylated tau pathology (Li et al., 2018).
Several components of dehydrogenase pathways have been implicated to play a role in dysfunctional oxidative stress handling in Alzheimer’s disease (Martins et al., 1986). Inhibition of alpha-ketoglutarate, pyruvate, and alcohol dehydrogenases by amyloid beta is thought to contribute to mitochondrial and metabolic dysfunction associated with Alzheimer’s disease (Casley et al., 2002; Yan and Stern, 2005). Alpha-ketoglutarate dehydrogenase complex expression and activity is reduced in the temporal cortex of Alzheimer’s disease brains and is thought to reduce energy metabolism, contributing to neurodegeneration (Mastrogiacoma et al., 1996).
Contributions of the genetic architecture of educational attainment
Our sensitivity analyses focused on differentiating the contribution of educational attainment from the contribution of residual cognitive resilience. A few notable results emerged including the consistent genetic correlation with a number of psychiatric phenotypes and smoking phenotypes even when statistically adjusting for educational attainment. Similarly, our primary variant-level results appeared to be attenuated but comparable. In contrast to those consistent results, we did note an interesting shift in the genetic correlation between residual cognitive resilience and Alzheimer’s disease relevant phenotypes when covarying for years of education, including a nominal association with APOE that was not present in the unadjusted analyses. This striking shift occurs despite the high correlation between the primary phenotype and the education-adjusted phenotype (Pearson’s r = 0.96), highlighting how even subtle alterations in the underlying latent variable model can have substantial implications on the genetic architecture. While increasing sample size will be important to increase statistical power, it will also be important to explore residual metrics phenotypically to understand the predictive value added by incorporating or removing variance associated with classic proxy measures of cognitive reserve such as educational attainment.
Differences across diagnostic groups
It is notable that our only genome-wide variant level result was identified in cognitively normal participants. Given the differences in the proportion of cases to controls across datasets, this result may simply reflect a reduction in the phenotypic heterogeneity across data sources, and the large proportion of individuals who were cognitively normal. However, the interpretation of results in cognitively normal participants is also challenging as a slightly smaller percent of variance is explained among cognitively unimpaired participants (6–20%; Supplementary material) and a large proportion of the participants will never go on to show symptoms of Alzheimer’s disease. In our previous work, higher combined resilience did predict protection from conversion to Alzheimer’s disease even among cognitively normal participants, suggesting these metrics are relevant to protection across the diagnostic spectrum (Hohman et al., 2016b). Yet, it is likely that small variance explained by the genomic loci identified has limited clinical utility, and that additional work to understand the degree to which the heritable component of resilience contributes to longitudinal protection from Alzheimer’s disease and cognitive decline. Increasing the availability of longitudinal outcomes in large datasets with biomarkers and genomic data will allow for a more comprehensive characterization of genetic contributors to resilience.
Strengths and limitations
This project has multiple strengths including the large, well characterized cohorts, the deep phenotypic data that allowed for a quantification of residual cognitive performance given level of amyloidosis, and the comprehensive follow-up analyses highlighting novel genes and pathways contributing to resilience. The study is not without limitations. Our sample was restricted to non-Hispanic white individuals who were healthy and highly educated, limiting generalizability beyond such populations. Additionally, while we were able to fully harmonize cognitive data within the autopsy and PET analyses separately, subtle differences in the scores across autopsy and PET remain possible due to limited availability of item anchors across all cohorts. Further, we were limited to cross-sectional analyses, which leave open the possibility that some individuals will later develop more severe pathology or cognitive impairment. Additional measures of neuropathology, particularly tau and cerebrovascular pathology, may have explained additional variance in cognitive performance and is an important area for future work. Moreover, the lack of extensive neuropsychological protocols in some datasets limited our ability to investigate other cognitive domains (e.g. language or visuospatial abilities). Finally, while this is the largest analysis of the genetic predictors of residual cognition completed to date, we remained underpowered to detect single variant effects, particularly at a low minor allele frequency. Continued efforts to pool, harmonize, and analyse biomarker, autopsy, and neuropsychological data from larger, more representative cohorts will be needed to characterize the genetic architecture of resilience more fully.
Conclusions
We completed a large analysis of genetic resilience to Alzheimer’s disease and highlight several novel biological pathways that may protect the brain from the downstream consequences of amyloidosis. Our results implicate genetic drivers of bile acid homeostasis, vascular and metabolic risk factors, and neuropsychiatric conditions in Alzheimer’s disease resilience.
Acknowledgements
The results published here are in part based on data obtained from the AMP-AD Knowledge Portal (doi:10.7303/syn2580853). MSBB data were generated from post-mortem brain tissue collected through the Mount Sinai VA Medical Center Brain Bank and were provided by Dr Eric Schadt from Mount Sinai School of Medicine. MayoRNAseq data were provided by the following sources: The Mayo Clinic Alzheimer’s Disease Genetic Studies, led by Dr Nilufer Ertekin-Taner and Dr Steven G. Younkin, Mayo Clinic, Jacksonville, FL using samples from the Mayo Clinic Study of Aging, the Mayo Clinic Alzheimer’s Disease Research Center, and the Mayo Clinic Brain Bank. Study data includes samples collected through the Sun Health Research Institute Brain and Body Donation Program of Sun City, Arizona. The Brain and Body Donation Program is supported by the National Institute of Neurological Disorders and Stroke (U24NS072026 National Brain and Tissue Resource for Parkinson’s Disease and Related Disorders), the National Institute on Aging (P30-AG19610 Arizona Alzheimer’s Disease Core Center), the Arizona Department of Health Services (contract 211002, Arizona Alzheimer’s Research Center), the Arizona Biomedical Research Commission (contracts 4001, 0011, 05-901 and 1001 to the Arizona Parkinson's Disease Consortium) and the Michael J. Fox Foundation for Parkinson’s Research. Data were generated as part of the CommonMind Consortium supported by funding from Takeda Pharmaceuticals Company Limited, F. Hoffman-La Roche Ltd and NIH grants R01-MH085542, R01-MH093725, P50-MH066392, P50-MH080405, R01-MH097276, RO1-MH075916, P50-M096891, P50-MH084053S1, R37-MH057881, AG02219, AG05138, MH06692, R01-MH110921, R01-MH109677, R01-MH109897, U01-MH103392, and contract HHSN271201300031C through IRP NIMH. Brain tissue for the study was obtained from the following brain bank collections: the Mount Sinai NIH Brain and Tissue Repository, the University of Pennsylvania Alzheimer’s Disease Core Center, the University of Pittsburgh NeuroBioBank and Brain and Tissue Repositories, and the NIMH Human Brain Collection Core. CMC Leadership: Panos Roussos, Joseph Buxbaum, Andrew Chess, Schahram Akbarian, Vahram Haroutunian (Icahn School of Medicine at Mount Sinai), Bernie Devlin, David Lewis (University of Pittsburgh), Raquel Gur, Chang-Gyu Hahn (University of Pennsylvania), Enrico Domenici (University of Trento), Mette A. Peters, Solveig Sieberts (Sage Bionetworks), Thomas Lehner, Stefano Marenco, Barbara K. Lipska (NIMH). Data collection and sharing for this project was funded by the Alzheimer's Disease Neuroimaging Initiative (ADNI) (National Institutes of Health Grant U01 AG024904) and DOD ADNI (Department of Defense award number W81XWH-12-2-0012). ADNI is funded by the National Institute on Aging, the National Institute of Biomedical Imaging and Bioengineering, and through generous contributions from the following: AbbVie, Alzheimer's Association; Alzheimer's Drug Discovery Foundation; Araclon Biotech; BioClinica, Inc; Biogen Inc Cambridge, MA 02139, provided support for genotyping of the A4 Study cohort; Bristol-Myers Squibb Company; CereSpir, Inc; Cogstate; Eisai Inc; Elan Pharmaceuticals, Inc; Eli Lilly and Company; EuroImmun; F. Hoffmann-La Roche Ltd and its affiliated company Genentech, Inc; Fujirebio; GE Healthcare; IXICO Ltd; Janssen Alzheimer Immunotherapy Research & Development, LLC; Johnson & Johnson Pharmaceutical Research & Development LLC; Lumosity; Lundbeck; Merck & Co., Inc; Meso Scale Diagnostics, LLC; NeuroRx Research; Neurotrack Technologies; Novartis Pharmaceuticals Corporation; Pfizer Inc; Piramal Imaging; Servier; Takeda Pharmaceutical Company; and Transition Therapeutics. The Canadian Institutes of Health Research is providing funds to support ADNI clinical sites in Canada. Private sector contributions are facilitated by the Foundation for the National Institutes of Health (www.fnih.org). The grantee organization is the Northern California Institute for Research and Education, and the study is coordinated by the Alzheimer's Therapeutic Research Institute at the University of Southern California. ADNI data are disseminated by the Laboratory for Neuro Imaging at the University of Southern California. The Alzheimer’s Disease Genetics Consortium supported genotyping, and data processing of samples through National Institute on Aging (NIA) grants U01-AG032984. Data for this study were prepared, archived, and distributed by the National Institute on Aging Alzheimer’s Disease Data Storage Site (NIAGADS) at the University of Pennsylvania (U24-AG041689-01). Additional data collection and sharing for this project was funded by the Alzheimer's Disease Metabolomics Consortium (National Institute on Aging R01-AG046171, RF1-AG051550 and 3U01-AG024904-09S4).
Funding
This research was supported in part by K01-AG049164, R01-AG059716, R21-AG05994, K12-HD043483, K24-AG046373, HHSN311201600276P, S10-OD023680, R01-AG034962, R01-NS100980, R01-AG056534, P30-AG010161, R01-AG057914, R01-AG15819, R01-AG17917, R13-AG030995, U01-AG061356, U01-AG006781, K99-AG061238, U01-AG46152, Howard Hughes Medical Institute James H. Gilliam Fellowship for Advanced Study (FEC), F31-AG059345 (FEC), UL1-TR000445 and the Vanderbilt Memory & Alzheimer’s Center. Data collection was supported through funding by NIA grants P50-AG016574, P50-AG005136, R01-AG032990, U01-AG046139, R01-AG018023, U01-AG006576, U01-AG006786, R01-AG025711, R01-AG017216, R01-AG003949, P30-AG19610, U01-AG024904, U01-AG032984, U24-AG041689, R01-AG046171, RF1-AG051550, 3U01-AG024904-09S4, NINDS grant R01-NS080820, CurePSP Foundation, and support from Mayo Foundation.
Competing interests
R.A.S. receives research funding from Eli Lilly and Janssen and has served as a paid consultant to AC Immune, Biogen, Janssen, and Neurocentria. A.J.S. receives [F18]Flortaucipir (AV-1451) precursor support from Avid Radiopharmaceuticals. E.B.L. reports royalties from UpToDate. J.A.S. reports personal fees from Avid Radiopharmaceuticals and from Navidea Biopharmaceuticals. The remaining authors report no competing interests.
References
- ACT =
Adult Changes in Thought study
- ADGC =
Alzheimer’s Disease Genetics Consortium
- ADHD =
attention deficit hyperactivity disorder
- ADNI =
The Alzheimer’s Disease Neuroimaging Initiative
- e/h/mQTL =
expression/histone/methylation quantitative trail loci
- GWAS =
genome-wide association study
- OCD =
obsessive compulsive disorder
- ROS/MAP =
Religious Orders Study and Rush Memory and Aging Project
- SNP =
single nucleotide polymorphism
Author notes
Data used in preparation of this article were obtained from the Alzheimer’s Disease Neuroimaging Initiative (ADNI) database (adni.loni.usc.edu). As such, the investigators within the ADNI contributed to the design and implementation of ADNI and/or provided data but did not participate in analysis or writing of this report. A complete listing of ADNI investigators can be found at: http://adni.loni.usc.edu/wp-content/uploads/how_to_apply/ADNI_Acknowledgement_List.pdf

