


Abstract
Neurofilament light (NfL) is a marker of neuroaxonal injury, a prominent feature of Alzheimer’s disease. It remains uncertain, however, how it relates to amyloid and tau pathology or neurodegeneration across the Alzheimer’s disease continuum. The aim of this study was to investigate how plasma NfL relates to amyloid and tau PET and MRI measures of brain atrophy in participants with and without cognitive impairment. We retrospectively examined the association between plasma NfL and MRI measures of grey/white matter volumes in the Alzheimer’s Disease Neuroimaging Initiative [ADNI: n = 1149; 382 cognitively unimpaired control subjects and 767 cognitively impaired participants (mild cognitive impairment n = 420, Alzheimer’s disease dementia n = 347)]. Longitudinal plasma NfL was measured using single molecule array (Simoa) technology. Cross-sectional associations between plasma NfL and PET amyloid and tau measures were independently assessed in two cohorts: ADNI [n = 198; 110 cognitively unimpaired, 88 cognitively impaired (MCI n = 67, Alzheimer’s disease dementia n = 21), data accessed October 2018]; and Translational Biomarkers in Aging and Dementia [TRIAD, n = 116; 74 cognitively unimpaired, 42 cognitively impaired (MCI n = 16, Alzheimer’s disease dementia n = 26), data obtained November 2017 to January 2019]. Associations between plasma NfL and imaging-derived measures were examined voxel-wise using linear regression (cross-sectional) and linear mixed effect models (longitudinal). Cross-sectional analyses in both cohorts showed that plasma NfL was associated with PET findings in brain regions typically affected by Alzheimer’s disease; associations were specific to amyloid PET in cognitively unimpaired and tau PET in cognitively impaired (P < 0.05). Longitudinal analyses showed that NfL levels were associated with grey/white matter volume loss; grey matter atrophy in cognitively unimpaired was specific to APOE ε4 carriers (P < 0.05). These findings suggest that plasma NfL increases in response to amyloid-related neuronal injury in preclinical stages of Alzheimer’s disease, but is related to tau-mediated neurodegeneration in symptomatic patients. As such, plasma NfL may a useful measure to monitor effects in disease-modifying drug trials.
See Brier and Day (doi:) for a scientific commentary on this article.
Introduction
Alzheimer’s disease is biologically characterized by the accumulation of extracellular amyloid-β plaques and intracellular tau aggregates. These pathological hallmarks are thought to result in neurodegenerative changes via direct and synergistic effects, leading, ultimately, to cognitive impairment and functional decline. Increasingly, biomarkers of these biological processes are used in both clinical practice and research settings and in the context of clinical trials and drug development. The most commonly used Alzheimer’s disease biomarkers include structural MRI-based measures of atrophy, PET-based imaging of brain glucose metabolism, amyloid-β, and tau tangles, and CSF measures of amyloid-β, tau and neuronal injury. Hampering the use of these biomarkers, however, is the high cost and limited availability of imaging-based measures, especially PET, and the perceived invasiveness of CSF sampling. As a result, blood-based biomarkers are increasingly seen as a simplified initial screening step in primary care (Hampel et al., 2018). One such potential measure is the axonal injury marker neurofilament light (NfL) (Zetterberg, 2016). NfL is a key structural component of the neuronal cytoskeleton and is abundantly expressed in large-calibre myelinated axons (Trojanowski et al., 1986). In response to injury, NfL is released into the CSF and blood; biofluid concentrations of NfL, however, also increase in an age-dependent manner (Bridel et al., 2019). NfL has been shown to be elevated in both plasma (Mattsson et al., 2019) and CSF (Sjogren et al., 2001) in sporadic, familial and preclinical Alzheimer’s disease (Weston et al., 2017; Preische et al., 2019; Quiroz et al., 2020), and to correlate with cognitive, biochemical, imaging-based measures and post-mortem findings in Alzheimer’s disease (Zetterberg et al., 2016; Mattsson et al., 2017, 2019; Ashton et al., 2019). However, studies addressing associations between plasma NfL and imaging markers are few (Zetterberg et al., 2016; Mattsson et al., 2017, 2019; Chatterjee et al., 2018; Ashton et al., 2019; Benedet et al., 2019; Thijssen et al., 2020), and these have mostly been confined to explore predefined regions of interest and a global index of white matter change.
With consideration for the above, here we investigated the association between plasma NfL concentrations and cross-sectional amyloid-β and tau PET as well as longitudinal MRI-derived measures of grey matter and white matter atrophy in a large number of cognitively unimpaired and cognitively impaired individuals [mild cognitive impairment (MCI) and dementia due to Alzheimer’s disease]. As plasma NfL alterations are not considered specific to a particular disease but are instead linked to neurodegeneration processes, we hypothesized that, across the clinical spectrum of Alzheimer’s disease, plasma NfL would be differentially related to amyloid-β and tau pathology. We also hypothesized that plasma NfL would be associated with progressive grey and white matter atrophy.
Materials and methods
Study design and participants
This retrospective study was based on data from the ADNI (Alzheimer’s disease Neuroimaging Initiative; data downloaded October, 2018) and TRIAD (Translational Biomarkers in Aging and Dementia; data collected between November, 2017 and January, 2019) cohorts as described in Fig. 1 and the Supplementary material. In ADNI, cognitively unimpaired participants had a Mini-Mental State Examination (MMSE) score ≥24 and a Clinical Dementia Rating (CDR) score of 0. The cognitively impaired were defined as MCI if they had objective memory loss based on delayed recall performance on the Wechsler Memory Scale (logical memory II) [>1 standard deviation (SD) below the mean], MMSE scores ≥ 24, a CDR score of 0.5 and preserved activities of daily living (i.e. no dementia). Cognitively impaired individuals with Alzheimer’s disease dementia fulfilled the National Institute of Neurological Communicative Disorders and Stroke–Alzheimer Disease and Related Disorders Association (NINCDS-ADRDA) criteria for probable Alzheimer’s disease (McKhann et al., 1984), had MMSE scores between 20 and 26, and CDR scores between 0.5 and 1. In TRIAD, cognitively unimpaired and cognitively impaired groups were defined using the same criteria as in ADNI, though the Alzheimer’s disease participants had a CDR between 1 and 2. Exclusion criteria for both cohorts included the presence of medical contraindications and being enrolled concurrently in other trials or studies.
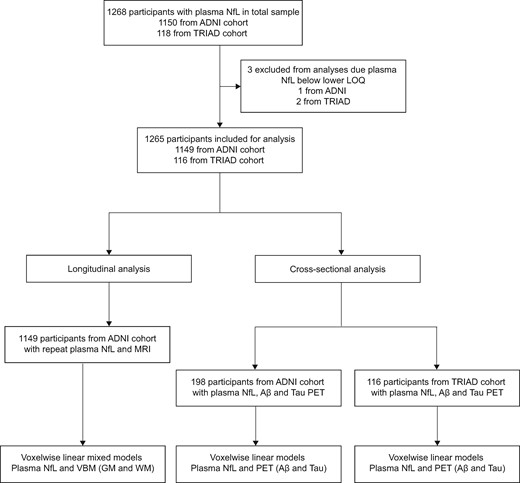
Flow diagram summarizing the study design. Longitudinal analyses were performed using data from ADNI participants only. Cross-sectional analyses were performed in a subset of ADNI participants with amyloid-β and tau PET and validated in the TRIAD cohort. Aβ = amyloid-β; GM = grey matter; LOQ = limit of quantification; VBM = voxel-based morphometry; WM = white matter. Cross-sectional analysis was performed on a subset of participants who had amyloid-β and tau PET matching closely with plasma NfL. TRIAD data were used to validate cross-sectional findings from ADNI.
Longitudinal analysis was performed using ADNI data only; cross-sectional analyses were performed in both cohorts, with the TRIAD cohort included to validate ADNI-based findings. The same inclusion/exclusion criteria were used to define cognitively unimpaired and cognitively impaired groups in ADNI and TRIAD. For the longitudinal analysis in ADNI, longitudinal plasma NfL (up to 48 months) and MRI-based measures (closest in time to plasma collection) were obtained for 1149 participants [including 382 cognitively unimpaired controls and 767 cognitively impaired participants (MCI, n = 420; Alzheimer’s disease dementia, n = 347)], as described below. The cross-sectional (ADNI-based) analysis between plasma NfL and PET-based measures of amyloid-β (18F-florbetapir) and tau (18F-flortaucipir), was also investigated using a subset of participants [n = 198, including 110 cognitively unimpaired controls and 88 cognitively impaired participants (MCI n = 67; Alzheimer’s disease dementia n = 21)]. This cross-sectional analysis was subsequently replicated in 116 participants from the TRIAD cohort [including 74 cognitively unimpaired controls and 42 cognitively impaired participants (MCI n = 16; Alzheimer’s disease dementia n = 26)] with plasma NfL, amyloid-β (18F-AZD4694) and tau (18F-MK6240) PET. For these ADNI and TRIAD-based cross-sectional analyses, selected PET scans were those closest in time to plasma NfL collection.
Regional ethical committees of all participating institutions approved the ADNI study. The Research Ethics Board of the Montreal Neurological Institute as well as the Faculty of Medicine Research Ethics Office, McGill University, approved the TRIAD study. All study participants provided written informed consent.
Plasma quantification
For both cohorts, plasma NfL concentrations were measured using an in-house immunoassay on the Single molecule array (Simoa) HD-1 Analyser (Quanterix), as previously described (Gisslen et al., 2016). Measurements were performed using a single batch of reagents for each cohort (Supplementary material).
Voxel-based morphometry
For ADNI, 1.5 T and 3 T T1-weighted MRI preprocessed scans were segmented into probabilistic grey and white matter maps. These were then non-linearly registered to the ADNI template and smoothed with a Gaussian kernel. For further details pertaining to image preprocessing, see the Supplementary material.
Brain amyloid-β and tau imaging
In the ADNI cohort, amyloid-β load was estimated using 18F-florbetapir (40–70 min post-injection) standardized uptake value ratio (SUVR) and the cerebellar grey matter as reference region.
Tau load was estimated using 18F-flortaucipir (80–100 min post-injection) SUVR, using the inferior cerebellar grey matter as reference region. Full PET details are described in the Supplementary material.
In TRIAD, amyloid-β (18F-AZD4694; 40–70 min post-injection) and tau (18F-MK6240; 90–110 min post-injection) PET scans were acquired with a Siemens High Resolution Research Tomograph (Siemens Medical Solutions). PET data were reconstructed using the OSEM algorithm on a 4D volume (18F-AZD4694, 3 × 600 s; 18F-MK6240, 4 × 300 s). SUVR maps were generated using the cerebellar grey matter as reference region for 18F-AZD4694 and the inferior cerebellar grey matter for 18F-MK6240. PET images were spatially smoothed to achieve a final resolution of 8 mm full-width at half-maximum (FWHM). T1-weighted images were acquired at 3 T for coregistration purposes and were corrected for non-uniformity and field distortion using an in-house pipeline.
Statistical analysis
The statistical software R (version 3.4.3) was used to perform statistical tests for demographic comparisons and data description. The R packages lm and nlme were used to perform linear models and linear mixed effect (LME)-based analyses, respectively. Cross-sectional data from ADNI and TRIAD were independently analysed with linear models. LME models were used only with longitudinal ADNI data to compare the progression in plasma NfL between cognitively unimpaired and cognitively impaired subjects; this model had plasma NfL as the dependent variable and included the main effects and the interaction between the independent variables time (days between baseline NfL and follow-up time points) and group and were adjusted for sex, age at initial NfL, with random intercepts accounting for the time correlation within subjects. Confidence intervals (95%) were determined based on the estimated fitted value across the distribution from 1000 simulations of the model (including all variations, except theta). Statistical significance was set at P < 0.05, two-sided.
The voxel-wise analysis also involved longitudinal and cross-sectional data. For the longitudinal data (ADNI only), two additional LME models were implemented. The first model addressed the longitudinal relationship between plasma NfL (independent variable) and voxel-based morphometry [VBM; dependent variable, adjusting for time (continuous), age at initial NfL, sex, scanner type (1.5 or 3 T) and the time between plasma collection and MRI, with a random intercept]. The second model addressed the longitudinal association between the interaction of plasma NfL (independent variable) with time in relation to the dependent variable, VBM [adjusting for time of assessment (0, 12, 24, 36 or 48 months), age, sex, scanner type (1.5 or 3 T)] and a correction factor for time gaps between plasma collection and MRI acquisitions. Voxel-based grey and white matter morphometric analyses were performed for cognitively unimpaired and cognitively impaired groups separately. Finally, voxel-wise linear models examined the cross-sectional associations between plasma NfL (predictor) and amyloid-β or tau PET (dependent variables). These models were first applied in ADNI and then subsequently reassessed in the TRIAD cohort. The linear models included corrections for either amyloid-β or tau (i.e. models with tau PET as the outcome were adjusted for global amyloid-β and vice versa), and age, sex and time interval between plasma and PET.
All voxel-wise analyses were performed using VoxelStats (Mathotaarachchi et al., 2016) and findings were corrected for multiple comparisons using random field theory. Since we hypothesized that elevated plasma NfL would be associated with elevated amyloid-β and tau PET and decreased brain volume using VBM, one-tailed hypothesis tests with a type I error α < 0.05 were performed.
For complete details on the statistical models and voxel-wise analyses, see the Supplementary material.
Data availability
Raw data are available for download upon request at http://adni.loni.usc.edu. Derived data supporting the findings of this study are available from the corresponding author on request.
Results
Demographic characteristics
A total of 1265 subjects were included in the present study (Table 1 and Supplementary material). From the ADNI cohort, 1149 subjects were included; of these, 215 had only baseline data available. The initial plasma NfL concentrations were on average higher in the cognitively impaired group compared to the cognitively unimpaired group (t = 6.65; P < 0.0001; Fig. 2A), adjusting for age and sex. Plasma NfL was highly associated with age (t = 19.50; P < 0.0001), but not with sex, education or APOE ε4 status when adjusting for diagnosis. In the TRIAD cohort, comprising 116 participants with cross-sectional data, cognitively impaired participants had higher levels of plasma NfL (t = 2.55; P = 0.011; Fig. 2B), compared to cognitively unimpaired participants. Similar to ADNI, age had a large effect on plasma NfL (t = 4.23; P < 0.0001) but sex, education and APOE ε4 status (when adjusting for diagnosis), did not.
Demographics and key characteristics of the ADNI and TRIAD cohorts
| ADNI | TRIAD | |||||
|---|---|---|---|---|---|---|
| CU | CI | P-value* | CU | CI | P-value* | |
| Subjects, n (%) | 382 (33.2) | 767 (66.7) | NA | 74 (63.7) | 42 (36.2) | NA |
| Age, years, mean (SD) | 73.5 (6.9) | 74.4 (7.8) | 0.05 | 72.4 (6.2) | 70.4 (8.5) | 0.15 |
| Males, n (%) | 173 (45.3) | 456 (59.5) | <0.001 | 24 (32.4) | 21 (50.0) | 0.09 |
| Education, years, mean (SD) | 16.6 (2.5) | 15.9 (2.7) | <0.001 | 15.3 (4.2) | 13.7 (3.8) | 0.04 |
| APOE ε4, n (%) | 106 (27.7) | 395 (51.6) | <0.001 | 25 (33.8) | 17 (40.5) | 0.10 |
| MMSE, mean (SD) | 29.0 (1.1) | 26.4 (3.4) | <0.001 | 28.9 (1.3) | 23.4 (5.3) | <0.001 |
| Plasma NfL, ng/l | 35.2 (16.7) | 44.0 (22.2) | <0.001 | 27.3 (19.2) | 34.5 (13.7) | 0.01 |
MMSE = Mini-Mental State Examination; NA = not applicable.
P-values were calculated comparing cognitively unimpaired (CU) and cognitively impaired (CI) subjects, within each cohort, using t-test for continuous variables and χ2 test for categorical variables.
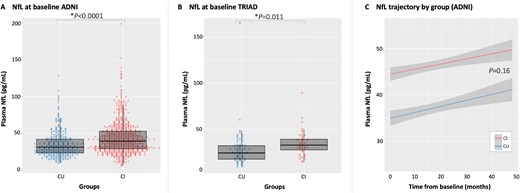
Plasma NfL. Findings from linear models (adjusted by age and sex) showed that differences in plasma NfL levels were seen between cognitively unimpaired (CU) and cognitively impaired (CI) subjects in both ADNI (A) and TRIAD (B) cohorts cross-sectionally. Cognitively impaired participants also showed higher plasma NfL concentrations compared to cognitively unimpaired participants (C) longitudinally, as shown by LME modelling.
When using longitudinal data from ADNI, the LME analysis showed that plasma NfL differed between groups over time (tgroups = 6.58, P < 0.0001; Fig. 2C). However, no difference was found between the slopes [tinteraction (groups × time) = 1.40; P = 0.16], indicating that the rate of increase in plasma NfL levels did not differ between groups (plasma NfL time-point correlations are presented in the Supplementary material). Comparison of plasma NfL concentrations in the cognitively unimpaired and cognitively impaired by amyloid-β status showed that amyloid-β-positive subjects had higher concentrations of plasma NfL cross-sectionally (Supplementary material) and a steeper rate of progression over time, compared to amyloid-β-negative subjects (Supplementary material).
Plasma NfL is associated with amyloid-β and tau in Alzheimer’s disease-related brain areas
The cross-sectional voxel-wise analysis showed an association between plasma NfL and 18F-florbetapir in cognitively unimpaired participants [Fig. 3A; ADNI, t(103) and TRIAD, t(67) > 3.21, both P < 0.05]. These associations were seen primarily in the posterior cingulate/precuneus, parietal cortex, frontal and temporal cortices (peak t-values, along with their coordinates/exact P-values, and effect size information, are available in the Supplementary material). No significant associations were seen between plasma NfL and amyloid PET among cognitively impaired subjects.

Plasma NfL and PET biomarkers. T-statistical parametric maps (T-maps) superimposed on average structural MRI show brain regions where higher NfL levels were associated with higher 18F-florbetapir (ADNI) and 18F-AZD4694 (TRIAD) SUVRs in the cognitively unimpaired (CU) group (A). In the cognitively impaired (CI) group (B), T-maps also show brain regions where higher NfL levels are associated with higher 18F-flortaucipir (ADNI) and 18F-MK6240 (TRIAD) in cognitively impaired subjects. T-values that were significant after random field theory correction for multiple comparisons are indicated in the text.
In ADNI, 18F-flortaucipir showed some association with plasma NfL in the cognitively impaired group [t(79) > 3.19, P < 0.05; Fig. 3B], although these results did not survive multiple comparison correction. In the TRIAD cohort, tau load (18F-MK6240) and plasma NfL were associated only in the cognitively impaired group [t(35) > 3.34, P < 0.05], showing strong associations in the frontal and temporal regions.
Plasma NfL is associated with grey matter atrophy in Alzheimer’s disease-related brain areas in APOE ε4 carriers
The voxel-wise LME (adjusted for time and other covariates) demonstrated increases in plasma NfL levels associated with reduced grey matter volume in cognitively unimpaired [t(1000) < −3.09, P < 0.05; Fig. 4A) and cognitively impaired participants [t(1969) < −3.09, P < 0.05; Fig. 4B]. Associations in the cognitively unimpaired group were confined to small clusters in the frontal lobe and hippocampus. Among cognitively impaired participants, more widespread associations were seen in frontal and temporal cortices, as well as in the medial temporal lobe.
![Plasma NfL and grey matter volume. T-statistical parametric maps (T-maps) superimposed on average structural MRI show brain regions where higher NfL levels were associated with reduced grey matter volume in cognitively unimpaired (CU; A) and cognitively impaired (CI; B) participants, subdivided by APOE ε4 status [carriers (+) or non-carriers (−)]. T-maps also show that, as compared to baseline, only at 48 months was there a reduction of grey matter (GM) volume associated with plasma NfL in cognitively unimpaired subjects (C), while in the cognitively impaired group differences were observed at each time point (D). T-values that were significant after random field theory correction for multiple comparisons are indicated in the text.](https://oup.silverchair-cdn.com/oup/backfile/Content_public/Journal/brain/143/12/10.1093_brain_awaa342/5/m_awaa342f4.jpeg?Expires=1749946319&Signature=0lcV7DaBD07jZBaSoilJYBUQIdQ-2YliKRuNYUU6poZJYGn0O9FxZ7Z-VBSQ6IdRyS8BXVMt-GIrWdXJ1bfAj9~0jp6ADCa2BusbHkKpM6dz2HsRFvRhbKNpIhnunw96PN0MviKM6JDlknZvusKnPL6tg7qcfuNgFQSh~scPP4VTCCEb581E0B2VGSbrLdC48LfLCcjPldwB-g1kECXgFH6lEaiXpNJlHHTn~TqNuTr8IczNyXP5ycJlXgFrrYytYFL-GFkwrC9lbR6O5Nt3KFee-m6vSt-vnL7ajlGUuUqHmvi5bCkkR0BofMNuv~eEwdn9J9qUfN6ogDMOJida6Q__&Key-Pair-Id=APKAIE5G5CRDK6RD3PGA)
Plasma NfL and grey matter volume. T-statistical parametric maps (T-maps) superimposed on average structural MRI show brain regions where higher NfL levels were associated with reduced grey matter volume in cognitively unimpaired (CU; A) and cognitively impaired (CI; B) participants, subdivided by APOE ε4 status [carriers (+) or non-carriers (−)]. T-maps also show that, as compared to baseline, only at 48 months was there a reduction of grey matter (GM) volume associated with plasma NfL in cognitively unimpaired subjects (C), while in the cognitively impaired group differences were observed at each time point (D). T-values that were significant after random field theory correction for multiple comparisons are indicated in the text.
Given the above described association between plasma NfL and amyloid PET in cognitively unimpaired subjects, cognitively unimpaired and cognitively impaired groups were subdivided according to APOE ε4 status due to ε4 carriers being more likely to have amyloid-β accumulation (Morris et al., 2010; Fleisher et al., 2013). When doing so, a clear distinction was seen between APOE ε4 carriers and non-carriers among cognitively unimpaired subjects, with findings localized in the frontal, posterior cingulate and temporal cortices of ε4 carriers only [t(260) < −3.12, P < 0.05] and no associations found in ε4 non-carriers. Among the cognitively impaired subjects, no clear differences were seen between APOE ε4 carriers and non-carriers, with both groups showing significant associations between plasma NfL and grey matter volume [tcarriers(1009) < −3.09, tnon-carriers(951) < −3.09, P < 0.05], mainly in the temporal cortices. APOE ε4 carriers, however, appeared to have more medial temporal atrophy.
When examining the association between grey matter volume and plasma NfL over time (NfL × time), cognitively unimpaired subjects only showed significant findings for the contrast baseline versus 48 months [t(993) < −3.09, P < 0.05; Fig. 4C], with results seen primarily in the frontal and temporal cortices. Cognitively impaired subjects, by contrast, showed a progressive reduction in grey matter volume associated with increased plasma NfL, predominantly in the temporal cortex [t(1962) < −3.09, P < 0.05; Fig. 4D].
Plasma NfL correlates with white matter atrophy
In addition to grey matter loss, increases in plasma NfL concentrations were accompanied by a reduction in white matter volume. Using voxel-wise LME (adjusted for time and other covariates), cognitively unimpaired participants showed significant associations between plasma NfL and white matter volume in the hippocampus, parietal and prefrontal cortices [t(1005) < −3.09, P < 0.05; Fig. 5A]; however, these findings were very focal. By contrast, widespread associations were seen within the cognitively impaired group [t(1947) < −3.09, P < 0.05]. When the LME tested the effect of NfL and time (interaction) on white matter, plasma NfL was found to associate with white matter volume in superior periventricular areas in the cognitively unimpaired group [t(998) < −3.09, P < 0.05; Fig. 5B]. Only at Month 36, however, was it possible to detect clear findings in temporal regions. In the cognitively impaired group, by contrast, these associations were seen at 12 months in temporal regions [t(1940) < −3.09, P < 0.05; Fig. 5C] and spread across the additional time points.
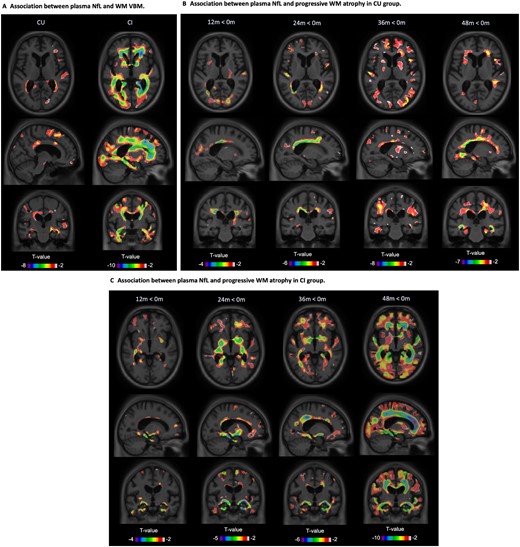
Plasma NfL and white matter volume. T-statistical parametric maps (T-maps) superimposed on average structural MRI show brain regions where higher NfL levels were associated with reduced white matter (WM) volume in cognitively unimpaired (CU) and cognitively impaired (CI) participants (A). T-maps also showed that, compared to baseline, there was a reduction of white matter volume associated with plasma NfL in cognitively unimpaired (B) and cognitively impaired groups (C) at each time point (D). T-values that were significant after random field theory correction for multiple comparisons are indicated in the text.
Discussion
The present study, to our knowledge, is the first to examine the associations between plasma NfL and whole brain imaging measures of amyloid-β, tau pathology and atrophy (grey and white matter). Consistent with previous work (Sjogren et al., 2000; Mattsson et al., 2017, 2019; Ashton et al., 2019), we showed a linear increase in plasma NfL levels from cognitively unimpaired controls through MCI and Alzheimer’s disease. Our main finding was that the associations between NfL, the aggregation of amyloid-β and tau, and brain atrophy, were disease stage-specific. Specifically, while a positive correlation was observed between plasma NfL and amyloid-β PET in cognitively unimpaired participants, NfL was found to correlate with tau PET in cognitively impaired patients. We also observed that NfL and grey matter atrophy associations, found in cognitively unimpaired and cognitively impaired individuals, were dependent on APOE ε4 status only in cognitively unimpaired individuals. Importantly, these associations predominantly occurred in voxels within Alzheimer’s disease-related brain areas. Despite longitudinal increases in plasma NfL, its association with grey matter volume loss was only evident at 48 months in cognitively unimpaired subjects, while in cognitively impaired subjects the association between NfL and grey matter volume progressively increased over 48 months. In cognitively unimpaired subjects, NfL was also associated with small foci of white matter atrophy in the anterior and posterior cingulate as well as the angular bundle, contrasting with a more global pattern of white matter atrophy in cognitively impaired subjects. In fact, the longitudinal associations between plasma NfL and white matter atrophy progressively involved the entire periventricular region in cognitively unimpaired subjects, in contrast to cognitively impaired subjects, where the more widespread findings observed at 48 months seemed to have propagated from the temporal lobe.
The observed relationship between plasma NfL and amyloid-β load among cognitively unimpaired subjects was in agreement with the existing literature. Although a negligible degree of neuronal injury has been reported in preclinical Alzheimer’s disease (i.e. amyloid-β-positive cognitively unimpaired) (Mattsson et al., 2017), our results corroborate the framework proposing that the initial neural injury in Alzheimer’s disease pathophysiology, here indexed by plasma NfL, is linked to the accumulation of amyloid-β, rather than tau (Mielke et al., 2019). Another study demonstrated that baseline plasma NfL among cognitively unimpaired subjects did not relate significantly to amyloid-β accumulation over a short follow-up interval, although increases in plasma NfL tracked increased signal from amyloid-β PET (Mielke et al., 2019). In addition, the brain regions found here to be linking amyloid-β to neurodegeneration in cognitively unimpaired are frequently reported as having high levels of amyloid-β in Alzheimer’s disease (Grothe et al., 2017). This scenario would prove consistent with the topographical overlap we observed between areas showing significant associations between plasma NfL and amyloid PET (e.g. the temporal cortex and precuneus), and areas showing declines in grey matter volume. Similarly, one study has shown that the association between NfL and amyloid-β was also accompanied by declines in hippocampal volume and global cortical thickness and speculated that the observed association with amyloid PET may reflect Alzheimer’s disease-related neurodegeneration (Mielke et al., 2019). The observed association between plasma NfL levels and hippocampal white matter atrophy supports previous work showing that white matter integrity in this structure is affected early on in the course of Alzheimer’s disease (Salat et al., 2010), likely due to the accumulation of tau pathology (Jacobs et al., 2018).
In contrast with the cognitively unimpaired group, plasma NfL associations were confined to tau PET among cognitively impaired subjects. While there are—to date—no other studies that have used tau PET when looking at plasma NfL in both cognitively unimpaired and cognitively impaired groups, a recent study in cognitively impaired subjects reported associations between plasma NfL and tau PET similar to those presented here (Thijssen et al., 2020). In addition, previous work has shown plasma NfL to positively correlate with CSF phosphorylated tau (p-tau) over time in cognitively impaired subjects (Mattsson et al., 2019). Similar findings have also been reported using NfL from cross-sectional plasma and CSF samples (Zetterberg et al., 2016; Pereira et al., 2017). The fact that the association was specific to tau in the cognitively impaired group may reflect cognitively impaired subjects showing continued accumulation of tau pathology (McDade and Bateman, 2018), in contrast with amyloid-β deposition, which is thought to plateau during the symptomatic course of Alzheimer’s disease (Jack et al., 2013b). Voxel-wise associations between plasma NfL and tau PET differed between cohorts, however, with findings that did not survive multiple comparison correction in ADNI, in contrast to robust positive associations within frontotemporal regions in the TRIAD cohort. This observed difference may relate to differing time intervals between plasma sampling and tau PET between cohorts. Although models accounted for this difference, this, combined with 18F-flortaucipir and 18F-MK6240 differing in their sensitivity to tau aggregates (Hostetler et al., 2016), may account for the observed discrepancy. In addition, as compared with ADNI, the TRIAD cohort included patients with more advanced disease stage, as evidenced by CDR ranges; this may have influenced our findings. Overall, however, the overlap of NfL-associated brain regions between cohorts and in comparison with previously reported findings (Thijssen et al., 2020) suggests that the reported associations are valid.
The discrepancies in the association of plasma NfL with amyloid-β and tau PET in the cognitively unimpaired and cognitively impaired groups, as discussed above, are in line with the literature suggesting a pathophysiological model for Alzheimer’s disease in which amyloid-β biomarkers become abnormal earlier than tau biomarkers (Jack et al., 2013a). Both processes, however, are upstream from neurodegeneration. This may partially explain the differential association observed between plasma NfL and PET findings across groups. Importantly, however, our findings remain correlational at the cross-sectional level and cannot support any claims of causality.
Using VBM, plasma NfL was found to associate with both grey and white matter volume loss in cognitively unimpaired and cognitively impaired subjects. Using grey matter VBM data, although findings were limited when looking across all cognitively unimpaired subjects, analysis by APOE subgroups (ε4 carriers and non-carriers) showed significant declines in grey matter volume in temporal, posterior cingulate and orbitofrontal regions among ε4 carriers. As described above, these findings overlapped spatially with areas that showed a significant association between plasma NfL and amyloid-β imaging and may be due to APOE ε4 carriers showing enhanced amyloid-β deposition (Reiman et al., 2009). Reinforcing this idea, we have shown in a recent study (Benedet et al., 2019) that neurodegeneration in cognitively unimpaired subjects, indexed by reduced 18F-fluorodeoxyglucose PET uptake, was only associated with NfL in amyloid-β-positive individuals, displaying regional associations similar to those described above. Longitudinally, only at 48 months, however, was the relationship between grey matter VBM and plasma NfL seen to progress. This suggests a temporal delay between the build-up of amyloid-β pathology and neuronal injury. As hypothesized, among cognitively impaired subjects, the coupling between NfL and grey matter loss was more pronounced, particularly within the temporal lobe, and showed a continuous increase across time points. Moreover, associated areas overlapped with those showing significant associations between plasma NfL and tau PET. These findings are consistent with neuroimaging studies showing progressive neuronal loss across the symptomatic phase of Alzheimer’s disease (Jack et al., 2004) and the co-localization of tau and neurodegeneration (Benedet et al., 2019). Not surprisingly, no notable difference was seen in the grey matter associations between cognitively impaired APOE ε4 carriers and non-carriers. As expected, at this disease stage the majority of the subjects showed evidence of amyloidosis and neurodegeneration, regardless of their APOE ε4 status.
In addition to the loss of cortical neurons, white matter injury (Migliaccio et al., 2012) and the loss of cortico-subcortical connectivity (Delbeuck et al., 2003) are features of Alzheimer’s disease. In cognitively unimpaired and cognitively impaired subjects, the extent of white matter volume loss exceeded that of grey matter loss. This finding is also in agreement with early CSF studies showing an association between NfL and CT measures of white matter changes (Sjogren et al., 2001). Since plasma NfL levels are understood to reflect damage to large-calibre myelinated axons (Ashton et al., 2019), this would suggest that white matter damage may precede grey matter loss in Alzheimer’s disease. Indeed, there is evidence to support the position that white matter abnormalities precede grey matter changes: CSF amyloid-β levels correlate with white matter lesions in cognitively normal elderly (Skoog et al., 2018), and changes in CSF tau measures and amyloid-β1–42 have been shown to predict magnetic resonance-based measures of white matter integrity in cognitively unimpaired individuals at risk of Alzheimer’s disease in the absence of effects on grey matter (Bendlin et al., 2012). Moreover, soluble amyloid-β is toxic to oligodendrocytes (Lee et al., 2004) and elevated in the white matter (Collins-Praino et al., 2014). Further, while the neocortical tau pathology seen in Alzheimer’s disease mainly affects grey matter, glial tangles are also seen in oligodendroglia (Ballatore et al., 2007) and phosphorylated tau in grey matter has been shown to be associated with demyelination and white matter abnormalities in Alzheimer’s disease (McAleese et al., 2017). Amyloid-β and tau may thus first result in white matter damage, as reflected by increases in plasma NfL, which subsequently result in grey matter loss but with a spatiotemporally offset course.
This study has limitations. First, we did not account for vascular burden in our analyses, which may limit the interpretation of findings. In addition, the ADNI and TRIAD cohorts used for cross-sectional analyses differed in sample size, in the average time interval between plasma and PET measurements, and in the PET tracers used. While the difference in the time between plasma and PET was accounted for in statistical models, this may have affected the comparability of findings between cognitively impaired groups. Furthermore, even though plasma NfL measurements for both ADNI and TRIAD were performed in the same laboratory using the same in-house assay, different batches of reagents were used in these studies, resulting in plasma NfL levels being higher in ADNI compared to TRIAD; this difference was confirmed by evaluating the internal controls used, which were the same in both analyses. Despite these differences, however, it is important to stress that results were quite similar between cohorts. Moreover, a larger sample size combined with the inclusion of non-Alzheimer’s disease subjects and longitudinal PET data would have allowed us to have a detailed investigation of the ability of plasma NfL to capture the neurodegenerative effects of both amyloid-β and tau, as well as aspects of neuronal damage that are non-related to either proteinopathy. Lastly, though not the aim of this study, the current study design precludes us teasing apart the exact contributions of amyloid-β, tau and neurodegeneration to plasma NfL levels.
In conclusion, the present findings suggest that plasma NfL may prove a marker of early amyloid-β-related neuronal injury in Alzheimer’s disease at its presymptomatic stage, being in turn more closely related to tau-mediated neurodegeneration during the symptomatic course of the disease. Further, the association of elevated plasma NfL to widespread grey and white matter loss provides further evidence supporting the use of NfL as marker of progressive neuronal damage.
Funding
Data collection and sharing for this project was funded by the Alzheimer's Disease Neuroimaging Initiative (ADNI) (National Institutes of Health Grant U01 AG024904) and DOD ADNI (Department of Defense award number W81XWH-12-2-0012). ADNI is funded by the National Institute on Aging, the National Institute of Biomedical Imaging and Bioengineering, and through generous contributions from the following: AbbVie, Alzheimer’s Association; Alzheimer’s Drug Discovery Foundation; Araclon Biotech; BioClinica, Inc.; Biogen; Bristol-Myers Squibb Company; CereSpir, Inc.; Cogstate; Eisai Inc.; Elan Pharmaceuticals, Inc.; Eli Lilly and Company; EuroImmun; F. Hoffmann-La Roche Ltd and its affiliated company Genentech, Inc.; Fujirebio; GE Healthcare; IXICO Ltd.; Janssen Alzheimer Immunotherapy Research & Development, LLC.; Johnson & Johnson Pharmaceutical Research & Development LLC.; Lumosity; Lundbeck; Merck & Co., Inc.; Meso Scale Diagnostics, LLC.; NeuroRx Research; Neurotrack Technologies; Novartis Pharmaceuticals Corporation; Pfizer Inc.; Piramal Imaging; Servier; Takeda Pharmaceutical Company; and Transition Therapeutics. The Canadian Institutes of Health Research is providing funds to support ADNI clinical sites in Canada. Private sector contributions are facilitated by the Foundation for the National Institutes of Health (www.fnih.org). The grantee organization is the Northern California Institute for Research and Education, and the study is coordinated by the Alzheimer’s Therapeutic Research Institute at the University of Southern California. ADNI data are disseminated by the Laboratory for Neuro Imaging at the University of Southern California. This work was also supported by the Canadian Institutes of Health Research (CIHR) (MOP-11-51-31), the Alzheimer’s Association (NIRG-08-92090), Canadian Consortium of Neurodegeneration in Aging (CIHR-CCNA) and the Weston Brain Institute. A.L.B. is supported by the CAPES Foundation - Brazil [0327/13-1]. N.J.A. is funded by the Wallenberg Centre for Molecular and Translational Medicine. K.B. is supported by the Torsten Söderberg Foundation, Stockholm, Sweden, is supported by the Swedish Research Council (#2017-00915), the Swedish Alzheimer Foundation (#AF-742881), Hjärnfonden, Sweden (#FO2017-0243), and a grant (#ALFGBG-715986) from the Swedish state under the agreement between the Swedish government and the County Councils, the ALF-agreement. H.Z. is a Wallenberg Scholar supported by grants from the Swedish Research Council (#2018-02532), the European Research Council (#681712), Swedish State Support for Clinical Research (#ALFGBG-720931) and the UK Dementia Research Institute at UCL. P.R.-N. is supported by the Weston Brain Institute, the Canadian Institutes of Health Research, the Canadian Consortium on Neurodegeneration in Aging and the Fonds de Recherche du Québec – Santé (FRQS; Chercheur Boursier, and 2020-VICO-279314 TRIAD/BIOVIE Cohort), the CIHR-CCNA Canadian Consortium of Neurodegeneration in Aging, and the Canada Foundation for Innovation (project 34874). S.G. and P.R-N. are members of the CIHR Canadian Consortium of Neurodegeneration in Aging.
Competing interests
K.B. has served as a consultant or on advisory boards for Alector, Alzheon, CogRx, Biogen, Lilly, Novartis and Roche Diagnostics, and is a co-founder of Brain Biomarker Solutions in Gothenburg AB (BBS), which is a part of the GU Ventures Incubator Program, all unrelated to the submitted work. H.Z. has served at scientific advisory boards for Denali, Roche Diagnostics, Wave, Samumed, Siemens Healthineers, Pinteon Therapeutics and CogRx, has given lectures in symposia sponsored by Fujirebio, Alzecure and Biogen, and is a co-founder of Brain Biomarker Solutions in Gothenburg AB (BBS), which is a part of the GU Ventures Incubator Program, all unrelated to the submitted work.
Supplementary material
Supplementary material is available at Brain online.
References
Author notes
Andréa L. Benedet and Antoine Leuzy contributed equally to this work.
Data used in preparation of this article were also obtained from the Alzheimer’s Disease Neuroimaging Initiative (ADNI) database (adni.loni.usc.edu). As such, the investigators within the ADNI contributed to the design and implementation of ADNI and/or provided data but did not participate in analysis or writing of this report. A complete listing of ADNI investigators can be found at: http://adni.loni.usc.edu/wp-content/uploads/how_to_apply/ADNI_Acknowledgement_List.pdf

