


Abstract
Epidemiological and experimental studies suggest that a disease-aggravating neuroinflammatory process is present at preclinical stages of Alzheimer’s disease. Given that individuals with Down syndrome are at increased genetic risk of Alzheimer’s disease and therefore develop the spectrum of Alzheimer’s neuropathology in a uniform manner, they constitute an important population to study the evolution of neuroinflammation across the Alzheimer’s continuum. Therefore, in this cross-sectional study, we characterized the brain inflammatory profile across the lifespan of individuals with Down syndrome. Microglial morphology and inflammatory cytokine expression were analysed by immunohistochemistry and electrochemiluminescent-based immunoassays in the frontal cortex from foetuses to adults with Down syndrome and control subjects (16 gestational weeks to 64 years), totalling 127 cases. Cytokine expression in mixed foetal primary cultures and hippocampus of adults with Down syndrome, as well as the effects of sex on cytokine expression were also analysed. A higher microglial soma size-to-process length ratio was observed in the frontal cortex of children and young adults with Down syndrome before the development of full-blown Alzheimer’s pathology. Moreover, young adults with Down syndrome also displayed increased numbers of rod-like microglia. Increased levels of interleukin-8 and interleukin-10 were observed in children with Down syndrome (1–10 years; Down syndrome n = 5, controls n = 10) and higher levels of interleukin-1β, interleukin-1α, interleukin-6, interleukin-8, interleukin-10, interleukin-15, eotaxin-3, interferon gamma-induced protein 10, macrophage-derived chemokine, and macrophage inflammatory protein-beta, were found in young adults with Down syndrome compared to euploid cases (13–25 years, Down syndrome n = 6, controls n = 24). Increased cytokine expression was also found in the conditioned media of mixed cortical primary cultures from second trimester foetuses with Down syndrome (Down syndrome n = 7, controls n = 7). Older adults with Down syndrome (39–68 years, Down syndrome n = 22, controls n = 16) displayed reduced levels of interleukin-10, interleukin-12p40, interferon-gamma and tumour necrosis factor-alpha. Microglia displayed larger somas and shorter processes. Moreover, an increase in dystrophic microglia and rod-like microglia aligning to neurons harbouring tau pathology were also observed. Sex stratification analyses revealed that females with Down syndrome had increased interleukin-6 and interleukin-8 levels compared to males with Down syndrome. Finally, multivariate projection methods identified specific cytokine patterns among individuals with Down syndrome. Our findings indicate the presence of an early and evolving neuroinflammatory phenotype across the lifespan in Down syndrome, a knowledge that is relevant for the discovery of stage-specific targets and for the design of possible anti-inflammatory trials against Alzheimer’s disease in this population.
Introduction
Down syndrome is a genetic disorder arising from complete or partial trisomy of chromosome 21 (T21) (Lejeune et al., 1959). As the amyloid precursor protein gene is encoded on this chromosome, adults with Down syndrome are at a high genetic risk of developing early-onset dementia due to Alzheimer’s disease (Ballard et al., 2016).
Individuals with Down syndrome display neuropathological features of Alzheimer’s disease from early in life. Soluble accumulation of amyloid-β can be detected in the brains of foetuses with Down syndrome as early as 15–21 weeks of gestational age (Teller et al., 1996; Busciglio et al., 2002) and intraneuronal amyloid-β is present before the development of amyloid plaques in young individuals with Down syndrome (Gyure et al., 2001; Busciglio et al., 2002; Mori et al., 2002). This is followed by the formation of diffuse amyloid plaques during childhood (8–12 years old) (Lemere et al., 1996; Gyure et al., 2001; Mori et al., 2002) and later by mature amyloid plaques, which are commonly present in 30-year-old individuals with Down syndrome (Handen et al., 2012; Lao et al., 2017; Abrahamson et al., 2019), followed by abnormal tau phosphorylation (Rafii et al., 2017; Davidson et al., 2018; Perez et al., 2019). By 40–60 years of age, a full-blown Alzheimer’s neuropathology, composed of widespread accumulation of mature amyloid plaques and neurofibrillary tangles, is present throughout the brains of those with Down syndrome (Wisniewski et al., 1985). Furthermore, neurodegeneration (Yates et al., 1980, 1981; Mann et al., 1985; Reynolds and Godridge, 1985; Godridge et al., 1987; Reynolds and Warner, 1988; Kim et al., 2001; Martin et al., 2014), cerebral oxidative stress (Busciglio and Yankner, 1995; Busciglio et al., 2002; Cenini et al., 2012; Di Domenico et al., 2014), neurotrophic factor deregulation (Iulita et al., 2014), white matter degeneration (Powell et al., 2014; Olmos-Serrano et al., 2016; Romano et al., 2018), and cerebral amyloid angiopathy (Carmona-Iragui et al., 2017; Head et al., 2017), are also present in Down syndrome brains.
It has been widely acknowledged that neuroinflammation plays an important role in the development and progression of Alzheimer’s disease in the general population (Akiyama et al., 2000). However, little is known about the evolution of neuroinflammation in Alzheimer’s disease and few investigations have examined the occurrence of neuroinflammation in Down syndrome. Microglial and astrocytic activation, increased inflammatory gene expression, formation of immune complexes, and cerebral oxidative stress have been reported to occur at different ages in Down syndrome brains (Eikelenboom and Stam, 1982; McGeer et al., 1987, 1988; Griffin et al., 1989; Stoltzner et al., 2000; Head et al., 2001; Xue and Streit, 2011; Wilcock et al., 2015). However, a detailed analysis of microglial activation and brain inflammatory cytokine expression across the lifespan of individuals with Down syndrome is lacking. Such information might reveal shared pathological pathways between individuals with Down syndrome and Alzheimer’s disease in the general population, assisting in the identification of potential therapeutic targets.
With the objective of achieving a comprehensive understanding of neuroinflammation in Down syndrome we gathered the largest cohort of post-mortem Down syndrome brains to investigate microglial morphological changes and inflammatory cytokine expression before and after the occurrence of overt Alzheimer’s neuropathology, in frontal cortex tissue from foetal to adult stages. We complemented these findings with analyses of mixed primary cultures from foetal Down syndrome cortex. Our results indicate that young individuals with Down syndrome have a heightened neuroinflammatory profile in the frontal cortex characterized by early microglial intermediate activation, and an increase in rod-like microglia along with an upregulation of key inflammatory cytokines. In contrast, even though older adults with Down syndrome also show an upregulation of brain inflammatory mediators, the inflammatory signature was characterized by a downregulation of potent inflammatory cytokines and an increase of dystrophic microglia; likely a result of a low grade chronic inflammatory response. Our results revealed differential neuroinflammatory responses across the lifespan of individuals with Down syndrome, supporting the concept of early and late neuroinflammatory processes as it has been hypothesized for Alzheimer’s disease (Cuello, 2017; Rogers, 2018).
Materials and methods
Human brain tissue
Available post-mortem fixed and frozen brain tissue from the frontal cortex of individuals with Down syndrome (T21) and age-matched control subjects (euploids) were obtained from the brain banks at the Alzheimer’s disease Research Centre, University of California Irvine, New York University School of Medicine, and the NIH Neurobiobank (University of Maryland and Pittsburgh’s University), totalling 102 samples. Additionally, hippocampal frozen tissue was available for 25 older adult cases (NIH Neurobiobank). The leading cause of death of the control subjects was accidental and no major neuropathological abnormalities were reported for this group. Cause of death and post-mortem pathological reports are available from the biobanks upon request. The age range for the cortical foetal samples was 18–23 gestational weeks and 1–68 years for the cortical and hippocampal samples. Confirmation of full T21 was performed at the brain repositories. Demographic information is detailed in Supplementary Tables 1–5. This project was approved by the McGill University Research Ethics Board.
Immunohistochemistry
Detection of microglial cells, amyloid-β and phosphorylated tau was performed using immunohistochemical techniques. A detailed description of immunohistochemistry procedures can be found in the Supplementary material.
Quantification of microglial morphological changes
Microglial soma size and process length were quantified using a multi-step algorithm using Fiji software (Schindelin et al., 2012) with the MorpholibJ plugin (Legland et al., 2016). See Supplementary material for details and for a description of dystrophic microglial quantification. The demographics for these analyses are illustrated in Supplementary Table 3.
Rod microglia quantification
Rod microglia were quantified in Iba-1 immunolabelled sections from young adults and older adults as detailed in the Supplementary material. Demographic information for these cases is available in Supplementary Table 4.
Inflammatory cytokine expression analyses
Inflammatory protein expression in post-mortem brain tissue was measured using multiplex electrochemiluminescent-based immunoassays (MesoScale Discovery) (Supplementary Table 6). Conditioned media cytokines were detected with bead-based multiplex assay (Eve Technologies, Inc) (Supplementary Table 7). Sample preparation and assay conditions are described in the Supplementary material.
Statistical analysis
Univariate analysis
Data were analysed with GraphPad Prism 8. For two-group comparisons, two-tailed unpaired Student’s t-tests and two-tailed Mann-Whitney tests were used according to data distribution (Shapiro-Wilk normality test). When appropriate, one-way ANOVA or Kruskal-Wallis tests were used followed by Tukey or Dunn’s post hoc tests, respectively, with appropriate multiple comparison adjustment. Categorical variables were assessed by performing Fisher’s exact test. Sex differences on inflammatory protein expression and rod-like microglia were assessed using a two-way ANOVA followed by Tukey’s test corrected for multiple comparisons. Data are displayed in box plots where the box represents the interquartile interval in which the upper and bottom ends of the box represent the third and the first quartile, respectively. The horizontal line in the box represents the median. The vertical lines or whiskers extending from the box represent the minimum and maximum values in the data. Full circles represent outliers according to Tukey’s rule. Numerical data are presented in Supplementary Tables 8–11. Extreme values, defined as three times the interquartile range (IQR), were excluded from the analyses. Significance was set at P < 0.05.
Multivariate analysis
Principal component analysis (PCA) and partial least squares discrimination analysis (PLS-DA) were performed using the ropls package (Thevenot et al., 2015) in R 3.6.3 according to the description in the Supplementary material.
Data availability
The data supporting the findings of these studies are available from the corresponding author upon reasonable request.
Results
Microglia morphology and inflammatory cytokine expression were analysed in a total of 127 post-mortem brains ranging from foetuses, children, young adults and older adults with Down syndrome and age-matched control subjects. The demographics of the study population are described in Supplementary Tables 1–5. For inflammatory protein expression analyses, no differences were found in post-mortem interval between groups except for the young adult group, in which the post-mortem interval was longer in individuals with Down syndrome (21 ± 5.21 h) compared to controls (14.63 ± 7 h) (Supplementary Tables 1 and 2). For the microglial morphological analyses, children in the Down syndrome group were younger than the control subjects (1 ± 0 versus 4.66 ± 2.06 years old) (Supplementary Table 3). No demographic differences were found between groups when analysing rod microglia (Supplementary Table 4). No significant differences were found in the frequency of females or males between each age group (Supplementary Tables 1–4).
Altered microglial phenotype and increased brain cytokine expression in children with Down syndrome
Little is known about alterations in cerebral inflammatory protein expression and microglia activation in foetuses and children with Down syndrome. To fill this gap, we first analysed the levels of key inflammatory markers in the frontal cortex of foetuses with Down syndrome and euploid controls. Foetal Down syndrome brain homogenates did not display significant differences in the concentration of inflammatory markers when compared to the euploid group. However, a trend towards higher levels of interleukin (IL)-6 and IL-15 was observed (Supplementary Fig. 1).
We expanded the analysis of inflammatory markers to mixed foetal cortical primary cultures. A significant increase in the levels of the interleukins IL-1α, IL-4, IL-6, IL-7, IL-10, IL-12 and in the chemokines IL-8, macrophage-derived chemokine (MDC), macrophage inflammatory protein-beta (MIP-1β), growth-regulated oncogene (GROα) and granulocyte-colony stimulating factor (G-CSF) was observed in the conditioned media from Down syndrome foetal cortical cells (Supplementary Fig. 2A–K), indicating that inflammatory changes are detectable at the cellular level at this early age. No significant differences were detected in other inflammatory mediators in the conditioned media (Supplementary Fig. 2L–JJ).
In agreement with an early inflammatory scenario, we found that, before amyloid-β deposition or tau hyperphosphorylation (Supplementary Table 5), microglial cells from children with Down syndrome (1–10 years) (Fig. 1A–E) displayed an increase in their soma size (3.9-fold) (Fig. 1B). While two of three Down syndrome cases displayed an increase in process length, this difference was not statistically significant (Fig. 1C). However, compared to age-matched controls, children with Down syndrome displayed a higher soma size-to-process length ratio (2.7-fold) (Fig. 1D). At this stage, no changes in microglia cell number were noted (Fig. 1E).
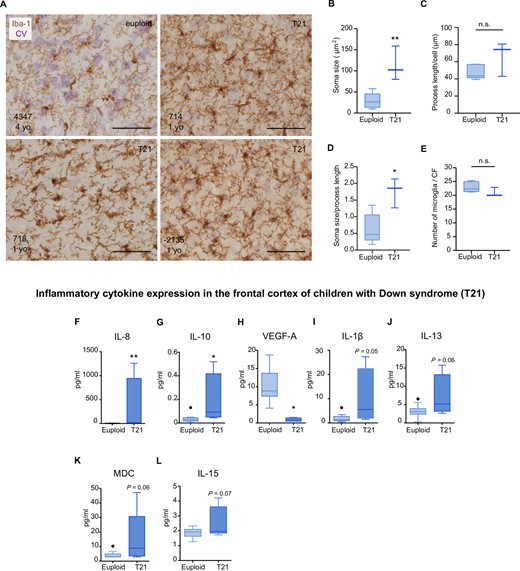
Microglial morphological changes and increased inflammatory cytokine expression in the frontal cortex of children with Down syndrome. Top: (A–E) Microglial cells from children (1–10 years) were detected by immunohistochemistry against the monocytic marker Iba-1 (brown). Cresyl violet (CV) staining was used to identify cortical laminae. (A) Representative micrographs of control (euploid) and Down syndrome (T21) cases (1–10 years old). Control microglia displayed thin and ramified processes which are indicative of a physiological surveying state. Down syndrome microglia displayed a reactive phenotype reflective of intermediate activation. (B) Microglia from children with Down syndrome displayed an increase in soma size, t(6) = 4.15, P = 0.006. (C) Microglial process length did not differ between control and Down syndrome cases, t(6) = 1.82, P = 0.11. (D) An increase in the soma size-to-cell ratio was found in children with Down syndrome compared to controls, t(6) = 3.40, P = 0.01. (E) No significant differences were found in the number of microglia in children with Down syndrome compared to controls, t(6) = 1.50; P = 0.18. Euploid n = 6, T21 n = 3. Bottom: Increased levels (pg/ml) of (F) IL-8 (U = 0, P = 0.002) and (G) IL-10 (U = 4, P = 0.03) and decreased levels of (H) VEGF-A, t(12) = 3.764, P = 0.002, were observed in the frontal cortex of children with Down syndrome (1–13 years old), as examined by a multiplex protein electrochemiluminescent assay. A trend towards an increase of (I) IL-1β; U = 6; P = 0.05 (J) IL-13; t(12) = 2.02, P = 0.06; (K) MDC; U = 9, P = 0.06 and (L) IL-15; t(13) = 1.97, P = 0.07, was also noted in the Down syndrome group. Euploid n = 10, T21 n = 5. (B–G, I and K) Two-tailed Mann-Whitney test and (H, J and L), two-tailed unpaired Student's t-test. Data are displayed in box plots where the box represents the interquartile interval in which the upper and bottom ends of the box represent the third and the first quartile, respectively. The horizontal line in the box represents the median. The vertical lines or whiskers extending from the box represent the minimum and maximum values in the dataset. Full circles represent outliers according to Tukey’s rule. Scale bar = 50 μm. *P < 0.05, **P < 0.01. n.s. = not significant.
Inflammatory protein analyses further revealed that IL-8 and IL-10 levels were significantly higher, while vascular endothelial growth factor-A (VEGF-A) was lower in the frontal cortex of children with Down syndrome (Fig. 1F–H). IL-1β, IL-13, MDC and IL-15 showed a trend towards higher expression in this group (Fig. 1I–L). No significant differences were detected in other inflammatory mediators (Supplementary Fig. 3).
Enhanced neuroinflammation in young adults with Down syndrome
To elucidate the evolution of neuroinflammation in Down syndrome as Alzheimer’s disease neuropathology progresses, we next examined the frontal cortex of individuals with Down syndrome aged 13 to 25 years who displayed sparse amyloid plaques and phosphorylated tau (Supplementary Fig. 4 and Supplementary Table 5). Half of Down syndrome cases in this age bracket displayed an increase in soma size compared to age-matched controls, although no overall differences were found at a group level (Fig. 2A and B). Likewise, a trend towards a decrease (1.5-fold) in process length was observed in the Down syndrome group at this time point (Fig. 2C). The soma size-to-process length ratio was higher (3.8-fold) in individuals with Down syndrome than controls (Fig. 2D). No differences in microglia cell number were observed at this stage (Fig. 2E).
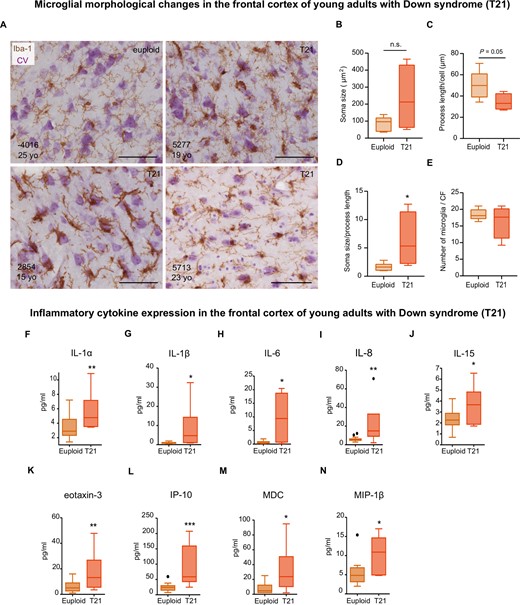
The frontal cortex of young adults with Down syndrome displays an exacerbated inflammatory profile. Top: (A) Microglial cells from young individuals (15–25 years old) as revealed by immunohistochemistry against Iba-1 and cresyl violet (CV) counterstain. (B) Microglial soma size did not differ between Down syndrome and control groups, t(8) = 1.843, P = 0.10; however, half of Down syndrome cases displayed an increase in soma size. (C) A trend towards a smaller process length was observed in young individuals with Down syndrome compared to controls, t(8) = 2.23, P = 0.05. (D) Young adults with Down syndrome display an increase in their soma size-to-process length ratio, t(8) = 2.373, P = 0.04. (E) The number of microglial cells remained unchanged at this age, t(8) = 0.94, P = 0.37). CF = counting frame. Euploid n = 7, T21 n = 4. Bottom: Multiplex protein electrochemiluminescent assays revealed that young adults with Down syndrome (13–27 years old) display an upregulation of inflammatory markers (pg/ml) before the development of a full-blown Alzheimer’s disease pathology (F–N). (F) U = 29, P = 0.03; (G) U = 24, P = 0.01; (H) U = 25, P = 0.02; (I) t(24) = 3.13, P = 0.004; (J) t(27) = 2.49, P = 0.01; (K) t(28) = 3.22, P = 0.003; (L) t(27) = 4.51, P = 0.0001, (M) U = 25, P = 0.01; (N) U = 25, P = 0.02. Euploid n = 24, T21 n = 6. (B–E and I–L) Two-tailed unpaired Student's t-test; (F–H, M and N) two-tailed Mann-Whitney test. Data are displayed in box plots where the box represents the interquartile interval in which the upper and bottom ends of the box represent the third and the first quartile, respectively. The horizontal line in the box represents the median. The vertical lines or whiskers extending from the box represent the minimum and maximum values in the dataset. Full circles represent outliers according to Tukey’s rule. Scale bar = 50 μm. *P < 0.05, **P < 0.01, ***P < 0.001. n.s. = not significant.
Moreover, similar to children with Down syndrome, cortical IL-8 levels were increased in young adults with Down syndrome. Furthermore, an upregulation of cytokines involved in the acute immune response such as IL-1α, IL-1β, IL-6 and IL-15 (Fig. 2F–J) and the leucocyte chemoattractants eotaxin-3, interferon gamma-induced protein 10 (IP-10), MDC, and MIP-1β (Fig. 2K–N) was observed. In this age bracket, no other significant differences in cytokine expression were noted (Supplementary Fig. 5).
Neuroinflammation wanes with age in Down syndrome
As reference of advanced stages of Alzheimer’s disease pathology (Supplementary Fig. 4 and Supplementary Table 5), we then investigated the inflammatory status in the frontal cortex of older adults with Down syndrome (39–64 years old). We observed that microglia from adults with Down syndrome were more morphologically heterogenous than those found in the younger Down syndrome groups.
Microglial cells displayed spheroidal swellings, process beading, fragmentation as well as hypertrophic and amoeboid morphologies as illustrated in Fig. 3A and Supplementary Fig. 6. A significant increase (1.6-fold) in microglial soma size (Fig. 3B), along with a decrease (1.5-fold) in microglial process length (Fig. 3C) and an increase (2.8-fold) in the microglia soma size-to-process length ratio (Fig. 3D) were also observed. Although the total microglial cell number did not differ between groups (Fig. 3E), an analysis of microglia subpopulations revealed a significant decrease in non-dystrophic microglia together with an increase of dystrophic microglia in the Down syndrome group (Fig. 3F).
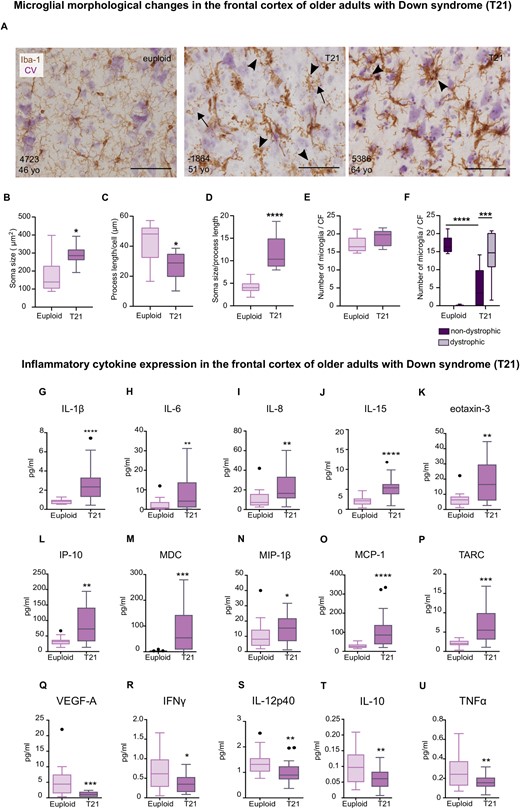
Dystrophic microglia and waning of neuroinflammation in older adults with Down syndrome. Top: (A) Representative photomicrographs of euploid and Down syndrome microglia (30–64 years old) as revealed by immunohistochemical assessment of Iba-1, cresyl violet (CV) was used as counterstain. (A) Dystrophic microglia from Down syndrome cases (middle and right micrographs) display spheroidal swellings and process beading (arrowheads), and fragmentation (arrows). (B) An increase in microglial soma size was noted in the Down syndrome cases, t(15) = 2.83, P = 0.01. (C) Down syndrome microglia displayed a decreased process length, t(15) = 2.60, P = 0.01. (D) The soma size-to-process length ratio was increased in microglia from adults with Down syndrome, t(15) = 5.40, P < 0.0001. (E) Total microglial cell number did not differ between Down syndrome and control groups, t(15) = 1.79, P = 0.09. (F) An increase of dystrophic microglia compared to non-dystrophic cells was observed in the Down syndrome group Accompanied by a decrease in non-dystrophic microglia compared to controls. Two-way ANOVA, effect of karyotype, F(1,30) = 0.42, P = 0.51, effect of morphology, F(1,30) = 6.22, P = 0.01, karyotype × morphology interaction, F (1,30) = 79.33 P < 0.0001 followed by Tukey’s post hoc test (T21 non-dystrophic versus T21 dystrophic, P = 0.0007; Euploid non-dystrophic versus T21 non-dystrophic, P < 0.0001). Euploid n = 10, T21 n = 8. Bottom: (G–U) Analysis of frontal cortex homogenates by multiplex protein electrochemiluminescent assays revealed an increase in inflammatory expression (pg/ml) in (G–P), along with a decrease of inflammatory mediators in adults with Down syndrome (39–68 years old) (Q–U). (G) U = 35, P < 0.0001; (H) U = 82, P = 0.01; (I) U = 72, P = 0.005; (J) t(37) = 4.73, P < 0.0001; (K) U = 70, P = 0.008; (L) t(34) = 3.48, P = 0.001; (M) U = 51.5, P = 0.0004; (N) U = 117, P = 0.04; (O) U = 34, P < 0.0001; (P) U = 57, P = 0.0005; (Q) U = 63.5, P = 0.0004; (R) t(36) = 2.59, P = 0.01; (S) U = 74, P = 0.001; (T) t(36) = 2.87, P < 0.006; (U) t(35) = 2.72, P = 0.009. (A–E, J, L, R, T and U) Two-tailed unpaired Student's t-test; (G–I, K, M–P and R) two-tailed Mann Whitney tests. Euploid n = 16, T21 n = 22. Data are displayed in box plots where the box represents the interquartile interval in which the upper and bottom ends of the box represent the third and the first quartile, respectively. The horizontal line in the box represents the median. The vertical lines or whiskers extending from the box represent the minimum and maximum values in the dataset. Full circles represent outliers according to Tukey’s rule. Scale bar = 50 μm. *P < 0.05, **P < 0.01, ***P < 0.001, ****P < 0.0001. CF = counting frame.
Most inflammatory markers that were upregulated in the young adult Down syndrome group were also upregulated in the frontal cortex of older adults with Down syndrome as revealed by increases in IL-1β, IL-6, IL-8, IL-15, eotaxin-3, IP-10, MDC, and MIP-1β (Fig. 3G–N). Moreover, chemoattractant molecules, such as monocyte chemoattractant protein-1 (MCP-1) and thymus-and activation-regulated chemokine (TARC), were also upregulated and VEGF-A levels were decreased in the frontal cortex of older adults with Down syndrome (Fig. 3O–Q). Surprisingly, our analyses also revealed a downregulation of IFNγ, IL-12p40, IL-10 and TNFα (Fig. 3R–U). Cytokine expression that did not differ between groups is illustrated in Supplementary Fig. 7.
Given the sufficient number of cases to perform a secondary analysis to assess sex differences, we next investigated whether inflammatory expression differed between males and females in the adult population. We found that IL-6 expression levels were dependent on sex and karyotype. Post hoc analyses revealed that females with Down syndrome had higher brain levels of IL-6 than males with Down syndrome (Fig. 4A). Furthermore, females in general (T21 and euploid) had higher levels of brain IL-8 and eotaxin-3 than males (Fig. 4B and C); but females with Down syndrome had higher levels of IL-8 than males with Down syndrome (Fig. 4B). No sex differences were observed in the rest of the analysed molecules (Supplementary Fig. 8).
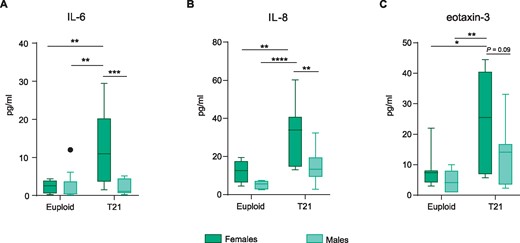
Adult females with Down syndrome display a more pronounced cortical inflammatory profile than males with Down syndrome. (A) T21 females have higher IL-6 levels when compared to T21 males (39–68 years old). Two-way ANOVA, effect of karyotype, F(1,30) = 7.03, P = 0.01, effect of sex, F(1,30) = 7.79, P = 0.009, sex × karyotype interaction, F(1,30) = 8.13 P = 0.007 followed by Tukey’s post hoc test (T21 females versus T21 males, P = 0.0009; T21 females versus euploid males, P = 0.001; and T21 females versus euploid females, P = 0.005; euploid females versus euploid males, P > 0.9999). (B) A significant increase in IL-8 levels was found in T21 females when compared to T21 males. Two-way ANOVA, effect of karyotype, F(1,29) = 15, P = 0.0005, effect of sex, F(1,29) = 10, P = 0.003, sex × karyotype interaction, F(1,29) = 1.7, P = 0.20 followed by Tukey’s post hoc test (T21 females versus T21 males, P = 0.004; T21 females versus euploid males, P < 0.0001; and T21 females versus euploid females; P = 0.009). (C) T21 females had higher levels of eotaxin-3 when compared to female and male euploids. Two-way ANOVA, effect of karyotype, F(1,31) = 10.85, P = 0.002, effect of sex, F(1,31) = 4.34, P = 0.04, sex × karyotype interaction, F(1,31) = 0.99, P = 0.32 followed by Tukey’s post hoc test (T21 females versus euploid females, P = 0.02; T21 females versus euploid males, P = 0.003). Data are displayed in box plots where the box represents the interquartile interval in which the upper and bottom ends of the box represent the third and the first quartile, respectively. The horizontal line in the box represents the median. The vertical lines or whiskers extending from the box represent the minimum and maximum values in the dataset. Full circles represent outliers according to Tukey’s rule. Euploid males n = 9, euploid females n = 7, T21 males n = 12, T21 females n = 10. *P < 0.05, **P < 0.01, ***P < 0.001, ****P < 0.0001.
Given that the hippocampus is highly vulnerable to Alzheimer’s disease neuropathology we further analysed inflammatory protein expression in hippocampal samples available to us for this age group (Supplementary Table 2). Although the frontal cortex and hippocampus shared common elevations in IL-1β, IL-6, IL-15, eotaxin-3, MCP-1, MIP-1β, and TARC accompanied by lower levels of VEGF-A in adult Down syndrome brains (Supplementary Fig. 9A–K), a differential expression of certain inflammatory markers was observed between these regions. While an upregulation of the chemoattractants IP-10 and MDC was solely observed in the Down syndrome frontal cortex (Fig. 3L and M), IL-1α and IL-4 were exclusively upregulated in the Down syndrome hippocampus (Supplementary Fig. 9A and C). No significant changes were observed in other cytokines (Supplementary Fig. 9L–T).
Occurrence of rod-like microglia in Down syndrome brains
While analysing microglia morphology we noticed the occurrence of a distinct, rod-shaped phenotype of microglia in the brains of young adults and adults with Down syndrome (Fig. 5). As previously reported in other neuropathologies, including Alzheimer’s disease (Bachstetter et al., 2015), rod microglia were also found forming trains along cortical layers (Fig. 5A). We furthered quantified the number of rod microglia in the brains of young adults and adults with Down syndrome and compared it to age-matched controls. As illustrated in Fig. 5B, the brains of young adults and older adults with Down syndrome displayed a remarkable increase in rod-microglia compared to age-matched controls. Interestingly, double staining of microglia and pathological tau revealed that some rod microglial cells were near and aligned to neurons bearing tau neurofibrillary tangles in the older Down syndrome population (Fig. 5C).
![Rod shaped microglia in young and adult Down syndrome brains. (A) Micrographs depicting rod microglia (arrows) in the frontal cortex of a 19-year-old individual with Down syndrome (left) and a train of rod microglial cells (right) as revealed by immunohistochemistry (IHC) against the monocytic marker Iba-1 (brown). Cresyl violet (CV) was used as a counterstain. (B) Increased number of rod microglial cells in the brains of young adults [t(14) = 4.57; P = 0.0004, two-tailed unpaired Student's t-test] and older adults with Down syndrome (U = 36.50; P = 0.0002, two-tailed Mann Whitney t-test) as compared to euploid controls. Euploid young adults n = 12; T21 young adults n = 4; euploid adults n = 17; T21 adults n = 16. (C) IHC against Iba-1 (blue) and pathological tau as revealed by PHF-1 (brown) in the frontal cortex of a 53-year-old (top) and a 57-year-old (bottom) individual with Down syndrome. Note the close alignment of rod microglia to PHF+ neurons. Data are displayed in box plots where the box represents the interquartile interval in which the upper and bottom ends of the box represent the third and the first quartile, respectively. The horizontal line in the box represents the median. The vertical lines or whiskers extending from the box represent the minimum and maximum values in the dataset. PHF = paired helical filament. Scale bar = 50 μm. ***P < 0.001.](https://oup.silverchair-cdn.com/oup/backfile/Content_public/Journal/brain/143/12/10.1093_brain_awaa326/5/m_awaa326f5.jpeg?Expires=1749968759&Signature=IarOw6BefMDooiNmWaef0pRB5Xdph-xa0nt3IpPftiCRBR01FfxHjOCgomOAfvivZsbzl6vaykjYFI4OP6ZzqctUcnrmENdWzEnTrCK5mGF34aZH6eJJj0Ka4qSiDE0HublxFNiWPqtpLm9j3P58EMf7p~0H~Yla2cWhzAeKHVQNMPpjkCSYBkjR0AY5ETG1OrOwl4vqM4plVgdKNmaBJFtFyGicXAISh4VMHMUBghx9mpQqhS7M8InP90LLDLYQ~pSNfwdL84ZDs2ShOYaOKGvIiEAh1iU8XWgmt8icQF2E1OiDqv7zGSXdywQ8ZVeCLsmbjMAFU-NwkgfO5ZeMQA__&Key-Pair-Id=APKAIE5G5CRDK6RD3PGA)
Rod shaped microglia in young and adult Down syndrome brains. (A) Micrographs depicting rod microglia (arrows) in the frontal cortex of a 19-year-old individual with Down syndrome (left) and a train of rod microglial cells (right) as revealed by immunohistochemistry (IHC) against the monocytic marker Iba-1 (brown). Cresyl violet (CV) was used as a counterstain. (B) Increased number of rod microglial cells in the brains of young adults [t(14) = 4.57; P = 0.0004, two-tailed unpaired Student's t-test] and older adults with Down syndrome (U = 36.50; P = 0.0002, two-tailed Mann Whitney t-test) as compared to euploid controls. Euploid young adults n = 12; T21 young adults n = 4; euploid adults n = 17; T21 adults n = 16. (C) IHC against Iba-1 (blue) and pathological tau as revealed by PHF-1 (brown) in the frontal cortex of a 53-year-old (top) and a 57-year-old (bottom) individual with Down syndrome. Note the close alignment of rod microglia to PHF+ neurons. Data are displayed in box plots where the box represents the interquartile interval in which the upper and bottom ends of the box represent the third and the first quartile, respectively. The horizontal line in the box represents the median. The vertical lines or whiskers extending from the box represent the minimum and maximum values in the dataset. PHF = paired helical filament. Scale bar = 50 μm. ***P < 0.001.
Previous findings in a group of individuals with and without Alzheimer’s disease pathology indicate that males are less likely to have rod microglia in the parietal cortex than females (Bachstetter et al., 2017). Therefore, we assessed whether sex had an influence on rod microglia number in Down syndrome and age-matched control brains. Given the limited sample size in the young adult group, sex differences were only assessed in the adult group. As illustrated in Supplementary Fig. 10, the number of rod microglia in the frontal cortex was not influenced by sex, neither in the euploid nor in Down syndrome group.
Neuroinflammation peaks before the development of an overt Alzheimer’s pathology in Down syndrome
Given the differential expression of inflammatory markers across age intervals we were interested to elucidate whether the neuroinflammatory process peaked at a certain age in Down syndrome. To account for ageing effects on inflammatory protein expression, each Down syndrome group was normalized against its own age-matched control group. Our results indicate that IL-6 is significantly more upregulated in young adults with Down syndrome (14.7-fold with respect to controls) compared to older adults with Down syndrome (1.9-fold relative to controls) (Fig. 6A). Instead, the monocytic chemoattractant MCP-1 (CCL2) was found significantly more upregulated in the older adult Down syndrome group (2.9-fold compared to controls) in relation to children with Down syndrome (2-fold decrease compared to controls) (Fig. 6B). Moreover, a drop in the expression levels of IL-10, TNFα, and IFNγ (1.6-fold, 1.8-fold, and 1.9-fold decrease, respectively, compared to controls) was observed in the frontal cortex of older adults with Down syndrome when compared to children with Down syndrome (2.4-fold, 1.3-fold, and 1.8-fold, respectively, compared to controls) (Fig. 6C–E). No significant changes were found for other cytokines (Supplementary Fig. 11).
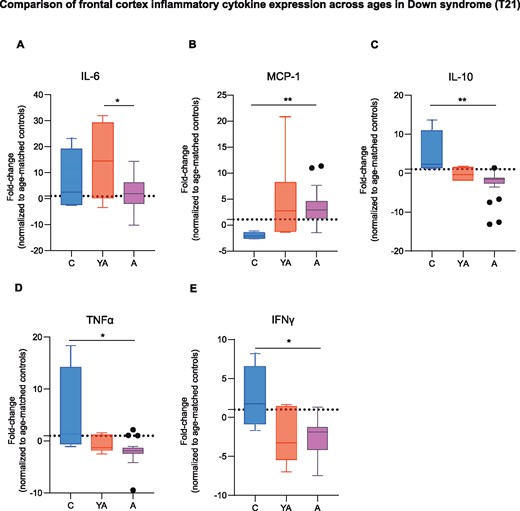
Neuroinflammation is exacerbated before the development of overt Alzheimer’s disease pathology in Down syndrome. (A) IL-6 levels where significantly higher in young adults (13–27 years old) with Down syndrome than in older adults with Down syndrome (39–68 years old). One-way ANOVA, F(2,27) = 4.34, P = 0.02, followed by Tukey’s post hoc test (young Down syndrome adults versus Down syndrome adults, P = 0.01). (B) The Down syndrome adult group showed higher levels of MCP-1 when compared to children with Down syndrome (1–10 years old). Kruskal-Wallis test, MCP-1 H = 8.74, P = 0.01 followed by Dunn’s post hoc test (T21 children versus T21 adults, P = 0.009). (C–E) IL-10, TNFα and IFNγ expression levels were higher in children with Down syndrome than in the Down syndrome adult group. Kruskal-Wallis test followed by Dunn’s post hoc test, IL-10 H = 10.64, P = 0.004; T21 children versus T21 adults, P = 0.004; TNFα H = 9.01, P = 0.01; T21 children versus T21 adults, P = 0.01; IFNγ H = 6.84, P = 0.03; T21 children versus T21 adults, P = 0.02. Data are displayed in box plots where the box represents the interquartile interval in which the upper and bottom ends of the box represent the third and the first quartile, respectively. The horizontal line in the box represents the median. The vertical lines or whiskers extending from the box represent the minimum and maximum values in the data. Full circles represent outliers according to Tukey’s rule. The fold change was calculated by normalizing each age group to its own age-matched control. Dotted line represents age-matched control levels. A = adults; C = children; YA = young adults. T21 children, n = 4; T21 young adults, n = 6; T21 adults, n = 20. *P < 0.05, **P < 0.01.
Distinct brain cytokine profiles across the lifespan of individuals with Down syndrome
To assess covarying patterns among cytokines and detect specific cytokine profiles, we conducted PCA and PLS-DA in the cytokine data derived from the frontal cortex of individuals with Down syndrome and their respective age-matched controls (see Supplementary material for further information). Supplementary Table 12 displays the number of principal components (PCs) derived, and percentage of variation explained by the models. The corresponding figures display scores and loading plots (Fig. 7 and Supplementary Figs 12 and 13). The scores plots depict the scores for each observation on principal component 1 (PC1) and PC2 and illustrate possible clusters of observations. The contributions of each observation are displayed on the loading plots. In general, we found that the top two PCs, using both PCA and PLS-DA, were instrumental in discriminating individuals with Down syndrome from their age-matched controls. As expected, the supervised PLS-DA yielded generally better discrimination of Down syndrome from controls than the unsupervised PCA (Fig. 7 and Supplementary Fig. 12).
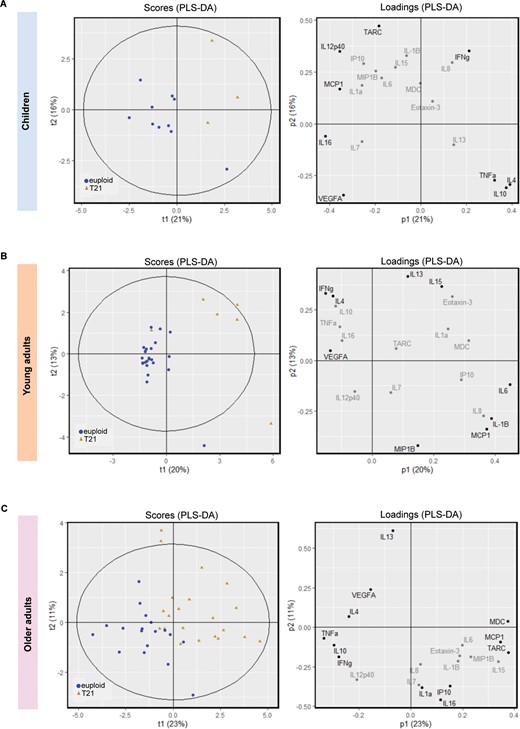
PLS-DA for cytokine expression in individuals with Down syndrome and age-matched controls. The plots display cytokine data after PLS-DA in (A) children, (B) young adults, and (C) older adults with Down syndrome and their age-matched controls. Left: Scores plots representing the scores for each observation on principal component (PC)1 and PC2 (t1 and t2). Scores plots are useful to determine whether there is clustering of observations. The Hotelling ellipse represents the 95% confidence interval for the model. Right: The loadings for each cytokine representing the contribution of each cytokine to PC1 and PC2 (p1 and p2). The cytokines contributing most to the model (three extreme values) are displayed in black while those with a minimal contribution are highlighted in grey. Blue circles: euploids or controls; brown triangles: T21 or Down syndrome.
PCA on the cytokine data from children revealed different clusters of observations for children with Down syndrome and their controls (Supplementary Fig. 12A). This separation was evident after performing PLS-DA using karyotype as the supervising variable. IL-10, IL-4, IFNγ, and TNFα loading values (three extreme values) separated children with Down syndrome from age-matched controls (Fig. 7A). Young adults with Down syndrome separated well from controls after PCA (Supplementary Fig. 12B) and a clearer separation was observed after PLS-DA (Fig. 7B). Young adults with Down syndrome displayed higher IL-6, IL-1β, IL-15, IL-13 and MCP-1 loading values than age-matched controls (Fig. 7B). Lastly, older adults with Down syndrome were well separated from their age-matched controls by the unsupervised model (Supplementary Fig. 12C); however, PLS-DA yielded a better separation in which MCP-1, TARC, and MDC display higher loading values in the Down syndrome group (Fig. 7C).
Finally, we assessed whether individuals with Down syndrome displayed specific cytokine patterns when analysed together (Supplementary Fig. 13A and B). The supervised model revealed that children, young adults, and adults with Down syndrome separate well from each other along the top PC (Supplementary Fig. 13B). Moreover, young adults are also separated along the second PC (Supplementary Fig. 13B). From the corresponding loading plot, children with Down syndrome are mainly associated with IFNγ and eotaxin-3, young adults with IL-1β, IL-10, TNFα, VEGF-A and IL-1β, and older adults with Down syndrome correlate with MDC, TARC, MIP-1β, IL-15, and IL-16 (Supplementary Fig. 13B).
Discussion
In this comprehensive study we report a differential neuroinflammatory process across the lifespan of individuals with Down syndrome, in which key inflammatory mediators are exacerbated before the occurrence of overt Alzheimer’s disease pathology and wane at advanced stages (Fig. 8). Although the origin of early neuroinflammation in Down syndrome brains has not been fully elucidated, intraneuronal amyloid-β accumulation might promote a disease-aggravating neuroinflammatory response, as previously reported in animal models. Such response is primarily characterized by neuronal upregulation of inflammatory markers and intermediate activation of microglia (Janelsins et al., 2005; Ferretti et al., 2012; Hanzel et al., 2014; Hong et al., 2016; Welikovitch et al., 2020). Moreover, increased systemic inflammation, which is present in individuals with Down syndrome, may aggravate the neuroinflammatory response (Licastro et al., 2005; Holmes, 2013; Sullivan et al., 2017; Iulita et al., 2019; Waugh et al., 2019; Huggard et al., 2020; Weber et al., 2020).
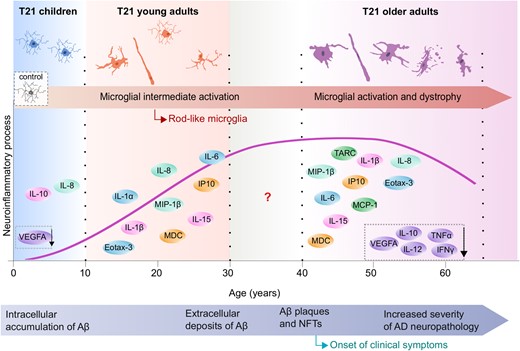
Schematic representation of the evolution of brain inflammation across the lifespan in Down syndrome. Early microglial morphological changes such as increased soma size as well as increases in rod microglia, accompanied by a heightened neuroinflammatory profile, were observed in children and young individuals with Down syndrome (as represented by the schematic illustrations), at stages when limited or no Alzheimer’s disease pathology is present. The late inflammatory process in Down syndrome is characterized by microglial activation (increased soma size, shortened processes) and an increase in dystrophic microglia and chronic neuroinflammation along with a decrease in inflammatory marker expression possibly reflecting cell exhaustion and degeneration. Aβ = amyloid-β; AD = Alzheimer’s disease; NFT = neurofibrillary tangle. Modified image from Lott and Head (2019), with permission from SpringerNature.
Although foetal brain homogenates did not display changes in inflammatory markers, the upregulation of inflammatory mediators in the conditioned media of foetal cortical cell cultures highlights that important early inflammatory alterations may be occurring at the cellular level. Indeed, IL-1 positive microglia, reactive astrocytes and astrogliosis, and upregulation of neuronal reactive oxygen species have been reported in foetal and neonatal Down syndrome brains (Griffin et al., 1989; Zdaniuk et al., 2011); suggesting that different CNS cells contribute to the early neuroinflammatory response.
The brains of young adults with Down syndrome displayed increased levels of MIP-1β, IL-15 and IP-10, cytokines found in astrocytes and body fluids in Alzheimer’s disease and inflammatory conditions (Xia et al., 2000; Gomez-Nicola et al., 2008; Saikali et al., 2010; Krauthausen et al., 2015; Li et al., 2017). Dysregulation of some of these cytokines may be associated to early vascular dysfunction and astroglia activation, events previously reported in foetuses and neonates with Down syndrome and early Alzheimer’s disease (Griffin et al., 1989; Rodriguez-Vieitez et al., 2016). Moreover, the immune cell recruiters, eotaxin-3 and MDC, were upregulated in young Down syndrome brains, similar to other neurological conditions with an inflammatory component (Columba-Cabezas et al., 2002; Ogilvie et al., 2003; Galimberti et al., 2008; Craig-Schapiro et al., 2011; Niven et al., 2015; Huber et al., 2018).
Our analyses revealed that IL-1 and IL-6 were upregulated in young Down syndrome brains, cytokines that have been postulated to potentiate neuroinflammation and Alzheimer’s neuropathology (Sheng et al., 1996; Akiyama et al., 2000). Importantly, IL-6 levels were higher in young Down syndrome brains compared to older adults with Down syndrome; suggesting that younger individuals with Down syndrome have a heightened neuroinflammatory response, as previously suggested by gene expression analyses (Wilcock et al., 2015). Notably, IL-8, a potent chemoattractant of neutrophils (Hammond et al., 1995), was the only cytokine elevated across all age brackets and was highly expressed in older females with Down syndrome compared to males. Given that higher IL-8 plasma levels have been associated with cognitive decline in Down syndrome (Iulita et al., 2016), increased IL-8 in females with Down syndrome may have an added negative impact on cognition. Moreover, given that menopause is an early event in Down syndrome (Schupf et al., 1997) and that IL-6 and IL-8 translation is disrupted by oestrogen signalling (Roebuck, 1999; Liu et al., 2005; Luo and Zheng, 2016), oestrogen deficiency could further accentuate neuroinflammation in females with Down syndrome.
Strikingly, although the brains of older adults with Down syndrome displayed a similar cytokine signature as young Down syndrome brains, certain cytokines were decreased, particularly VEGF-A, IFNγ, TNFα, and IL-12p40. Low VEGF-A levels in older adults and children with Down syndrome might be attributed to overexpression of VEGF-negative regulators encoded on chromosome 21 (Kim et al., 2002; Arron et al., 2006); whilst, a decrease in IFNγ, TNFα, and IL-12p40 would suggest that some immunological mechanisms might become less responsive at late stages of Alzheimer’s disease in Down syndrome. Such processes might be analogous to the age-related waning of neuroinflammation reported in Alzheimer’s disease (Richartz et al., 2005; Hoozemans et al., 2011). In line with the above, it has been reported that IFNγ or TNFα overexpression in Alzheimer’s-like models attenuate the amyloid pathology presumably by promoting microglial phagocytosis (Chakrabarty et al., 2010, 2011). Moreover, TARC and MCP-1 were exclusively upregulated in adults with Down syndrome. TARC has been implicated in maintaining the surveying state of microglia (Fulle et al., 2018) and therefore its upregulation could reflect a compensatory mechanism to restore chronic microglia activation in Down syndrome brains. MCP-1 is known to facilitate monocytic infiltration into the CNS in Alzheimer’s disease-like models, which results in increased amyloid-β clearance (Simard et al., 2006; El Khoury et al., 2007; Theriault et al., 2015). It is therefore likely that a similar process occurs in Down syndrome brains; however, it may be ineffectual at advanced pathology stages.
Interestingly, IL-10 also displayed decreased levels in older adults with Down syndrome while it was upregulated in children. Studies in Alzheimer’s disease-like models indicated that high levels of IL-10 promote cognitive deficits and impair microglial amyloid-β phagocytosis (Chakrabarty et al., 2015; Guillot-Sestier et al., 2015); this suggesting that increased IL-10 brain levels in children with Down syndrome might worsen the amyloid pathology. Although IL-10 downregulation in adult Down syndrome brains may represent a compensatory attempt to promote amyloid-β clearance, this might be an unlikely scenario given that defective microglial phagocytosis has been reported at late stages of Alzheimer’s disease (Hickman et al., 2008; Mawuenyega et al., 2010). The concurrent highly dystrophic microglia with overt Alzheimer’s pathology makes unlikely the occurrence of an adequate phagocytic response in adult Down syndrome brains. Similar to IL-10, the triggering receptor expressed on myeloid cells 2 (TREM2), implicated in microglial phagocytosis, also displays a biphasic expression in Down syndrome (Raha-Chowdhury et al., 2018; Weber et al., 2020) and in Alzheimer’s disease (Kleinberger et al., 2014; Suarez-Calvet et al., 2016). Increased serum and plasma TREM2 levels have been reported in young adults with Down syndrome (Raha-Chowdhury et al., 2018; Weber et al., 2020) while a downregulation in serum and frontal cortex has been reported in older adults (Raha-Chowdhury et al., 2018). Such an expression pattern might exert divergent effects on microglial activity along the Alzheimer’s-like continuum in Down syndrome, as previously illustrated in an Alzheimer’s-like model (Jay et al., 2017).
Our studies indicate that microglia from children and young adults with Down syndrome display an increase in the soma size-to-process length ratio; without uniform changes in process length. Likely, microglial cells in young Down syndrome brains go through different intermediate activation phenotypes before reaching a full activated state. Instead, microglia from older adults with Down syndrome displayed an activated phenotype characterized by larger somas, shorter processes, higher soma size-to-process length ratio, accompanied by an increase in dystrophic microglia. In some cases, cellular fragments from dystrophic microglia could not be attributed to a specific cell body, what might have led to an underestimation of the total number of dystrophic microglia. The presence of dystrophic microglia likely reflects a decades-long chronic inflammation, possibly leading to cell exhaustion and degeneration. Moreover, the overt tau pathology present in Down syndrome adult brains might spark microglial dystrophy, as previously proposed for Down syndrome and Alzheimer’s disease (Xue and Streit, 2011; Sanchez-Mejias et al., 2016). In addition, for the first time we have identified an increased number of rod microglia in the young and adult Down syndrome frontal cortex, which occasionally aligned to neurons bearing pathological tau, as previously reported in Alzheimer’s brains (Bachstetter et al., 2015). It is worth noting that rod microglia are present in transgenic models displaying tau pathology (Adaikkan et al., 2019; Malcolm et al., 2019) but not in transgenic amyloid models; further supporting an association between tau pathology and development of the rod microglia phenotype. Furthermore, the alignment of rod microglia to injured axons (Ziebell et al., 2012; Rojas et al., 2014; Tam and Ma, 2014; Taylor et al., 2014; Au and Ma, 2017) has prompted the hypothesis that rod microglia could contribute to synaptic stripping (Au and Ma, 2017). Finally, in contrast to previous observations in the parietal cortex of individuals with and without Alzheimer’s pathology (Bachstetter et al., 2017), we did not observe sex differences in the number of rod microglia in the frontal cortex.
Multivariate projection methods further supported that brain inflammation varies considerably across the lifespan of individuals with Down syndrome. Interestingly, the cytokine pattern that distinguished children with Down syndrome from age-matched controls was composed of anti- and proinflammatory mediators, while young adults with Down syndrome displayed mostly an inflammatory signature, including high loading values of IL-6. The inflammatory profile of the older adults with Down syndrome group was mainly composed of increased levels of chemotactic molecules such as MCP-1, likely reflecting an increase in immune cell recruitment. In agreement with our univariate analyses, low loading values of the cytokine profile composed by IL-10, TNFα, and IFNγ were observed in older adults with Down syndrome, further supporting a downregulation of these cytokines in this group. Importantly, PLS-DA among the Down syndrome groups revealed that each age group could be differentiated according to their cytokine profile, suggesting the existence of a temporal variation of cytokine patterns in Down syndrome.
The findings of this study must be considered within its limitations. This report represents the most comprehensive cross-sectional analysis of inflammatory protein expression and microglia morphology carried out so far in the largest cohort of Down syndrome post-mortem brain samples. However, the inherent difficulties in obtaining well-preserved post-mortem brain tissue samples led to a limited sample size for some age brackets. Another limitation was the lack of relevant neuropsychological data indicating the presence or absence of cognitive deficits or early clinical signs of Alzheimer’s disease. Given the paucity of the available information, we cannot ascertain if comorbidities or medications affected the ongoing neuroinflammatory process in each case. Importantly, besides Alzheimer’s pathology, some genes encoded on chromosome 21 could also have a significant impact on the development of brain and peripheral inflammation (Iulita et al., 2016; Sullivan et al., 2017; Waugh et al., 2019). The identification of the CNS cells that contribute to the production of inflammatory mediators at each age bracket, the temporal microglial immunophenotype and whether microglial cells display different morphologies in relation to its location to amyloid plaques remains to be elucidated.
In closing, it is worth noting that the beneficial outcomes of anti-inflammatory treatment in Alzheimer’s disease result from early intervention, most likely at preclinical stages (McGeer and McGeer, 2013; Cuello, 2017; Rogers, 2018). Moreover, such treatments in individuals with underlying systemic inflammation have a sparing effect on Alzheimer’s disease (McGeer and McGeer, 2013). Similar to Alzheimer’s disease mouse models, anti-inflammatory treatments in a Down syndrome mouse model diminished neuroinflammation, neurodegeneration, and rescued cognitive deficits (Hunter et al., 2004; Rueda et al., 2018; Hamlett et al., 2020); suggesting that reducing inflammation may be beneficial in the Down syndrome population. The predictability of Alzheimer’s disease evolution in Down syndrome and their heightened inflammatory systemic profile (Licastro et al., 2005; Iulita et al., 2016; Sullivan et al., 2017; Waugh et al., 2019; Huggard et al., 2020; Weber et al., 2020), makes this an important population to be considered for anti-inflammatory trials at Alzheimer’s disease preclinical stages. The recent characterization of reliable diagnostic biomarkers to detect prodromal and clinical Alzheimer’s disease in Down syndrome (Fortea et al., 2018, 2020) might aid in the recruitment of potential candidates for such trials and in the evaluation of primary outcomes. The inclusion of individuals with Down syndrome in clinical trials would strongly contribute to improve treatment options for Alzheimer’s disease.
Most individuals with Down syndrome develop Alzheimer’s pathology early in life. In a cross-sectional post-mortem study, Flores-Aguilar et al. study neuroinflammation across the lifespan in Down syndrome and reveal profound changes in microglial activation and brain cytokine expression along the Alzheimer’s continuum.
Acknowledgements
The authors would like to acknowledge the donors and their families who donated their brains to science and allowed the completion of this study. We would like to acknowledge the National Institutes of Health-Maryland and Pittsburgh brain banks as well as the University of California, Irvine and New York University brain banks for providing the brain tissue used in this study. The authors would like to thank Dr Yongzhao Shao (Division of Biostatistics, New York University, Grossman School of Medicine, New York, USA) for very helpful discussions and insights regarding the PCA and PLS-DA statistical analysis.
Funding
L.F.A. was the holder of a Doctoral Merit Scholarship Program for Foreign Students from the Fonds de Recherche du Quebec–Nature et technologies (2015-2017) and of a doctoral scholarship granted by the National Council of Science and Technology (CONACyT), Mexico (2012-2017). M.F.I. was the recipient of a Bourse Postdoctorale from the Jérôme Léjeune Foundation (2020-2022) and from the Fonds de Recherche du Quebec-Santé (2015-2019). M.D.T. was partially funded by a T-32 ‘Training in the Neurobiology of Aging’ Grant (AG000096). S.M.L. was the recipient of the Faculty of Science Scholarship from McGill University. A.C.C. is the holder of the McGill University Charles E. Frosst/Merck Chair in Pharmacology and a member of the Canadian Consortium of Neurodegeneration in Aging. A.C.C., T.W. and J.B. would like to acknowledge support from US National Institute on Aging – National Institutes of Health (1R01AG056850-01A1). Part of this work was supported by Alzheimer's Disease Research Center grants, AG16573 and AG08051 granted to J.B. and T.W., respectively. A.C.C. also acknowledges support from Canadian Institutes of Health Research (MOP-97776) and the Alzheimer Society of Canada (241755).
Competing interests
The authors report no competing interests.
Supplementary material
Supplementary material is available at Brain online.
References
- PCA =
principal component analysis
- PLS-DA =
partial least squares discrimination analysis
- T21 =
trisomy 21

