


Abstract
Converging evidence from structural, metabolic and functional connectivity MRI suggests that neurodegenerative diseases, such as Alzheimer’s disease, target specific neural networks. However, age-related network changes commonly co-occur with neuropathological cascades, limiting efforts to disentangle disease-specific alterations in network function from those associated with normal ageing. Here we elucidate the differential effects of ageing and Alzheimer’s disease pathology through simultaneous analyses of two functional connectivity MRI datasets: (i) young participants harbouring highly-penetrant mutations leading to autosomal-dominant Alzheimer’s disease from the Dominantly Inherited Alzheimer’s Network (DIAN), an Alzheimer’s disease cohort in which age-related comorbidities are minimal and likelihood of progression along an Alzheimer’s disease trajectory is extremely high; and (ii) young and elderly participants from the Harvard Aging Brain Study, a cohort in which imaging biomarkers of amyloid burden and neurodegeneration can be used to disambiguate ageing alone from preclinical Alzheimer’s disease. Consonant with prior reports, we observed the preferential degradation of cognitive (especially the default and dorsal attention networks) over motor and sensory networks in early autosomal-dominant Alzheimer’s disease, and found that this distinctive degradation pattern was magnified in more advanced stages of disease. Importantly, a nascent form of the pattern observed across the autosomal-dominant Alzheimer’s disease spectrum was also detectable in clinically normal elderly with clear biomarker evidence of Alzheimer’s disease pathology (preclinical Alzheimer’s disease). At the more granular level of individual connections between node pairs, we observed that connections within cognitive networks were preferentially targeted in Alzheimer’s disease (with between network connections relatively spared), and that connections between positively coupled nodes (correlations) were preferentially degraded as compared to connections between negatively coupled nodes (anti-correlations). In contrast, ageing in the absence of Alzheimer’s disease biomarkers was characterized by a far less network-specific degradation across cognitive and sensory networks, of between- and within-network connections, and of connections between positively and negatively coupled nodes. We go on to demonstrate that formalizing the differential patterns of network degradation in ageing and Alzheimer’s disease may have the practical benefit of yielding connectivity measurements that highlight early Alzheimer’s disease-related connectivity changes over those due to age-related processes. Together, the contrasting patterns of connectivity in Alzheimer’s disease and ageing add to prior work arguing against Alzheimer’s disease as a form of accelerated ageing, and suggest multi-network composite functional connectivity MRI metrics may be useful in the detection of early Alzheimer’s disease-specific alterations co-occurring with age-related connectivity changes. More broadly, our findings are consistent with a specific pattern of network degradation associated with the spreading of Alzheimer’s disease pathology within targeted neural networks.
Introduction
Evidence from electrophysiological, imaging, and genetic studies supports the organization of the brain into large-scale, anatomically distributed neural networks that share a predictable anatomy across individuals (Yeo et al., 2011, 2013). These networks are differentially associated with a variety of complex behaviours, ranging from episodic memory to motor planning, suggesting the specialization of particular networks for motor, social, or cognitive behaviours (Seeley et al., 2007; Sambataro et al., 2010; Lehmann et al., 2013b). Network-sensitive imaging modalities, especially resting state functional connectivity MRI, offer an opportunity to probe the polysynaptic integrity of these networks (Greicius et al., 2009; Lu et al., 2011; Fox et al., 2012), and assess whether variations in coordinated activity within particular networks relate to the performance of particular cognitive and motor tasks (Fox and Greicius, 2010; Sambataro et al., 2010; Shirer et al., 2011; Shaw et al., 2015; Dresler et al., 2017).
Structural and functional imaging evidence strongly suggests that neurodegenerative diseases differentially target subsets of neural networks (Rabinovici et al., 2007; Seeley et al., 2009; Rohrer et al., 2010; Lee et al., 2011; Greicius, 2013). Elegant studies in amnestic, language, and visuospatial presentations of Alzheimer’s disease, frontotemporal dementia, and corticobasal syndrome suggest that disease-characteristic patterns of atrophy (Zhou et al., 2012) and hypometabolism (Lehmann et al., 2013a) mirror intrinsic connectivity network architecture, suggesting that network-specific alterations in functional connectivity MRI reflect this differential targeting of networks across disease states. These observations are particularly intriguing given the potential for trans-synaptic spread of pathological protein species (Harris et al., 2010; Walker et al., 2013; Hyman, 2014; Spires-Jones and Hyman, 2014), a mechanism that may explain the preferential loss of functionally coupled neurons within targeted networks.
Functional connectivity MRI has also become a tool to examine network dysfunction in neurodegenerative and psychiatric disease, as well as a potential biomarker in clinical research settings (Greicius et al., 2004; Fox and Greicius, 2010; Jones et al., 2011, 2016; Zhou et al., 2012). In Alzheimer’s disease, early evidence of degraded default network integrity (Greicius et al., 2004) has been widely replicated across diverse clinical cohorts (including in both early- and late-onset disease) and using several different analytic approaches. There is also substantial evidence to suggest that other cognitive intrinsic connectivity networks are degraded in Alzheimer’s disease. Specifically, dorsal attention and frontoparietal control (Control) network degradation have been observed to varying degrees in both early-onset (Lehmann et al., 2013b; Thomas et al., 2014), and late-onset Alzheimer’s disease (Li et al., 2012; Thomas et al., 2014). Changes in salience network connectivity in late-onset Alzheimer’s disease have been more variable across studies, with some authors reporting increasing connectivity relative to healthy controls (Zhou et al., 2010), and others reporting decreases (Thomas et al., 2014), or no change (Agosta et al., 2012).
However, despite widespread agreement across studies regarding the early degradation of the default network in Alzheimer’s disease, discerning the extent to which the default network is preferentially targeted relative to other cognitive and non-cognitive networks remains difficult given study-specific variations in which networks were examined, the analytic approach used, and the composition of the clinical population comprising the dataset. Additionally, changes in default network connectivity, though consistently observed in Alzheimer’s disease, have also been seen in many other disease states (ranging from headache to chronic pain), including some common confounders of early Alzheimer’s disease such as ageing (Andrews-Hanna et al., 2007; Jones et al., 2011; Wu et al., 2011), sleep disruption (Sämann et al., 2010, 2011; De Havas et al., 2012), and depression (Sheline et al., 2009). These observations suggest that single network measures may not optimally describe disease-specific changes, and that single network connectivity measurements may be confounded in the presence of co-morbid disease states. The potential for common confounding conditions to obscure (or exaggerate) early disease-related changes is particularly relevant in late-onset Alzheimer’s disease clinical research, as elderly individuals are more likely to have multiple co-morbid conditions and ageing itself is thought to exert a considerable effect on network connectivity measurements.
In the present report, we examine the hypothesis that selective vulnerability of particular networks to Alzheimer’s disease-related degradation should generate a distinctive multi-network pattern of connectivity change that will be observable across a wide spectrum of impairment, and that a nascent form of this Alzheimer’s disease degradation pattern may be recognized in asymptomatic individuals with clear signs of Alzheimer’s disease pathology (i.e. preclinical Alzheimer’s disease). Further, we examine whether this Alzheimer’s disease pattern of connectivity change is distinct from the degradation pattern seen with ageing in the absence of Alzheimer’s disease pathology, and whether these differential patterns can be used to develop composite connectivity measurements that are helpful in disambiguating Alzheimer’s disease- and age-related connectivity changes.
To better isolate changes seen along the Alzheimer’s disease trajectory from those seen with ageing, we made use of functional connectivity MRI data from relatively young individuals harbouring mutations leading to autosomal dominant Alzheimer’s disease (ADAD) participating in the Dominantly-Inherited Alzheimer’s Network (DIAN; ClinicalTrials.gov Identifier: NCT00869817). Because of the relatively early age of symptom onset and the near complete penetrance of ADAD-causing mutations, this population offers a rare opportunity to examine Alzheimer’s disease network changes in the absence of advanced age and in individuals on a certain Alzheimer’s disease trajectory (Bateman et al., 2012). Notably, pathology studies from the DIAN cohort suggest young individuals with ADAD show much lower levels of age-related pathologies (e.g. hippocampal sclerosis, argyrophilic grain disease, microinfarcts) than are seen in late-onset Alzheimer’s disease (Cairns et al., 2015).
The ADAD derived pattern is then compared to the pattern seen in imaging biomarker defined preclinical, late-onset Alzheimer’s disease (Sperling et al., 2011; Jack et al., 2012), and to the pattern seen in ageing in the absence of imaging biomarkers suggestive of Alzheimer’s disease pathology. The stratification of clinically normal elderly (CNE) individuals based on Alzheimer’s disease imaging biomarkers, using a combination of amyloid PET, structural MRI assessment of hippocampal volume, and 18F-fludeoxyglucose (FDG) PET, allows for better separation of ageing and preclinical Alzheimer’s disease, a critical step in disambiguating these often overlapping processes (Brier et al., 2014). Importantly, work from a number of large cohorts [including the Harvard Aging Brain Study (HABS)] strongly suggests that individuals with imaging biomarkers suggestive of preclinical Alzheimer’s disease show increased rates of cognitive decline in longitudinal studies, particularly when early signs of neurodegeneration are coupled with elevated amyloid burden (Chételat et al., 2012; Jack et al., 2012; Knopman et al., 2012; Mormino et al., 2014; Burnham et al., 2016).
Comparability across these diverse clinical groups is facilitated by the use of template-based rotation (TBR), an analytic technique that applies a uniform set of network templates across cohorts (Schultz et al., 2014). As the network templates in TBR are derived entirely out-of-sample, they are not affected by the clinical make-up of particular subject samples, differentiating TBR from group independent components analysis. Using TBR, we examine connectivity changes in four cognitive networks implicated in Alzheimer’s disease-related cognitive decline: the default (Greicius et al., 2004), salience (Fox et al., 2006; Seeley et al., 2007, 2009), dorsal attention (Corbetta and Shulman, 2002; Ptak and Schnider, 2010; Brier et al., 2012), and control networks (Schultz et al., 2014; Shaw et al., 2015; Buckley et al., 2017), and compare these to connectivity changes seen in three networks less implicated in Alzheimer’s disease: the motor (Damoiseaux et al., 2006; James et al., 2009; Inman et al., 2012), extrastriate visual (Yeo et al., 2011, 2013), and primary visual networks (Beckmann and Smith, 2004; Beckmann et al., 2005; Yeo et al., 2011; Mueller et al., 2013). While prior studies (and clinical observation) strongly suggest that cognitive networks may be preferentially degraded in Alzheimer’s disease, the inclusion of three non-cognitive networks allows greater potential for contrasting multi-network patterns of degradation in ageing and Alzheimer’s disease, and provides context for understanding the degree to which particular networks are preferentially targeted in Alzheimer’s disease.
Whole network connectivity analyses using TBR are complemented by secondary analyses examining node-to-node connectivity more broadly within and across networks. This more network agnostic analytic method allows for an understanding of distributed versus local failure of cognitive networks, as well as the opportunity to examine inter-network connections and anti-correlations that are degraded in Alzheimer’s disease and ageing comparisons (Chan et al., 2014; Geerligs et al., 2015; Turner and Spreng, 2015).
We identify distinct multi-network degradation patterns along the ageing and Alzheimer’s disease trajectories, providing further evidence that ageing and Alzheimer’s disease are distinct pathophysiologies and that Alzheimer’s disease pathology preferentially degrades connections within cognitive networks. This distinctive, Alzheimer’s disease-related multi-network pattern of degradation could be observed across a wide range of impairment, including in early disease and in advanced states of impairment. These findings support the selective vulnerability of particular networks in Alzheimer’s disease and are consistent with the preferential spread of pathology within targeted networks. Lastly, we argue that an understanding of the differential patterns of network degradation in ageing and Alzheimer’s disease can be leveraged to yield connectivity measurements that can better isolate Alzheimer’s disease-driven changes in connectivity from those likely due to normal ageing.
Materials and methods
Participants
Participants provided informed consent in accordance with the local institutional review boards of each participating site. ADAD participants were drawn from the DIAN (U19-AG032438, Clinical Trial Identifier NCT00869817), a study that enrols persons at risk or known to carry pathogenic mutations in presenilin-1 (PSEN1), presenilin-2 (PSEN2), or amyloid precursor protein (APP). Details on genetic analyses for ADAD mutations and detailed protocols for DIAN have previously been published (Bateman et al., 2012). Each DIAN participant’s estimated years to symptom onset (Table 1) was computed as the participant’s age minus the age at which the participant’s parent or sibling first showed symptoms of progressive cognitive decline. Cognitively normal young and elderly participants were drawn from the HABS (P01-AG036694). HABS participants are native English speakers who fell into normal ranges for Mini-Mental State Examination (MMSE), Clinical Dementia Rating (CDR), and Logical Memory scores at study entry.
Participants from the DIAN
| Group | n | Mean age | APOE ɛ4 carriers, n | Sex, F/M | Estimated years to symptom onset | Families, n | Mutation type, n (PSEN1/PSEN2/ APP) | Mean movement (mm/TR) | Mean unusable volumes, n |
|---|---|---|---|---|---|---|---|---|---|
| M+ CDR0 | 66 | 33.9 ± 7.99 | 14 | 41/25 | −13.48 ± 7.36 | 41 | 49/6/11 | 0.060 ± 0.033 | 5.00 ± 2.88 |
| M+ CDR0.5 | 29 | 43.62 ± 11.55 | 9 | 19/10 | −2.66 ± 7.84 | 24 | 25/2/2 | 0.062 ± 0.037 | 4.21 ± 2.37 |
| M+ CDR1+ | 17 | 49.35 ± 7.84 | 2 | 7/10 | 3.24 ± 8.05 | 16 | 15/0/2 | 0.090 ± 0.034 | 4.82 ± 2.27 |
Values are presented as mean ± SD. TR = repetition time.
Functional connectivity MRI
DIAN and HABS participants underwent eyes-open resting state functional MRI. DIAN data were collected at multiple sites on either a 3 T Siemens Trio TIM or Verio scanner using a 12-channel or 32-channel head coil, depending on site. All HABS data were collected on one 3 T Siemens Trio Tim scanner. For DIAN participants, images were acquired in a single run of 120 time points, lasting ∼4.5 min (repetition time = 2200 ms). For HABS, images were acquired in two runs of 124 time points (repetition time = 3000 ms), with each run lasting ∼6 min (12 min total). Subject-level connectivity maps for each network template were generated, and connectivity for each network is the average correlation of all voxels within a particular thresholded network template mask (Fig. 1). In nodal connectivity analyses, average correlation values from voxels within each node pair were taken as measures of connectivity strength. Detailed acquisition parameters, processing information, derivation of network templates, node maps, and whole network measurements can be found in prior publications (Schultz et al., 2014, 2017; Shaw et al., 2015; Buckley et al., 2017). Additional details of DIAN functional connectivity MRI acquisitions and discussion of site as a potential covariate can be found in Chhatwal et al. (2013) and Thomas et al. (2014).
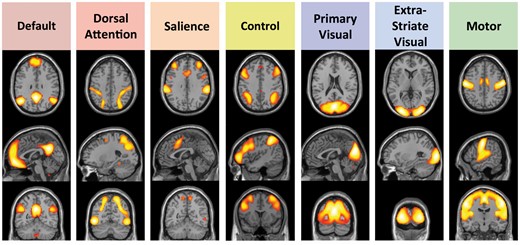
Cortical intrinsic connectivity networks chosen for analysis. These networks fall into three broad classes: Four cognitive networks (default, dorsal attention, salience, and control) thought to be involved in directed attention, memory and other aspects of cognition; two networks centred on primary and higher order visual cortices (primary visual and extrastriate visual); and a motor network including the pre-central gyrus and supplementary motor regions. Map threshold of P ≤ 0.05 (family-wise error corrected). Adapted from Schultz et al. (2014).
Imaging biomarkers of preclinical Alzheimer’s disease
Using acquisition parameters and processing described in the Supplementary material, baseline structural MRI, 18F-FDG-PET, and 11C-Pittsburgh compound B (PiB) PET were used as imaging biomarkers of preclinical Alzheimer’s disease in CNE subjects from HABS. PiB-PET was measured in a large cortical region of interest including frontal, lateral, and retrosplenial areas that largely excludes primary sensory regions of cortex (frontal, lateral, and retrosplenial regions, FLR). Cerebellar grey was used as a reference region for PiB-PET. FDG measures were made using the Landau meta-region of interest (Landau et al., 2011) as operationalized by Jack et al. (2012), and implemented in HABS by Mormino et al. (2014). This meta-region of interest consists of regions in the lateral parietal, lateral temporal, and posterior midline normalized to pons. Measures of hippocampal volume were obtained from Freesurfer (https://surfer.nmr.mgh.harvard.edu/), and were corrected for total intracranial volume as in Mormino et al. (2014).
Prior work from HABS has shown that amyloid-β+ CNE with evidence of neurodegeneration (assessed using FDG and hippocampal volume) show greater longitudinal decreases in global cognition than others within the cohort, suggesting this is an at-risk group for progression to Alzheimer’s disease (Mormino et al., 2014). We applied a two component Gaussian mixture model to separate HABS participants into amyloid-β+ and amyloid-β− groups (Mormino et al., 2014), using a 90% probability threshold for belonging to amyloid-β+ and amyloid-β− distributions. This resulted in a PiB FLR DVR threshold of ≤1.133 and ≥1.230 for amyloid-β− and amyloid-β+ groups, respectively. Of 234 potential subjects, 148 were classified as amyloid-β−, 58 as amyloid-β+, and 28 as amyloid-β intermediate. Markers of neurodegeneration (FDG and hippocampal volume) were converted to z-scores, combined, and then split into tertiles. Using this information, we separated the HABS sample into groups likely to show decline due to Alzheimer’s disease (CNE AD+) and those unlikely to show decline due to Alzheimer’s disease (CNE AD−). Individuals in the CNE AD+ group were required to be amyloid-β+ and in the lower tertile of the HABS sample for FDG-PET metabolism and/or hippocampal volume (30 of 58 amyloid-β+ participants). Individuals with low amyloid and who were not in the lowest tertile for either FDG-PET or hippocampal volume were placed in the CNE AD− group (59 of 148 amyloid-β− participants). Individuals with non-concordant biomarkers or intermediate amyloid-β levels (CNE Alzheimer’s disease Intermediate) were not included in the main analyses to focus on individuals at greatest risk of cognitive decline and to reduce ambiguity as to whether variations in connectivity measurements were attributable to preclinical Alzheimer’s disease. Comparisons of CNE AD− and CNE AD+ to CNE Alzheimer’s disease Intermediate are included in the Supplementary material.
Statistics
Independent sample t-tests and ANOVA were used to compare single or composite network connectivity measurements across groups (Figs 2–4) and to derive effect sizes (Cohen’s d; Cohen, 1988) using R version 3.2.0 (The R Foundation for Statistical Computing). Degradation patterns are shown and discussed primarily using effect sizes measures, as sample sizes vary across clinical groups and comparisons, limiting the interpretability of relative P-values across comparisons. P-values shown have not been corrected for multiple comparisons in these exploratory analyses, as the impact and severity of such correction would vary based on the effect and sample size for each comparison. No statistical comparisons were made across clinical cohorts (DIAN versus HABS) to avoid confounds of differing MRI acquisitions, variability in testing, and variations in inclusion/exclusion criteria. Differential patterns of network degradation were examined with linear mixed effects models including a network or network type (i.e. Cognitive or Visual or Motor) × Clinical Group interaction term. To statistically compare the relative degree of network change in one network (or network type) to another, significant interaction terms were followed with pairwise, post hoc comparisons of each network or network type pair to determine the direction and statistical significance of each comparison. Covariates for quality of measurement (movement during scanning, number of unusable functional MRI volumes) were included in all models. As in prior functional connectivity MRI publications from the DIAN sample (Chhatwal et al., 2013; Thomas et al., 2014), site was not included as a covariate for functional connectivity MRI analyses (see Chhatwal et al., 2013 for discussion). Further information on covariate selection can be found in the Supplementary material.
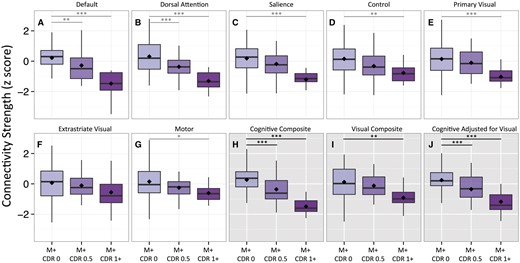
Single and multi-network composite comparisons in autosomal dominant Alzheimer’s disease mutation carriers. Seven single-network connectivity measurements (white backgrounds, A–G) and three composite connectivity measurements (grey backgrounds, H–J) were calculated for individuals carrying known pathogenic mutations leading to autosomal dominant Alzheimer’s disease. Mutation carriers (M+) were separated according to their CDR at the time of imaging (CDR0, 0.5 and ≥1). Filled diamonds indicate means for each group. *P ≤ 0.05, **P ≤ 0.005, ***P ≤ 0.001.
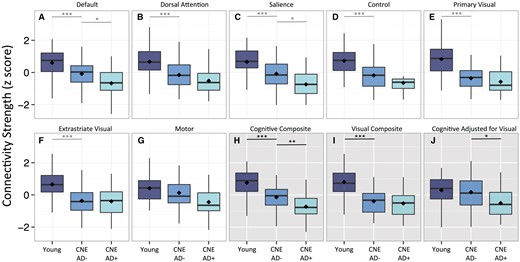
Single and multi-network composite comparisons in young and CNE participants. Seven single-network connectivity measurements (white backgrounds, A–G) and three composite connectivity measurements (grey backgrounds, H–J) were calculated for young individuals and cognitively normal elderly with (CNE AD+) and without (CNE AD−) imaging biomarkers suggestive of preclinical Alzheimer’s disease. Filled diamonds indicate means for each group. *P ≤ 0.05, **P ≤ 0.005, ***P ≤ 0.001.
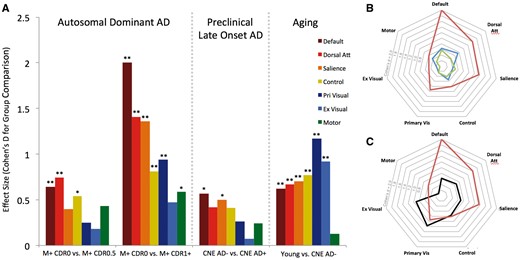
Patterns of connectivity change in ageing and Alzheimer’s disease. (A, left) Connectivity changes in ADAD were assessed by comparing asymptomatic ADAD mutation carriers (M+ CDR0) to mildly impaired ADAD mutation carriers (M+ CDR0.5) and more impaired ADAD mutation carriers (M+ CDR1+). Middle: Connectivity changes in preclinical, late-onset Alzheimer’s disease were assessed by comparing cognitively normal elderly individuals with (CNE AD+) and without (CNE AD−) imaging biomarker evidence of Alzheimer’s disease pathology. Right: Connectivity changes with age in the absence of Alzheimer’s disease pathology were assessed by comparing cognitively normal young and elderly individuals (CNE AD−). (B and C) Polar plots of data from A showing similar patterns of connectivity change in preclinical Alzheimer’s disease and ADAD (B; blue = M+ CDR0 versus 0.5; red = M+ CDR0 versus 1+; green = CNE AD− versus CNE AD+) and differential change in ageing and Alzheimer’s disease (C; red = M+ CDR0 versus 1+; black = Young versus CNE AD−). Absolute values for each effect are shown. Confidence intervals for effect size are listed in Supplementary Table 1. **P ≤ 0.005 and *P ≤ 0.05.
Results
Participant demographics
For ADAD, we compared connectivity data from seven intrinsic connectivity networks in 112 individuals known to carry pathogenic mutations leading to dominantly inherited Alzheimer’s disease (Fig. 1). Of these individuals, 66 were assessed as having a global CDR (Morris, 1993) of 0 [mutation carriers (M+) CDR0], 29 had a CDR of 0.5 (M+ CDR 0.5), and 17 had a CDR of ≥1 (M+ CDR1+; 12 CDR 1, 3 CDR 2, 2 CDR 3). As expected, the more impaired mutation carriers were older than the less impaired mutation carriers (Table 1).
Connectivity measures across these same seven networks (Fig. 1) were also calculated for 170 HABS participants, including 81 young control subjects and 89 CNE. Irrespective of biomarker status, CNE individuals had MMSE scores of >26, a global CDR of 0, and scored above an education-adjusted cut-off for Logical Memory IIa (Aisen et al., 2010). As described above, PiB-PET, FDG-PET, and MRI-based hippocampal volume measurements were used to stratify CNE subjects into two groups: CNE AD− (n = 59) and CNE AD+ (n = 30). The goal of separating CNE individuals into CNE AD+ and CNE AD− populations was to achieve a clearer separation between CNE likely at risk of impending cognitive decline due to Alzheimer’s disease from those less likely to show cognitive decline. No baseline differences in global cognition or episodic memory were present between CNE AD− and CNE AD+ groups at the time of enrolment in the study.
Network degradation in autosomal-dominant Alzheimer’s disease
ANOVA across M+ CDR0, M+ CDR 0.5, and M+ CDR1+ showed significant differences in the default [F(2,107) = 22.98, P < 0.001], salience [F(2,107) = 11.89, P < 0.001], dorsal attention [F(2,107) = 18.55, P < 0.001], control [F(2,107) = 5.80, P < 0.01], primary visual [F(2,107) = 7.32, P = 0.001] and motor networks [F(2,107) = 4.11, P = 0.02]. No significant difference across groups was observed in the extrastriate visual network [F(2,107) = 1.72, P = 0.181]. Post hoc contrasts between clinical groups are shown in Fig. 2 and Supplementary Table 1.
To compare network degradation in one network compared to others statistically, we performed a separate analysis with network as a seven-level repeated measure for each subject, and included the interaction between Clinical Group and Network. This analysis demonstrated that particular networks were differentially degraded in ADAD [Network × Group Interaction F(12,654) = 3.62, P = 0.001]. To examine this interaction more closely, comparisons between network pairs were performed. Analyses showed default and dorsal attention network connectivity decreased with increasing CDR to a significantly greater extent than control [default: F(2,109) = 14.96, P < 0.001; dorsal attention: F(2,109) = 6.03, P = 0.003], primary visual [default: F(2,109) = 6.711, P = 0.002; dorsal attention: F(2,109) = 5.372, P = 0.006], extrastriate visual [default: F(2,109) = 7.657, P < 0.001; dorsal attention: F(2,109) = 4.747, P = 0.011] and motor network connectivity [default: F(2,109) = 7.923, P < 0.001; dorsal attention: F(2,109) = 4.364, P = 0.015]. The salience network showed greater degradation with increasing CDR than the control network [F(2,109) = 4.363, P = 0.015].
Network degradation in ageing
To identify changes in connectivity with ageing in the absence of early Alzheimer’s disease pathology, we compared CNE with no imaging biomarker evidence of preclinical Alzheimer’s disease (CNE AD−) to normal young subjects. Connectivity was decreased broadly across networks, with the exception of the motor network (Fig. 3). Specifically, we observed significantly decreased default, dorsal attention, salience, control, primary visual, and extrastriate visual network connectivity in CNE AD− as compared to young subjects (Fig. 3 and Supplementary Table 1).
Similar to ADAD comparisons, secondary analyses were performed to examine interactions between network and group (young versus CNE AD−). A significant Network × Group interaction suggested that not all networks were equally impacted with ageing [F(5,720) = 5.949, P < 0.001], and post hoc pairwise analysis demonstrated the motor network showed significantly less degradation than primary visual [F(1,144) = 20.196, P < 0.001], extrastriate visual [F(1,144) = 12.689, P < 0.001], default [F(1,144) = 4.221, P = 0.042], dorsal attention [F(1,144) = 7.617, P = 0.007], control [F(1,144) = 10.076, P = 0.002], and salience networks [F(1,144) = 5.070, P = 0.0259]. In addition, the default [F(1,144) = 11.563, P < 0.001], dorsal attention [F(1,144) = 8.375, P = 0.004], and salience [F(1,144) = 8.043, P = 0.005] networks showed significantly less degradation with age as compared to the primary visual network. Other pairwise comparisons were non-significant at P ≤ 0.05.
Network degradation in preclinical Alzheimer’s disease
To identify network degradation in preclinical sporadic Alzheimer’s disease, we compared CNE with and without imaging biomarker evidence of Alzheimer’s disease pathology (CNE AD+ and CNE AD−, respectively). Single network analyses showed decreased functional connectivity in CNE AD+ for the default and salience networks (Fig. 3 and Supplementary Table 1). Participants with preclinical Alzheimer’s disease also showed a preferential degradation of certain networks over others [Network × Group interaction: F(6,522) = 2.144, P = 0.047]. Post hoc pairwise analyses demonstrated significantly decreased default and salience network connectivity in CNE AD− as compared to CNE AD+ (Fig. 3 and Supplementary Table 1). No significant differences in primary visual, extrastriate visual, or motor network connectivity were observed between CNE AD− and AD+ subjects (all P > 0.2).
Supplementary analyses examined CNE with intermediate or indeterminate imaging biomarkers of Alzheimer’s disease (e.g. intermediate range PiB-PET, discordant PiB and neurodegenerative biomarker profiles; CNE Alzheimer’s disease intermediate). As compared to CNE AD−, the CNE Alzheimer’s disease intermediate group showed significantly lower motor (d = 0.45; P = 0.004) and salience network connectivity (d = 0.3, P = 0.05; Supplementary Table 3 and Supplementary Fig. 3).
Nodal connectivity
The foregoing observations used whole-network functional connectivity MRI measurements to assess connectivity changes in ageing and Alzheimer’s disease. This type of analysis does not directly examine between-network (inter-network) connectivity and leaves open the possibility that focal failure of one or a few nodes within a network may be driving the whole network effects present in the data. To address these possibilities and to derive more information about the anatomical patterns of network degradation, we performed a confirmatory connectivity analysis in which each network was decomposed into individual nodes and connectivity was broadly examined between all nodes (within and between networks). We assessed connection strength in both positively- and negatively-coupled node pairs (correlations and anti-correlations, respectively). Nodes corresponded to the central structures in network template maps used for whole network analyses (Figs 1 and 5A, Supplementary Fig. 1 and Supplementary Video 1). As with the whole network templates, node maps were derived on an outside sample of 675 normal young subjects imaged as part of the Brain Genomics Superscript Project.
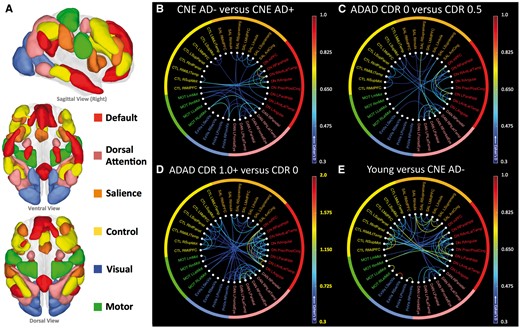
Nodal connectivity, grouped by network. Within- and between-network positive connections lost in preclinical Alzheimer’s disease, ADAD, and normal ageing are shown. (A) Cortical networks were separated into their constituent nodes prior to connectivity analysis. The size and anatomic locations of each node are shown in A above, with colours to indicate network membership for each node. Abbreviations and further anatomic detail can be found in Supplementary Fig. 1 and Supplementary Video 1. Extrastriate and primary visual networks are combined. (B) CNE AD+ participants showed lower connection strength as compared to CNE AD− especially within the default and dorsal attention networks. (C) ADAD mutation carriers at CDR 0.5 show degraded connectivity as compared to asymptomatic mutation carriers (CDR0), especially in the default and dorsal attention networks. (D) As a group, ADAD mutation carriers with dementia (CDR1+) show decreased connectivity across several networks, with the greatest change in the default and dorsal attention networks. As group level changes in this comparison were larger than in B, C and E, a broader scale range was used (indicated with yellow highlights). (E) Decreases in connectivity seen when comparing normal young participants with CNE AD− were broadly distributed across networks, with the greatest change in visual networks.
Mirroring whole network connectivity patterns, decreases in within-network correlations in the default and dorsal attention networks were apparent in early ADAD and more pronounced in more advanced disease (Fig. 5C and D). Disrupted within-network connectivity in default and dorsal attention network nodes was also observed in preclinical Alzheimer’s disease, again similar to whole network connectivity patterns (Fig. 5). In advanced ADAD (Fig. 6A), nearly every connection within the default (24 of 28 connections significantly degraded) and dorsal attention networks was compromised (14 of 15 connections significantly degraded; Fig. 6B, map threshold of P < 0.05). The nodal connectivity pattern in the normal ageing comparison showed broadly distributed connectivity decreases in both cognitive and visual networks, consistent with the whole network findings (Figs 5E and 6B).
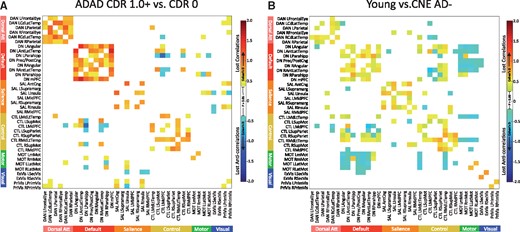
Correlations and anti-correlations degraded in ADAD and ageing. (A) Comparing M+ CDR0 and M+ CDR1+, degraded positive correlations in ADAD (warm colours) outnumbered degraded anti-correlations (cool colours). Mirroring whole network connectivity patterns, the largest number and magnitude of degraded connections were within cognitive networks, particularly the default and dorsal attention networks. (B) Comparing young subjects to CNE AD−, the preferential degradation of positive connections in the default and dorsal attention networks was not evident, and more inter-network connections and anti-correlations were degraded with ageing as compared to ADAD. Map threshold P < 0.05.
In examining connections degraded in ADAD, more within-network connections were significantly degraded in advanced ADAD as compared to between-network connections, and more connections between positively coupled nodes (correlations) were degraded as compared to connections between negatively coupled nodes (anti-correlations). Specifically, 57 of 104 (54.8%) within-network connections (many in cognitive networks) were significantly degraded in advanced ADAD, compared with 36 of 562 (6.4%) between-network connections. Among significantly degraded connections (threshold of P ≤ 0.05, Fig. 6), the mean effect for decreased within-network connections (0.81 ± 0.23 SD; thresholded at P ≤ 0.05, as in Fig. 6) was significantly higher than the mean effect for between-network connections [0.59 ± 0.14 SD; t(92) = 6.044, P < 0.001; Figs 5C, D and 6A]. Anti-correlations accounted for 14 of 36 (38.9%) significantly degraded between-network connections in ADAD (Fig. 6A).
These patterns were less clear in ageing comparisons. The magnitude of connectivity loss was generally lower in ageing comparisons relative to what was observed in advanced ADAD, and decreased between-network connections accounted for a larger proportion of the lost connectivity overall (Figs 5C and 6B). In the ageing comparison, 54 of 104 (51.9%) within-network connections were significantly degraded at P < 0.05, with a mean effect size (cohen’s d) of 0.53 ± 0.13. Seventy-two of a possible 562 (12.8%) between-network connections were significantly degraded in the same comparison, with a mean effect size of 0.46 ± 0.10. Of these, 72 degraded between network connections, 47 were anti-correlations (65.3%; Fig. 6B, map threshold P < 0.05).
Formalizing patterns of network degradation
In comparing ADAD and ageing, partially overlapping decreases in single network connectivity in the default, dorsal attention, control, and salience networks reduce the utility of any individual network measurements to distinguish ageing from Alzheimer’s disease. The whole network analyses above (e.g. Fig. 4) indicate that the preferential degradation of cognitive networks is seen across the spectrum of ADAD and preclinical Alzheimer’s disease. However, visual and cognitive networks are both similarly decreased with normal ageing in the absence of Alzheimer’s disease biomarkers.
Accordingly, we explored the possibility that composite connectivity measurements that reflect changes in cognitive network connectivity relative to visual network connectivity could be useful in disambiguating Alzheimer’s disease-related from age-related network degradation. An average of whole network measurements across the four cognitive networks (cognitive composite) decreased with both ageing and Alzheimer’s disease (Figs 2H and 3H). Similar effect sizes for cognitive network degradation were seen when comparing asymptomatic to mildly impaired ADAD mutation carriers (M+ CDR0 to M+ CDR0.5) and young subjects to CNE without biomarkers suggestive of Alzheimer’s disease (ageing comparison; Young versus CNE AD−), indicating that an aggregate measure of cognitive network connectivity is insufficient to distinguish age and Alzheimer’s disease-related changes. Average connectivity in visual networks (visual composite; Figs 2I and 3I) decreased significantly both in ageing and in late ADAD comparisons (M+ CDR0 versus M+ CDR1+). Controlling for visual network connectivity when assessing cognitive network connectivity (cognitive adjusted for visual; Figs 2J and 3J) preserved connectivity changes in ADAD and preclinical Alzheimer’s disease comparisons, and yielded group differences that were similar in magnitude to the unadjusted cognitive composite (Figs 2, 3 and Supplementary Table 1). In CNE with intermediate imaging biomarkers of Alzheimer’s disease, adjusting for cognitive network for visual network connectivity yielded a composite measure that was intermediate between CNE AD− and CNE AD+ groups (Supplementary Table 3 and Supplementary Fig. 3). Using this same metric, no significant difference was seen in the ageing comparison (Fig. 3J), suggesting this adjusted connectivity metric is relatively insensitive to age-related connectivity change but remains reflective of Alzheimer’s disease-related connectivity changes that worsen with impairment (Figs 2, 3 and Supplementary Table 1). In Alzheimer’s disease comparisons, a strikingly similar pattern of degraded within- and between-network connections was seen when comparing visual network adjusted (Supplementary Fig. 2A–C) and unadjusted connection strengths (Fig. 5B–D), indicating that controlling for visual network connectivity did not alter the observed anatomic pattern or magnitude of network degradation in ADAD and preclinical Alzheimer’s disease. In contrast, controlling for visual network changes greatly diminished the magnitude of connectivity changes in the ageing comparison (Supplementary Fig. 2D), suggesting that adjusting for visual network connectivity may serve to highlight AD− over age-related connectivity changes.
Participants from the Harvard Aging Brain Study
| Group | n | Age | APOE ɛ4 carriers, n | Sex, F/M | PiB FLR DVR | FDG SUVR (Landau ROI) | Hippocampal volume (mm3) | Mean movement (mm/TR) | Mean unusable volumes, n |
|---|---|---|---|---|---|---|---|---|---|
| CNE AD− | 59 | 70.29 ± 4.36 | 9 | 41/18 | 1.08 ± 0.03 | 1.40 ± 0.10 | 8146 ± 543 | 0.092 ± 0.060 | 4.98 ± 1.73 |
| CNE AD+ | 29 | 78.51 ± 5.83 | 15 | 19/11 | 1.43 ± 0.13 | 1.21 ± 0.07 | 6608 ± 634 | 0.109 ± 0.050 | 4.90 ± 1.85 |
| Young | 86 | 21.58 ± 3.43 | NA | 39/47 | NA | NA | NA | 0.053 ± 0.027 | 4.29 ± 1.49 |
Values are presented as mean ± SD.
DVR = distribution volume ratio; FLR = frontal, lateral, and retrosplenial areas; ROI = region of interest; SUVR = standardized uptake value ratio; TR = repetition time.
Discussion
Across a wide spectrum of impairment and across both whole network and nodal connectivity measures, we observed that cognitive networks were preferentially degraded in ADAD, with clear changes in motor and visual networks seen only in later, more symptomatic disease. The preferential degradation of cognitive networks, especially the default and dorsal attention networks, was statistically discernible in early symptomatic stages of disease and was magnified in advanced ADAD. A nascent form of this same pattern was observed when comparing older individuals with and without biomarker evidence of preclinical Alzheimer’s disease, suggesting this Alzheimer’s disease multi-network degradation pattern is conserved across a wide clinical spectrum of ADAD and preclinical, late-onset Alzheimer’s disease. Notably, the multi-network degradation pattern observed here is generally consistent with and expands on prior functional connectivity MRI studies in early- and late-onset Alzheimer’s disease (Greicius et al., 2004; Zhou et al., 2010; Lehmann et al., 2013b; Thomas et al., 2014). Relative to prior reports in ADAD (Chhatwal et al., 2013; Thomas et al., 2014), the present report utilizes a larger set of networks (with differential vulnerability to Alzheimer’s disease pathology), includes subjects with preclinical late-onset Alzheimer’s disease, and uses an analytic approach that yields substantially larger group differences across ageing and Alzheimer’s disease comparisons. The effects seen using whole network measurements were largely similar when node-to-node connectivity was assessed, with degraded connectivity seen across several nodes within an affected network. Together, the whole network and nodal connectivity analyses suggest that Alzheimer’s disease pathology preferentially targets connections within cognitive networks, especially nodes within the default and dorsal attention networks.
This Alzheimer’s disease-derived pattern contrasted with what was seen in ageing-focused comparisons, where we observed that visual networks were degraded to a similar or larger degree than cognitive networks, with little change seen in the motor network. This age-related pattern of network degradation is consistent with that described by Siman-Tov et al. (2016), where age-related changes in visual and cognitive networks were similar, but changes in motor network connectivity were less clear. Also in agreement with Siman-Tov et al. (2016), we observed age-related decreases in inter-network connectivity and anti-correlation strength (particularly between cognitive networks) in our CNE AD− group compared to young controls. Perhaps owing to the differential sensitivity of analytic approaches, the age-related degradation of visual networks seen here and in some prior reports (Onoda et al., 2012; Siman-Tov et al., 2016) contrasts with findings from an earlier, seed-based connectivity study in which preserved visual network connectivity with ageing was reported (Andrews-Hanna et al., 2007).
Importantly, the decrease in cognitive network connectivity seen across the ∼50-year span that separates our CNE AD− and normal young participants is similar to the amount of change seen when comparing mildly impaired (CDR 0.5) to asymptomatic ADAD mutation carriers, and only slightly more than what was seen with preclinical Alzheimer’s disease. This suggests that while ‘normal ageing’ itself may decrease default network connectivity, it does so without the network preferentiality seen in Alzheimer’s disease and with a magnitude that is substantially smaller than that seen across the Alzheimer’s disease spectrum. In agreement with a recent study from Brier and colleagues (2014), this result also highlights the critical importance of separating CNE with and without signs of Alzheimer’s disease pathology when assessing age-related connectivity changes.
Nodal connectivity analyses indicate that diminished whole network connectivity in ADAD is due to the distributed failure of nodes within each cognitive network, as opposed to the focal failure of a particular node within a network. These nodal connectivity analyses also demonstrate that even in advanced ADAD, relatively few inter-network connections and anti-correlations are degraded. These observations offer indirect support for ‘network diffusion’ models of Alzheimer’s disease progression (Seeley et al., 2009; Raj et al., 2012, 2015; Zhou et al., 2012; Iturria-Medina et al., 2014), as the within-network spread of pathology would be expected to generate progressive degradation of connections within preferentially targeted networks. Though functional connectivity MRI is an indirect measure of synaptic integrity, a number of recent studies suggest that functional connectivity measurements are underpinned by structural (and presumably synaptic) connections (Honey et al., 2007; Greicius et al., 2009) and that nodal connectivity patterns are reflected in the differential atrophy patterns of neurodegenerative diseases (Seeley et al., 2009; Zhou et al., 2012). As highly connected nodes group into the same networks, we would expect the trans-synaptic spread of pathologic protein species to lead to preferential degradation of within- as compared to between-network connections. The observations here are consistent with this prediction, both at the level of whole networks and node-to-node connectivity.
The presence of relatively few degraded between-network connections and anti-correlations even in advanced ADAD (Fig. 6A) contrasts with the much more diffuse pattern seen in the ageing comparisons. The relatively indiscriminate connectivity decreases seen with ageing suggests that ageing alone lacks the distinct network pattern characteristic of Alzheimer’s disease (and likely other neurodegenerative diseases). Lastly, though diffusion of pathology may be more efficient within-networks, the modest levels of motor and visual network degradation seen in advanced ADAD may reflect the less-efficient process of inter-network spread becoming evident in later stages of disease.
The presence of a consistent multi-network degradation pattern across a wide range of Alzheimer’s disease coupled with the observation that alterations in default network connectivity can be seen in a wide array of disorders (Sun et al., 2013; Chanraud et al., 2014; Baggio et al., 2015) indicates both the possibility and potential need to develop multi-network composites as complements to single-network connectivity measures (Jones et al., 2016). Based on the differences between ageing and Alzheimer’s disease patterns of degradation, we explore a multi-network composite that retains sensitivity to Alzheimer’s disease-related connectivity changes while greatly decreasing the influence of across-the-lifespan, age-related changes. Future studies are needed to optimize disease-specific connectivity composites that could be used to identify at-risk or very early disease in clinical trial populations, and perhaps to track treatment-related change in clinical trials. Additionally, the patterns of connectivity change seen here in cross-sectional data will need to be verified in other samples and in longitudinal functional connectivity MRI analyses, especially as multiple comparisons correction was not used here to preserve multi-network patterns across comparisons with widely varying sample and putative effect sizes.
To focus on early evidence of Alzheimer’s disease-related network degradation, we used PiB-PET, FDG-PET, and structural MRI to separate CNE individuals into groups that were more (CNE AD+) or less (CNE AD+) likely to be on an Alzheimer’s disease trajectory, and used these groupings in our primary analyses. Brief supplemental examination of CNE with less clear Alzheimer’s disease biomarker profiles (CNE Alzheimer’s disease intermediate; Supplementary Table 3 and Supplementary Fig. 3) suggests that this intermediate group may show lower cognitive network connectivity than CNE AD−, but with effect sizes that are smaller than the decreases in CNE AD+ relative to CNE AD−. This result is consistent with longitudinal studies demonstrating that elderly with intermediate imaging biomarkers of Alzheimer’s disease also show levels of cognitive decline or diminished practice effect that are intermediate between low amyloid + low neurodegeneration and high amyloid + high neurodegeneration groups (e.g. Mormino et al., 2014). This result is also consistent with a recent report from HABS indicating that decreased connectivity in the default, salience, and control networks is a significant predictor of longitudinal cognitive decline, both alone and synergistically with amyloid burden (Buckley et al., 2017). However, reductions in motor connectivity in the CNE Alzheimer’s disease intermediate group relative to CNE AD− were greater than those seen in CNE AD+, especially in CNE with low amyloid burden (Supplementary Table 3). This suggests connectivity changes in the heterogeneous CNE Alzheimer’s disease intermediate group may be due to factors beyond those captured solely by Alzheimer’s disease imaging biomarkers.
From a methodological perspective, comparability across cohorts and diverse clinical populations is enhanced by the use of a uniform set of network descriptions. These network descriptions are derived entirely out-of-sample, and are not influenced by the numbers and distribution of subjects in the clinical groups that comprise the comparison, similar to conventional seed-based analysis approaches and unlike conventional group independent component analysis (ICA) approaches (Schultz et al., 2014; Griffanti et al., 2016). Prior studies from our group using the TBR analytic method demonstrate that it has potentially greater sensitivity to young/old group differences than seed-based approaches, and similar to that of dual-regression ICA with out-of-sample network descriptions (Schultz et al., 2014). The results here also suggest that TBR yields substantially larger effect sizes in ADAD comparisons than prior seed-based analyses in the DIAN sample (Thomas et al., 2014). Lastly, recent work from Frisoni and colleagues also suggests that non-seed-based approaches to connectivity analysis may improve reliability across sessions (Jovicich et al., 2016).
More broadly, these results suggest that the differential targeting of intrinsic connectivity networks in neurodegenerative disease can be carried forward into multi-network connectivity measurements that improve on single-network connectivity measurements. Using multi- or inter-network composite connectivity measures may be particularly useful as a means of increasing the specificity of functional connectivity MRI biomarkers for a particular disease of interest, and reducing the influence of common confounding conditions. In turn, this disambiguation of a disease state from a common confound may be useful as a means for enriching clinical trial populations and to maximize the utility of functional connectivity MRI as a non-invasive and relatively inexpensive clinical research tool.
Acknowledgements
This manuscript has been reviewed by DIAN Study investigators for scientific content and consistency of data interpretation with previous DIAN study publications. We gratefully acknowledge the altruism and dedication of our participants and their families, the contributions of the DIAN Genetics Core in determining genotype data, and the efforts of the DIAN and HABS research and support staff for their contributions to this study.
Funding
Data collection and sharing for this project was supported by The Dominantly Inherited Alzheimer's Network (DIAN, U19AG032438) and the Harvard Aging Brain study (HABS; P01AG036694), both funded by the National Institute on Aging (NIA). Support was provided by the German Center for Neurodegenerative Disease (DZNE) for DIAN performance sites in Tuebingen and Munich, by the NIHR Queen Square Dementia Biomedical Research Unit and the MRC Dementia Platform UK (K.M.K.), and by NIH K01 AG040197 (T.H.). J.P.C gratefully acknowledges fellowship support from the American Brain Foundation/American Academy Neurology, the BrightFocus Foundation, and from the NIA (K23 AG049087).
Supplementary material
Supplementary material is available at Brain online.
Abbreviations
- AD(+/−)
Alzheimer’s disease (positive/negative)
- ADAD
autosomal-dominant Alzheimer’s disease
- CDR
Clinical Dementia Rating
- CNE
clinically normal elderly
- DIAN
Dominantly-Inherited Alzheimer’s Network
- HABS
Harvard Aging Brain Study
- M+
ADAD mutation carrier
- TBR
template-based rotation
References
Author notes
Jasmeer P. Chhatwal and Aaron P. Schultz authors contributed equally to this work.

